Mass spectrometry separates and detects ions according to mass-to-charge ratio. It can distinguish isotopes which belong to the same chemical element but have different atomic masses. The instrument measures ions: interpreting the result as a neutral atomic mass requires accounting for Electron removal and its ionization energy. For a singly positive ion in its ground state, , where is the Electron rest mass, is the ionization energy, and is the speed of light.
For a simple illustrative analyzer, positive ions of mass and electric charge gain kinetic energy across an electric potential difference before entering a transverse uniform magnetic field . The Lorentz force supplies centripetal acceleration, soAt fixed and , the measured bending radius separates mass-to-charge ratios, not masses independently of electric charge. This ideal model assumes negligible initial kinetic energy and speeds small compared with the speed of light; the historical focusing mass spectrograph used the geometry described below.
In the International Union of Pure and Applied Chemistry (IUPAC) mass spectrometry convention, a molecular ion is formed by removing or adding one or more Electrons to a molecule without fragmentation of its molecular structure.[ref]
molecular ion in mass spectrometry. Gold Book, fifth edition, molecular ion in mass spectrometry: formation by electron removal or addition without fragmentation
For example, removing one Electron from intact water gives : two hydrogen and one oxygen chemical atom, total electric charge , and an unpaired Electron, hence a radical cation. Atom inventory, net electric charge, and electronic state are separate pieces of information. Hydronium, , has a different inventory; it is a polyatomic ion, rather than the molecular ion obtained by electron removal from water.A mass spectrometry instrument with a photographic readout. In the 1919 apparatus described in Chapter V: The Mass-Spectrograph, a gas discharge produced positive ions. Two narrow slits formed a ribbon beam in a vacuum; plates applied an electric field to spread it, an aperture selected part of it, and a magnetic field bent it oppositely. Focusing reduced the spread caused by differing ion speeds, concentrating a given mass-to-charge ratio into a line on a photographic plate.
The observed quantity was line displacement from a fiducial spot. Known reference lines calibrated displacement against mass-to-charge ratio; repeated exposures with changed magnetic field tested the calibration. Evacuation limited collisions. Comparing line shapes with narrow and wide apertures helped distinguish geometric broadening from photographic spreading. Finite slit widths, plate response, and overlapping molecular or multiply charged ions limited interpretation. See Chapter V: The Mass-Spectrograph (§§33–40: apparatus and photographic procedure; §§43 and 45–46: calibration, aperture comparisons, and accuracy).
In Mass spectra and isotopes by Francis William Aston (Nobel lecture, 12 December 1922), the reported neon lines at 20 and 22 have companions at 10 and 11 from doubly charged ions. That paired pattern and comparison with reference lines support different atomic masses within one chemical element, rather than an atomic mass concentrated at the bulk average. The lecture also describes an earlier failed separation by distillation and partial separation by diffusion, showing why the focused mass spectrum supplied stronger evidence. These numbers used a historical oxygen-based reference scale. The lecture's whole-number rule was an empirical approximation at its stated accuracy, not the modern exact definition .[ref]
Mass spectra and isotopes by Francis William Aston. pp. 9–13: separation attempts, focusing, reference lines, charge orders, and neon; pp. 15–17: whole-number rule and historical nuclear interpretation
The ratio of an ion's mass to its electric charge; in SI it has units . A convenient numerical mass spectrum coordinate is , with and positive integer here. This is dimensionless. Doubling at fixed mass halves , so the electric charge state must be identified before assigning an isotope.
A mass spectrum displays detected signal against mass-to-charge ratio. Peak positions identify candidate ions; peak areas give isotopic abundances only after the response and overlapping contributions have been accounted for.
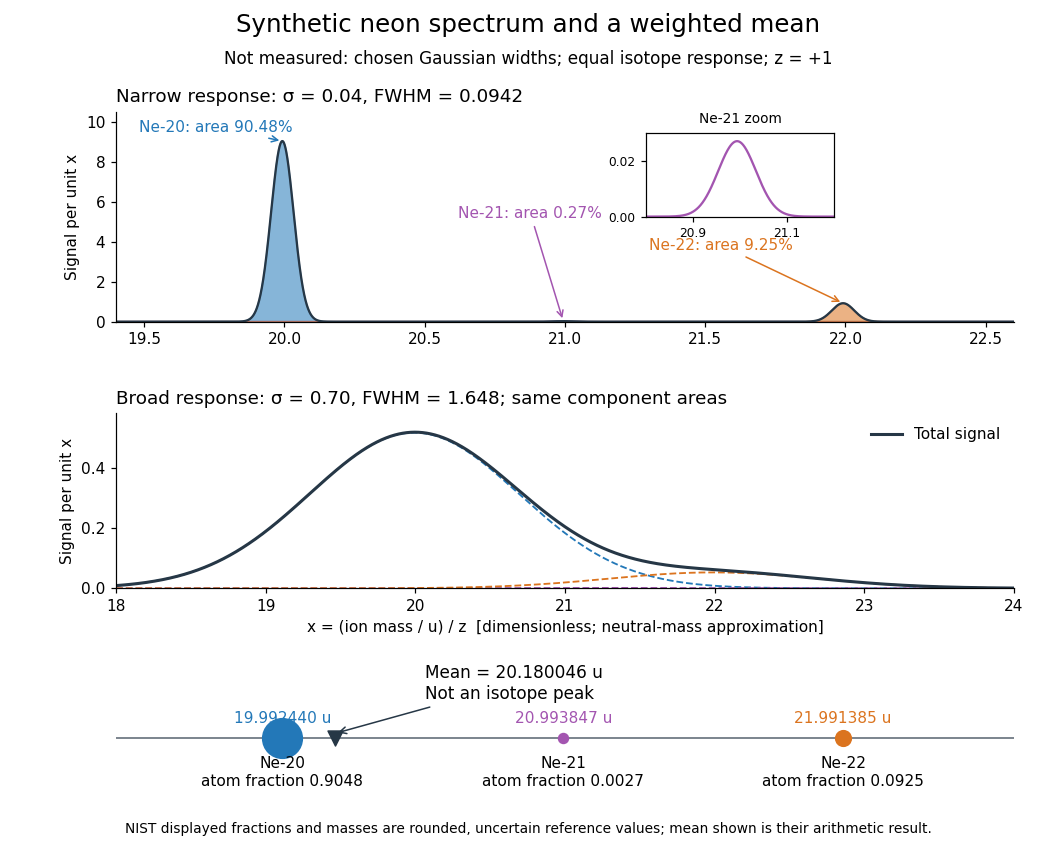
Broadening can hide a weak component without changing its area in this ideal model. An actual mass spectrum can also contain molecular ions, different electric charge states, background, and unequal detection responses. A missing visible peak therefore cannot by itself prove the absence of an isotope. Conversely, a fractional atomic weight is a property of a population: there is no requirement for an ion peak at the weighted mean.
Mass resolving power compares a peak coordinate with a stated width or separation criterion . With taken as full width at half maximum, a Gaussian function of standard deviation hasAt the neon-20 coordinate in the synthetic mass spectrum, gives and , while gives and . The width criterion and relative peak areas both matter when judging whether a small neighboring isotope can be distinguished. Mass resolution also differs from the accuracy of a calibrated peak position.
Articles by others on the same topic


Mass spectrometry (MS) is an analytical technique used to measure the mass-to-charge ratio of ions. It is a powerful tool for identifying and quantifying molecules in a sample, characterizing chemical compounds, and determining molecular structures. The process of mass spectrometry generally involves the following steps: 1. **Ionization**: The sample is converted into ions, which can be positive or negative.