Put . The proposed solution can be written
It gives . Differentiation and substitution give, respectively,
so it satisfies both the differential equation and the initial condition. At years,
with . The earlier emissions grow on the year timescale, much faster than the model's 200-year removal time.
The term is the effective atmospheric addition from ongoing emissions. Its coefficient is about half the full-retention estimate , so the model implicitly removes or partitions some emitted carbon promptly. The term represents slower net uptake of the excess by other reservoirs; its relaxation time is years. Both terms have units of ppmv per year.
Thousands of years at constant erase the initial transient, giving
The reference is the zero-anthropogenic-emission equilibrium, not the equilibrium when the stated small persistent emissions are present.
Complete oxidation of of carbon adds of carbon dioxide. With atmospheric mass about and mean air molar mass , there are about of air. The dry-air mole fraction, approximately the volume fraction, changes by
It is the carbon inventory that counts: oxidation adds oxygen to each molecule but does not change the number of carbon-containing molecules. Using instead changes the estimate by only about one percent. The atmospheric constants are standard Earth estimates, not additional data read from a missing plot.[ref]
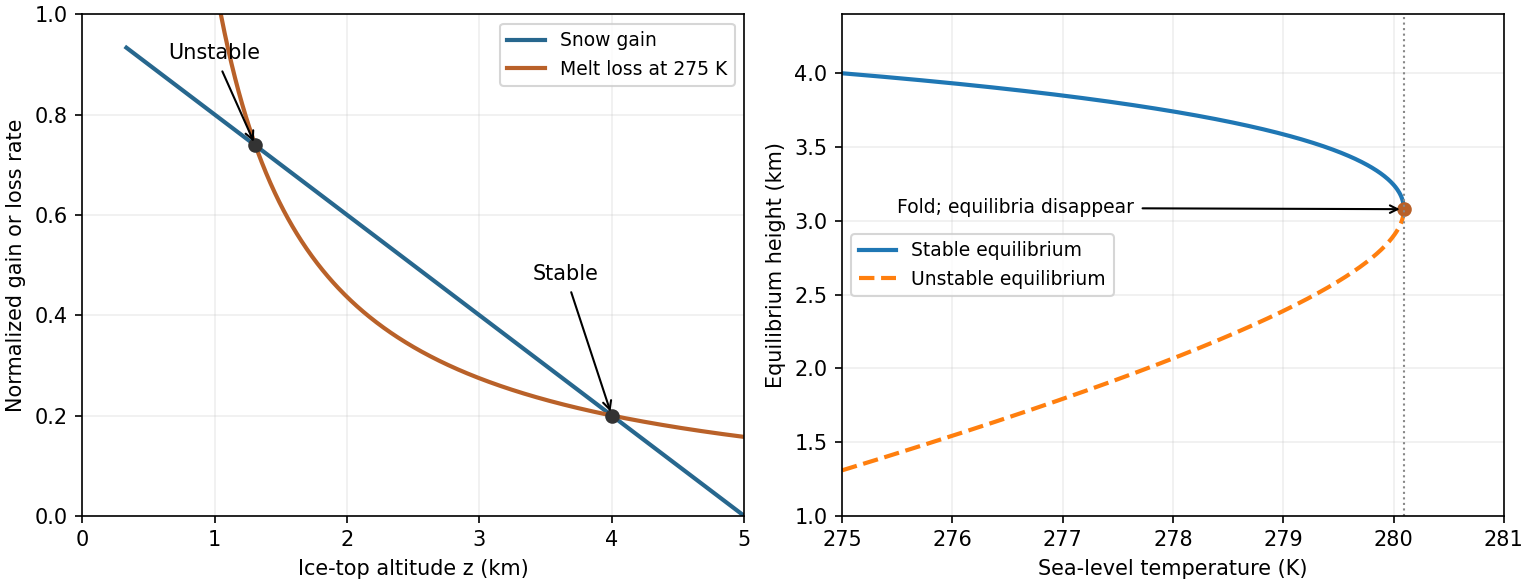
At , the snow gain is and the model's top Celsius temperature is . Equilibrium gives
in the normalized rate convention. Using for the Celsius zero instead would give . The local slope is , as required. Initially and , while .
As slowly rises, melt loss increases at fixed , the stable high branch moves downward and the unstable branch upward. They merge at
Beyond the fold the model has no steady cold ice cap: its net balance is negative throughout the physical interval and ice shrinks until the assumed law ceases to apply. Quasistatic tracking presumes adjustment is fast compared with the imposed warming, an assumption that deteriorates near the fold as the restoring slope tends to zero. This singular idealized law is not a quantitative real-world melting forecast.
Write as the numerical sea-level Celsius temperature in degrees Celsius, and use the same degree increments for . The model's top temperature is . For positive its intended cold-ice branch has , so the positive melt-loss magnitude and snow gain are
The model is singular at and is not a physical melting law across that boundary. On the relevant interval , decreases hyperbolically and decreases linearly. Assume a fixed area and positive ice density, so increasing mass increases : stability has the same sign as .
The equilibrium equation is
with roots
Two distinct physical equilibria, one stable, exist provided
This combines a positive allowed interval with a strictly positive discriminant. At the larger root and small perturbations restore the ice cap; the smaller root has and is unstable. Since
a restoring local response requires
This is the lower height bound from the stability derivative; the stable equilibrium itself is . The minimum initial height for persistence, a different notion of threshold, is the unstable separator : initial heights above it approach , while lower heights lose ice and leave the model's cold branch. At equality in the discriminant condition the two equilibria merge, giving a marginal fold rather than a strictly stable ice cap.
Figure 1.
Snow accumulation, melt loss and the ice-cap stability threshold
. The initial curves have an unstable lower intersection and a stable upper intersection. Slow sea-level warming shifts the melt curve until both equilibria meet at a fold; all temperatures inside the reciprocal melt law are Celsius. Details.
Hydrostatic equilibrium balances the vertical pressure gradient against weight, . For a dry ideal gas parcel displaced slowly enough to maintain pressure balance but rapidly enough to exchange negligible heat, the first law gives
Combining the two equations yields the dry adiabatic lapse rate
using . Here temperature in the thermodynamic differential is absolute, and are treated as constant, composition is fixed, and condensation is excluded. Hydrostatic balance alone does not force the atmosphere to be adiabatic; the parcel assumption supplies the extra relation.
Water condensation releases latent heat, reducing the cooling of a rising saturated parcel and giving a smaller moist adiabatic lapse rate. Radiation, mixing, large-scale motion and incomplete convective adjustment also shape the environmental lapse rate. Thus an observed -- need not equal the dry parcel value and is broadly consistent with a moist, radiatively influenced atmosphere.
Use the optical-depth weighting stipulated in the paper. A jump in the Planck function at gives , so
The upper isothermal layer emits and transmits the lower region's blackbody spectral irradiance with factor . The lower layer and black surface have the same , so their combined radiation entering the upper layer is , independent of how its emission is divided between the lower gas and surface.
More generally, integration by parts rewrites the supplied expression as
The terms are attenuated surface emission and the atmosphere's own emission. In the original boundary-plus-gradient form, is the isothermal reference flux and the integral corrects for temperature variation below the top. Optical depths of order unity contribute most strongly. These formulas follow the paper's specified exponential weighting; a full angular radiative transfer calculation uses ray-angle-dependent optical paths rather than identifying every ray with a vertical path.
Spectral irradiance is radiant power crossing unit area per unit wavelength, integrated over the relevant hemisphere with the projected-area factor: . Its units are per unit wavelength; spectral radiance additionally refers to unit solid angle. For an isotropic outgoing hemisphere with Planck function , the integral is .
The vertical optical depth above height is the dimensionless extinction integral
Here increases upward, is absorber number density, its absorption cross section, its mass density, and the absorption coefficient per unit absorber mass. Equivalently, using bulk air density and absorber mass fraction , . The coefficient may depend on temperature, pressure and wavelength. For purely absorbing gas, transmission along a ray is ; scattering, if present, contributes to extinction and requires its own source term.
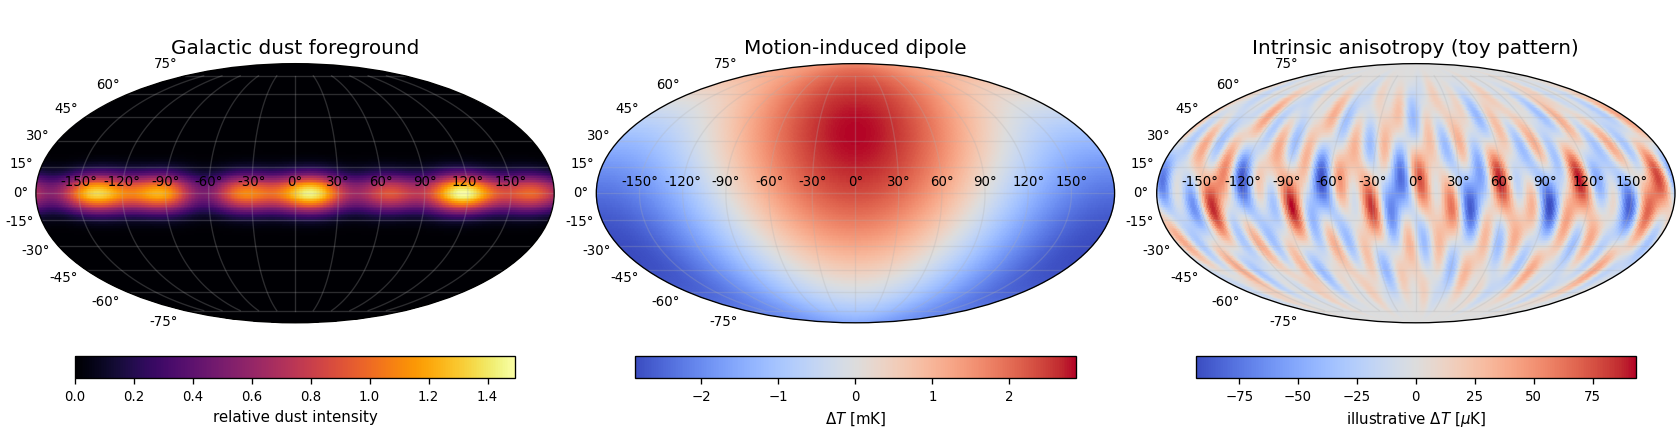
After subtracting the mean, the motion-induced dipole and galactic foregrounds, intrinsic Cosmic microwave background anisotropy appears as angular hot and cold patches, typically at the fractional scale. These spatial temperature fluctuations encode early density and velocity structure. The displayed patch pattern is illustrative, with no claim to reproduce an observed sky map.
Figure 1.
Schematic microwave components: Galactic dust, a kinematic dipole and intrinsic anisotropy, using separate colour scales
. Details.
Observer motion produces the cosmic microwave background dipole: to first order in ,
The direction of motion is hotter and the opposite direction cooler. Its full-sky pattern has one broad positive hemisphere and one broad negative hemisphere; it is not concentrated in the galactic plane.
Thermal interstellar dust produces a bright galactic foreground concentrated toward the Milky Way plane, with additional cloud structure. Its emission spectrum differs from the approximately blackbody spectrum of the cosmic microwave background, so comparisons across frequencies help separate it. In the sketch below this is the bright equatorial band.
Convert both inputs to energy density. The matter contribution, including rest energy, is . The given photon value is . Hence
Matter energy density scales as , whereas the cosmic microwave background scales as . The photon-only matter-radiation equality condition is therefore
This uses the supplied CMB photon density. Additional relativistic species change equality for total radiation.
The stated one-sided temperature contrast is , so the Doppler dipole gives
The motion is toward the hotter region. The contrast already gives one side relative to the mean; the hot-to-cold difference would be twice as large.
Measure the absolute spectral radiance over a range of frequencies and fit the Planck spectrum
For example, the COBE FIRAS blackbody spectrum experiment used a differential Michelson interferometer to compare the sky with an internal blackbody; an external calibrated blackbody could cover the sky entrance. Cold bolometers measured the difference spectrum, and foreground separation distinguished Milky Way emission from the nearly isotropic background. The fitted background temperature is approximately .[ref] The result relies on an absolute spectral comparison, rather than merely measuring a map's hot-to-cold contrast.
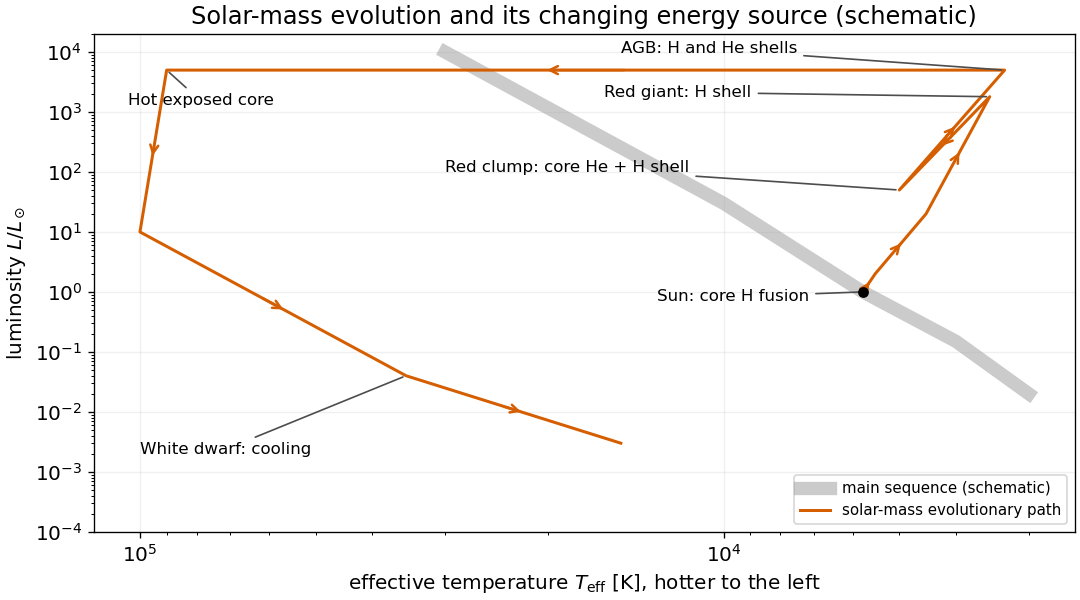
A Hertzsprung-Russell diagram plots stellar luminosity upward and effective temperature increasing toward the left. The main sequence runs from hot luminous stars at upper left to cool faint stars at lower right, with the Sun near , .
In the evolution of a solar-mass star, core hydrogen fusion initially supplies the luminosity. As core hydrogen is exhausted, hydrogen-shell fusion around a contracting helium core carries the star through the subgiant and red giant phases toward higher luminosity and lower surface temperature. Helium ignition is followed by core helium fusion with a hydrogen-burning shell, placing a solar-mass star in the red clump. The later Asymptotic giant branch has hydrogen- and helium-burning shells around a carbon-oxygen core. Envelope ejection exposes a hot central star of a planetary nebula; residual shell burning ends and the resulting white dwarf radiates stored thermal energy as it cools.
Figure 1.
Schematic solar-mass evolution on an H-R diagram, with the dominant energy sources labelled
. Details.
Use the supplied atomic masses consistently. Their mass defect per four hydrogen atoms is atomic mass units. The conversion efficiency is
The atomic-mass bookkeeping includes the associated positron-annihilation energy; an exact photon-heating budget also subtracts energy carried away by neutrinos. With the stated ten-percent fuel fraction and constant present solar luminosity, the main sequence lifetime estimate is
The much longer timescale explains why stellar nuclear fusion can power the Sun throughout its long main-sequence history.
Build the star by adding spherical shells. With the enclosed mass, its gravitational binding energy is
For a nondegenerate extended star, on the interior, so
This is a gravitational binding-energy lower bound for a spherical star. The Kelvin-Helmholtz cooling time is of order
The displayed energy bound gives years; it supplies a lower bound on that reservoir-to-luminosity ratio. A stellar structure model sets its coefficient. For an ideal monatomic, gas-supported star the virial theorem puts about half the released gravitational energy into heat, leaving half available for radiation; a uniform-density model would give about years. These contraction estimates are all of order years, much shorter than the nuclear lifetime.

Pinned article: Introduction to the OurBigBook Project

Welcome to the OurBigBook Project! Our goal is to create the perfect publishing platform for STEM subjects, and get university-level students to write the best free STEM tutorials ever.
Everyone is welcome to create an account and play with the site: ourbigbook.com/go/register. We belive that students themselves can write amazing tutorials, but teachers are welcome too. You can write about anything you want, it doesn't have to be STEM or even educational. Silly test content is very welcome and you won't be penalized in any way. Just keep it legal!
We have two killer features:
  1. topics: topics group articles by different users with the same title, e.g. here is the topic for the "Fundamental Theorem of Calculus" ourbigbook.com/go/topic/fundamental-theorem-of-calculus
    Articles of different users are sorted by upvote within each article page. This feature is a bit like:
    • a Wikipedia where each user can have their own version of each article
    • a Q&A website like Stack Overflow, where multiple people can give their views on a given topic, and the best ones are sorted by upvote. Except you don't need to wait for someone to ask first, and any topic goes, no matter how narrow or broad
    This feature makes it possible for readers to find better explanations of any topic created by other writers. And it allows writers to create an explanation in a place that readers might actually find it.

    Figure 1.
    Screenshot of the "Derivative" topic page
    . View it live at: ourbigbook.com/go/topic/derivative
  2. local editing: you can store all your personal knowledge base content locally in a plaintext markup format that can be edited locally and published either:
    This way you can be sure that even if OurBigBook.com were to go down one day (which we have no plans to do as it is quite cheap to host!), your content will still be perfectly readable as a static site.
    Figure 5. . You can also edit articles on the Web editor without installing anything locally.
    Video 3.
    Edit locally and publish demo
    . Source. This shows editing OurBigBook Markup and publishing it using the Visual Studio Code extension.

  3. https://raw.githubusercontent.com/ourbigbook/ourbigbook-media/master/feature/x/hilbert-space-arrow.png
  4. Infinitely deep tables of contents:
    Figure 6.
    Dynamic article tree with infinitely deep table of contents
    .
    Descendant pages can also show up as toplevel e.g.: ourbigbook.com/cirosantilli/chordate-subclade
All our software is open source and hosted at: github.com/ourbigbook/ourbigbook
Further documentation can be found at: docs.ourbigbook.com
Feel free to reach our to us for any help or suggestions: docs.ourbigbook.com/#contact