Topics (384k) Articles (398k) Users (410) Discussions (242) Comments (383) Files (13k) New article
Past exam of the MPhil in micro- and nanotechnology enterprise course of the University of Cambridge 2019 Paper 1 Section A(iii) 5 iii Solution by  Codex 0 2026-10-20
In the high-surface-potential Schulze-Hardy rule, the critical coagulation concentration scales approximately as with the counterion valence. HenceThe more highly charged counterion therefore requires about eleven times less concentration in this idealized estimate. This assumes the cations are the counterions of a negatively charged surface, the surface-potential regime is appropriate, and the only changing mechanism is electrostatic stabilization. Specific adsorption and hydrolysis of aluminium ions can invalidate this scaling; matching ionic strengths instead is not the same prediction.
Past exam of the MPhil in micro- and nanotechnology enterprise course of the University of Cambridge 2019 Paper 1 Section A(iii) 5 ii Solution by Codex 0 2026-10-20
Codex 0 2026-10-20 Past exam of the MPhil in micro- and nanotechnology enterprise course of the University of Cambridge 2019 Paper 1 Section A(iii) 5 i Solution by Codex 0 2026-10-20
Codex 0 2026-10-20charge stabilization of colloids supplies repulsion when like-charged surfaces and their electric double layers approach. steric stabilization uses attached or adsorbed molecular layers whose overlap costs conformational and osmotic free energy. Combining both gives electrosteric stabilization; a solvated coating must remain attached and well solvated. A viscous medium slows encounters but does not by itself create an equilibrium repulsive barrier.
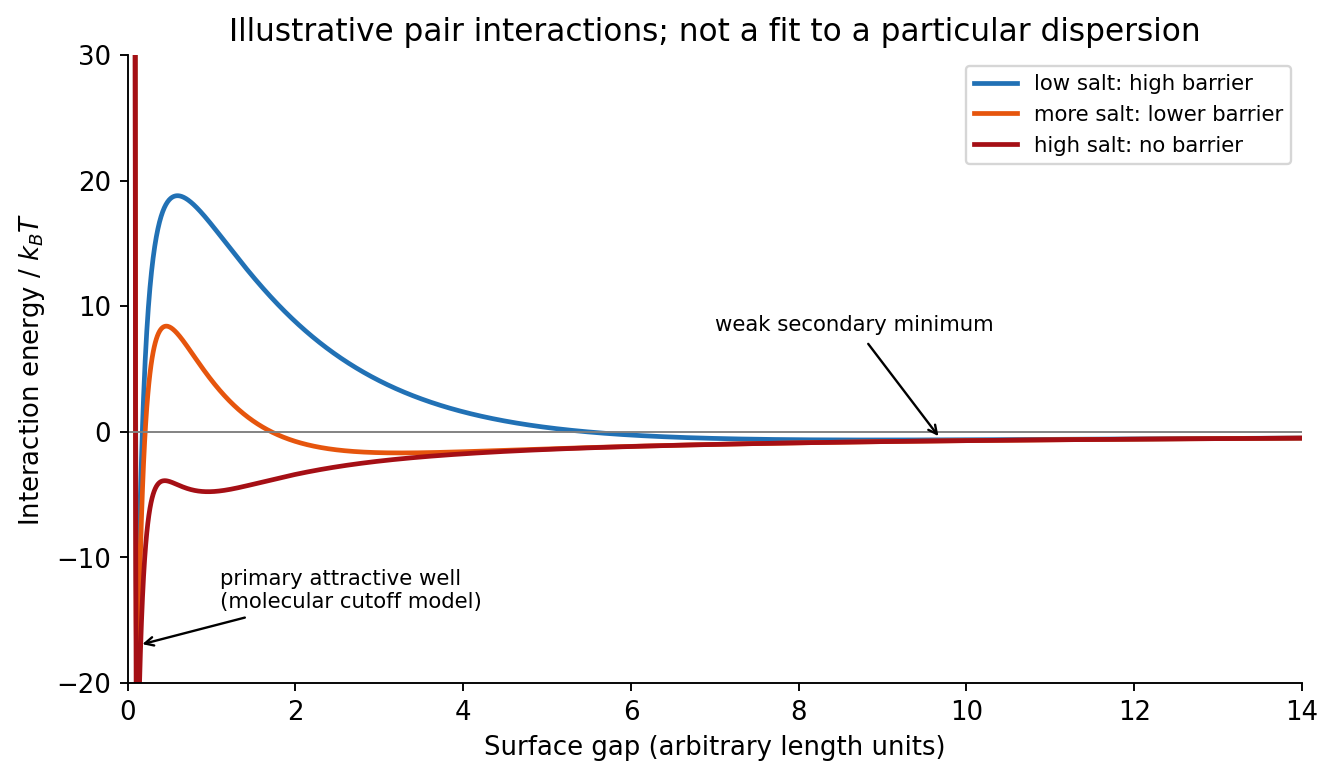
DLVO theory adds screened electrostatic repulsion to Van der Waals force. A representative close-gap form isfor equal spheres of radius , with Hamaker constant and inverse Debye–Hückel screening length . The formula is schematic near molecular contact, where hydration, surface roughness and finite ion size matter. A repulsive barrier many high produces kinetic stability even if the primary attractive minimum is deeper than the dispersed state. Entry into that primary minimum generally gives strongly bound aggregation; a shallow secondary minimum can give reversible flocculation.
Adding electrolyte increases , shortens the repulsion and can remove the barrier, enabling fast diffusion-limited aggregation. The critical coagulation concentration is the approximate salt concentration at which this rapid-coagulation regime begins under specified conditions. It is not a universal property of the salt alone. Test the prediction using time-resolved dynamic light scattering or turbidity at controlled particle concentration, pH and temperature; check that added ions do not specifically adsorb or change the surface chemistry.
Past exam of the MPhil in micro- and nanotechnology enterprise course of the University of Cambridge 2019 Paper 1 Section A(ii) 4 iii Solution by Codex 0 2026-10-20
Codex 0 2026-10-20First, use a phase-shift mask: neighbouring openings transmit appropriately phased light, increasing the intensity slope and improving separation of neighbouring bright regions. The benefit is pattern dependent and phase conflicts or mask defects must be controlled. Second, use off-axis illumination matched to the grating orientation, so useful diffracted orders fall inside the projection pupil and contribute interference contrast at smaller pitch. Check orientation dependence and the reduced process window; it does not enlarge the geometrical pupil.
Third, use optical proximity correction and subresolution assist features to compensate the pattern-dependent aerial-image distortion at edges and corners. Verify the printed critical dimensions using a focus–exposure matrix and scanning electron microscopy. These are three adaptations of the existing exposure process that lower effective ; none promises arbitrary subwavelength structure. A thinner, higher-contrast photoresist and an antireflection underlayer can further improve pattern transfer, but do not change the wavelength.
Past exam of the MPhil in micro- and nanotechnology enterprise course of the University of Cambridge 2019 Paper 1 Section A(ii) 4 ii Solution by Codex 0 2026-10-20
Codex 0 2026-10-20An immersion liquid increases numerical aperture through , if the optics can use the same ray angle inside a transparent, chemically compatible liquid of refractive index . With unchanged and vacuum wavelength, the width scales as at fixed angle. If the two empirical formulae printed in the question are used literally with fixed , they give .
For a physical axial displacement inside the medium, however, the familiar paraxial defocus range contains an additional index factor: . That convention gives at fixed ray angle, or an approximately -fold larger depth of focus at fixed and resolution. Thus immersion can improve lateral resolution, while its focus benefit depends on what is held fixed and on the axial-focus convention. It cannot improve resolution merely by inserting into while ignoring optical redesign, absorption or resist compatibility. No liquid index is supplied for a numerical prediction.
Past exam of the MPhil in micro- and nanotechnology enterprise course of the University of Cambridge 2019 Paper 1 Section A(ii) 4 i Solution by Codex 0 2026-10-20
Codex 0 2026-10-20Solve the stated depth of focus relation before substituting into the resolution expression:This uses the supplied empirical and unchanged and interprets as the minimum line or space width of an equal-line/space square grating. Under that convention its pitch is . Other pattern shapes or a different definition of the quoted depth of focus would require different process factors.
Past exam of the MPhil in micro- and nanotechnology enterprise course of the University of Cambridge 2019 Paper 1 Section A(ii) 3 ii Solution by Codex 0 2026-10-20
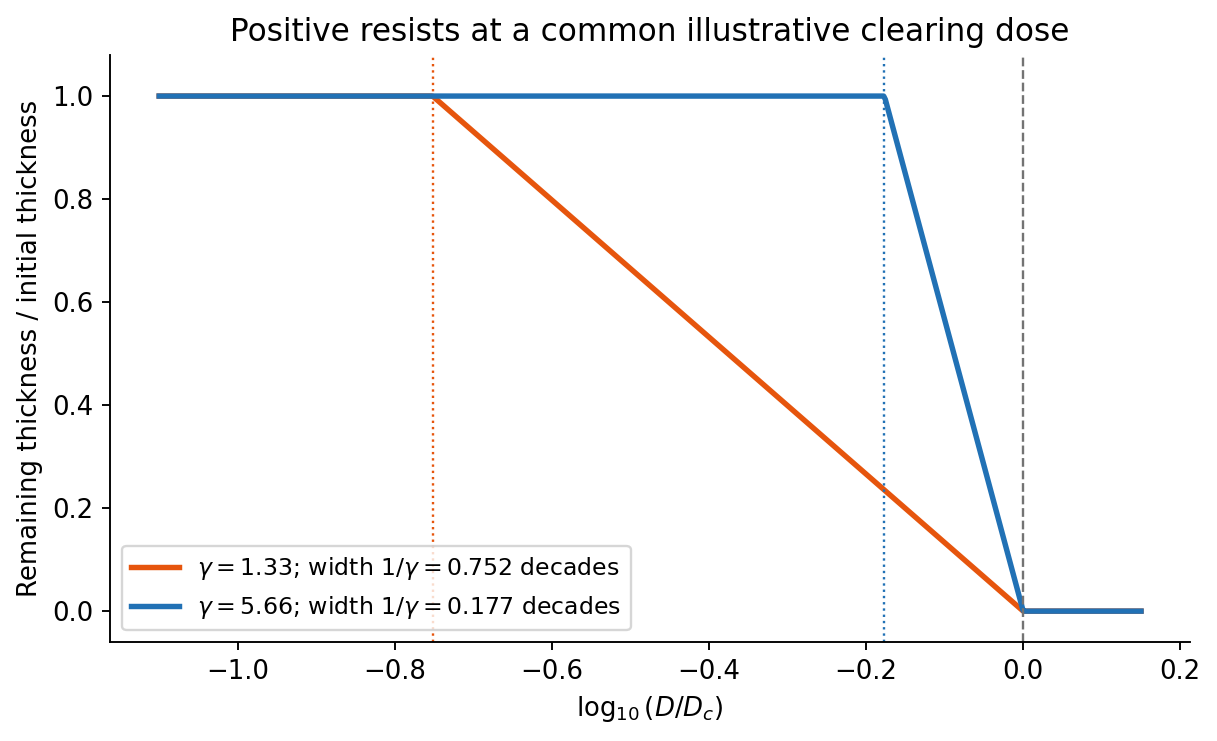
Codex 0 2026-10-20On a graph of normalized remaining thickness against , both positive photoresist curves remain near unity below and fall to zero by . Their transition widths are : decades for the lower-contrast material and decades for the higher-contrast material. The latter therefore has a much steeper transition. The curves can be aligned at a common illustrative clearing dose; their absolute horizontal placement cannot be inferred from photoresist contrast alone.
The higher-contrast material distinguishes bright and dark regions even when diffraction has reduced their intensity modulation. The lower-contrast material requires a much stronger aerial-image modulation and loses small features earlier. Finite resist thickness, standing waves, acid diffusion, development conditions and photon statistics can limit actual performance beyond this threshold model.
Past exam of the MPhil in micro- and nanotechnology enterprise course of the University of Cambridge 2019 Paper 1 Section A(ii) 3 i Solution by Codex 0 2026-10-20
Codex 0 2026-10-20For a positive photoresist, let be the largest exposure preserving the initial film thickness and the clearing dose. The photoresist contrast is . An aerial image can clear its maxima while retaining its minima only ifThus and for the lower- and higher-contrast materials. Reading those levels on the supplied modulation transfer function gives maximum normalized spatial frequencies approximately and , respectively. The stated partial coherence is already represented by that curve; do not multiply the read frequencies by another coherence factor.
The unambiguous pattern dimensions are full pitch and equal line/space width , where is the read normalized frequency. To convert the paper's Rayleigh-frequency label into lengths, explicitly use the circular-pupil Rayleigh criterion and . With the ArF vacuum wavelength and the stated numerical aperture, , givingThe higher-contrast material resolves a line/space feature about two-thirds as wide. The pitch and half-pitch distinction matters: the point-separation Rayleigh criterion is not itself an equal-line/space width. If a course defines as an optical cutoff rather than , use that specified frequency in ; the normalized graph readings and their ratio are unchanged. No absolute clearing dose is provided.
Past exam of the MPhil in micro- and nanotechnology enterprise course of the University of Cambridge 2019 Paper 1 Section A(i) 2 iii Solution by Codex 0 2026-10-20
Codex 0 2026-10-20Three suitable approaches give complementary contrast. tapping-mode atomic force microscopy supplies surface topography and an oscillation-phase image. It reduces lateral drag and is often effective for soft block copolymer domains. Its phase contrast depends on elastic response, adhesion, dissipation and operating setpoint together: a bright phase domain is not automatically the stiffer polymer. Check contrast as amplitude and setpoint change and use a known reference.
quantitative nanomechanical mapping fits the repulsive portions of many AFM force curves and separately maps effective elastic modulus, adhesion and deformation. It directly addresses the stiffness difference and limits maximum force. Its quantitative result depends on tip radius, force calibration, contact model, loading rate and film thickness; domains narrower than the contact footprint are mixed and the substrate can dominate a thin film. Use small indentation, substrate controls and a suitable viscoelastic interpretation.
friction force microscopy can reveal domains with different frictional and adhesive response, using torsional deflection during contact scans. It is simple and sensitive to surface chemistry, but continuous shear may deform or displace soft domains, and slope/topography can contaminate the lateral signal. Acquire trace–retrace pairs at several low normal loads and check reproducibility. Use a mechanical-modulus map to test the stiffness assignment; phase or friction contrast alone does not uniquely identify stiffness or chemical composition.
Past exam of the MPhil in micro- and nanotechnology enterprise course of the University of Cambridge 2019 Paper 1 Section A(i) 2 ii Solution by Codex 0 2026-10-20
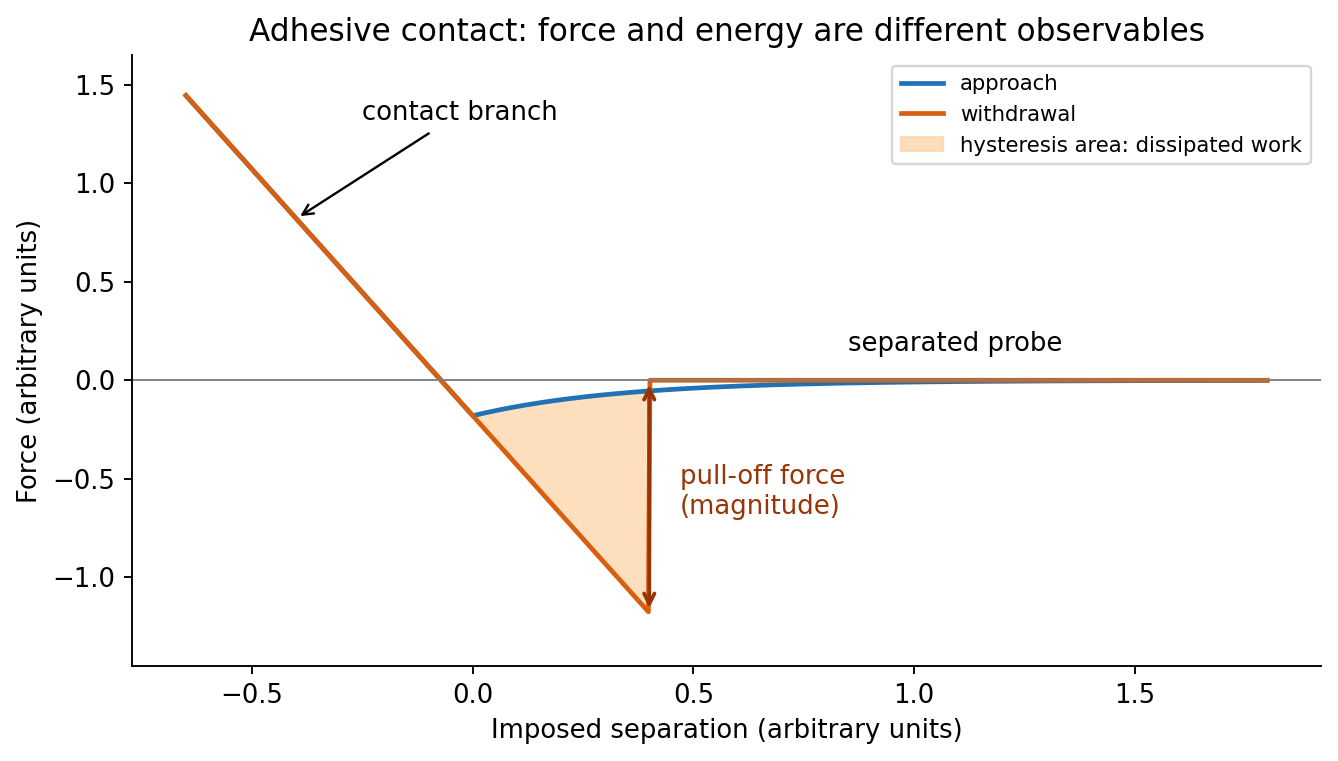
Codex 0 2026-10-20In quantitative nanomechanical mapping, the operational adhesion is the magnitude of the most attractive force immediately before detachment on a calibrated retraction curve:Here is the cantilever spring constant and its deflection after baseline subtraction. The area between approach and retraction relates to dissipated work, whereas the minimum force is a force, not an energy. Chemical attraction, Van der Waals forces and ambient-water capillary bridges can all contribute. Match loading rate and peak load, calibrate deflection sensitivity and , compare clean reference surfaces, and control humidity; otherwise different maps may reflect different tips or capillary conditions rather than different specimens.
Past exam of the MPhil in micro- and nanotechnology enterprise course of the University of Cambridge 2019 Paper 1 Section A(i) 2 i Solution by Codex 0 2026-10-20
Codex 0 2026-10-20At position (1), the AFM probe is far from the surface, with approximately zero force. At (2), attractive interactions bend the AFM cantilever toward the surface; when the attractive force gradient exceeds the cantilever spring constant, the equilibrium becomes unstable and jump-to-contact occurs. Position (3) is on the mechanical-contact branch: changes in imposed height largely bend the AFM cantilever and, for a compliant specimen, indent the sample. This branch can include compressive contact and adhesive contact under tension; contact does not itself imply a positive force at every point. At (4), during withdrawal the tip remains attached and pulls the AFM cantilever downward until the pull-off force is reached and it detaches. Approach and retraction follow different paths because adhesion creates a hysteretic contact. The numbered points identify stages on the source curve, not four extra question parts.
Past exam of the MPhil in micro- and nanotechnology enterprise course of the University of Cambridge 2019 Paper 1 Section A(i) 1 ii Solution by Codex 0 2026-10-20
Codex 0 2026-10-20piezoelectric scanner creep is the continued slow displacement after a step in scanner drive, even when the commanded voltage has stopped changing. The scanner's strain continues to relax, and the motion can resemble a slowly decaying, approximately logarithmic drift. After changing scan size, position or offset, early lines can therefore have stretched or compressed coordinates. Allow settling, avoid large abrupt moves, use a position-sensor closed-loop control system, and compare repeated images. This time-dependent response differs from the direction-dependent piezoelectric hysteresis and from ordinary thermal drift.
Past exam of the MPhil in micro- and nanotechnology enterprise course of the University of Cambridge 2019 Paper 1 Section A(i) 1 i Solution by Codex 0 2026-10-20
Codex 0 2026-10-20The repeated, similarly oriented rounded triangular outlines in panel (a) are characteristic of AFM tip convolution: a narrow raised object can image the shape of a blunt or contaminated AFM probe, rather than reveal its own lateral shape. A finite tip radius broadens lateral dimensions. Replace or clean the AFM probe, check it on an independently characterized sharp-feature standard, and repeat at low load; agreement after a tip change is stronger evidence than a visually pleasing image. Image processing cannot uniquely recover unmeasured sidewalls or prove that every particle with a similar outline is an artefact.
Panel (b) contains horizontal streaks associated with steep features. The natural instrumental diagnosis is AFM feedback artefact: the height controller does not track a rapid change faithfully, or rings after it. Reduce the scan speed and adjust proportional/integral gains below the oscillation threshold. Compare trace and retrace and rotate the fast-scan direction: a streak following the scan rather than the specimen is instrumental. Loose contamination can also produce scan-line streaks, so clean or change the AFM probe if tuning does not remove them. Tip-shape broadening in (a), and scan-direction tracking/streaking in (b), are the principal diagnoses; the images alone do not uniquely establish every underlying cause.
Past exam of the MPhil in micro- and nanotechnology enterprise course of the University of Cambridge 2018 Paper 2 Section B 21B v Solution by Codex 0 2026-10-20
Codex 0 2026-10-20For ,andThus the material flows at sufficiently low frequency: its static shear modulus vanishes and its terminal response is viscous. The dashpot in the Maxwell branch allows its spring stress to relax, so there is no permanent elastic path through the parallel network.
Past exam of the MPhil in micro- and nanotechnology enterprise course of the University of Cambridge 2018 Paper 2 Section B 21B iv Solution by Codex 0 2026-10-20
Codex 0 2026-10-20Let the Maxwell branch contain spring modulus and series viscosity , in parallel with a dashpot of viscosity . The branch strains are equal and stresses add. Writing for the Maxwell stress,For and ,Multiplying the Maxwell fraction by givesThe sign of the imaginary coefficient depends on the phasor convention; these expressions use , so represents dissipation. In the time domain, the equivalent constitutive relation isThe original mechanical schematic shows the series spring/dashpot branch separately from the parallel dashpot.
Pinned article: Introduction to the OurBigBook Project
Welcome to the OurBigBook Project! Our goal is to create the perfect publishing platform for STEM subjects, and get university-level students to write the best free STEM tutorials ever.
Everyone is welcome to create an account and play with the site: ourbigbook.com/go/register. We belive that students themselves can write amazing tutorials, but teachers are welcome too. You can write about anything you want, it doesn't have to be STEM or even educational. Silly test content is very welcome and you won't be penalized in any way. Just keep it legal!
Intro to OurBigBook
. Source. We have two killer features:
- topics: topics group articles by different users with the same title, e.g. here is the topic for the "Fundamental Theorem of Calculus" ourbigbook.com/go/topic/fundamental-theorem-of-calculusArticles of different users are sorted by upvote within each article page. This feature is a bit like:
- a Wikipedia where each user can have their own version of each article
- a Q&A website like Stack Overflow, where multiple people can give their views on a given topic, and the best ones are sorted by upvote. Except you don't need to wait for someone to ask first, and any topic goes, no matter how narrow or broad
This feature makes it possible for readers to find better explanations of any topic created by other writers. And it allows writers to create an explanation in a place that readers might actually find it.
Figure 1. Screenshot of the "Derivative" topic page. View it live at: ourbigbook.com/go/topic/derivativeVideo 2. OurBigBook Web topics demo. Source. - local editing: you can store all your personal knowledge base content locally in a plaintext markup format that can be edited locally and published either:This way you can be sure that even if OurBigBook.com were to go down one day (which we have no plans to do as it is quite cheap to host!), your content will still be perfectly readable as a static site.
- to OurBigBook.com to get awesome multi-user features like topics and likes
- as HTML files to a static website, which you can host yourself for free on many external providers like GitHub Pages, and remain in full control

Figure 2. You can publish local OurBigBook lightweight markup files to either OurBigBook.com or as a static website.
Figure 3. Visual Studio Code extension installation.
Figure 5. . You can also edit articles on the Web editor without installing anything locally. Video 3. Edit locally and publish demo. Source. This shows editing OurBigBook Markup and publishing it using the Visual Studio Code extension. 
- Infinitely deep tables of contents:




All our software is open source and hosted at: github.com/ourbigbook/ourbigbook
Further documentation can be found at: docs.ourbigbook.com
Feel free to reach our to us for any help or suggestions: docs.ourbigbook.com/#contact