
Exponential distribution rate estimator Created 2026-09-24 Updated 2026-09-24
Binomial proportion maximum-likelihood estimator Created 2026-09-24 Updated 2026-11-05
For a binomial count , , with , the maximum-likelihood estimator is . For , differentiating gives a unique interior maximum. If or , the maximum is respectively at zero or one. Excluding those endpoints from the parameter space means these samples have only a supremum, not an attained maximum. The estimate is unbiased and has variance , by the binomial distribution moments.
Log-likelihood Created 2026-09-24 Updated 2026-10-14
The log-likelihood is the natural logarithm of the likelihood function:For positive finite likelihood, the natural logarithm is a strictly increasing function, so the maximizing parameter values are unchanged. Set where ; the same ordering then includes zero-likelihood boundaries whenever a positive finite maximum exists. For independent and identically distributed random variables, a product becomes a sum,This makes derivatives simpler and avoids forming products of tiny numbers in floating-point arithmetic. These equal-maximizer and additive formulas underlie the worked calculations in MIT 18.05, Reading 10b, section 3.1.
For the ordered sample of eight successes and two failures in likelihood function, on ,The score equation gives , hence . The negative second derivative proves strict concavity, so this is the unique interior maximum. Both counts are positive, so , while inside: the same point is the unique global maximum on . Counting only successes adds to the log-likelihood, leaving both derivatives and the MLE unchanged. For all-success or all-failure samples, the boundary analysis in maximum-likelihood estimator applies instead of an interior score equation.
The two panels below compare successes out of ten Bernoulli trials. Their peaks are at . The left panel uses relative height; the right panel uses the log-likelihood difference from each peak. These are the same comparison on two scales:A difference of means relative height , and a difference of means ; the log-likelihood scale makes small relative heights easier to see. Neither vertical axis is a parameter probability density function. The zero likelihood endpoints have log-likelihood and are outside the finite vertical range in the right panel.
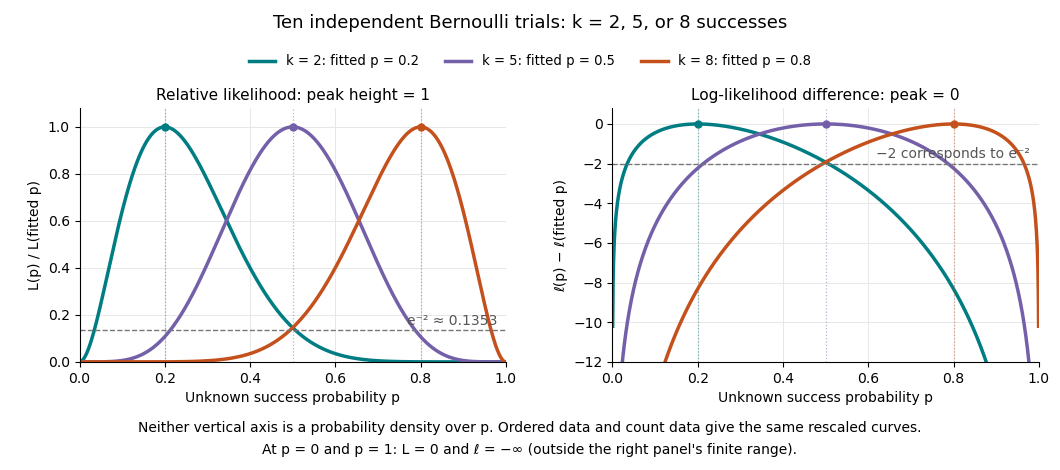
Ten Bernoulli trials: relative likelihood heights and log-likelihood differences share the same peaks
. Details. Multiplying a likelihood function by a positive parameter-independent constant adds a constant to its log-likelihood. Subtracting its peak removes that constant. This is why the ordered-data and count-data curves coincide in this figure after rescaling. When differentiable, the gradient of the log-likelihood is the score function; the negative Hessian matrix is the observed information. A solution of a score equation still needs checking against other stationary points and boundaries: maximizing the log-likelihood does not automatically make it concave.
Likelihood function Created 2026-09-24 Updated 2026-10-14
For a fixed observed sample , a likelihood function iswhere is the probability mass function or probability density function of the observations under the statistical parameter . All densities must be defined relative to the same parameter-independent dominating measure. The sample is fixed; the parameter is the function's argument. With independent and identically distributed random variables, the joint mass or density factors as . This definition and the distinction between sampling probability and parameter uncertainty are explained in MIT 18.05, Reading 10b, sections 3 and 3.2.
For an observed ordered sequence of ten independent Bernoulli trials containing eight successes and two failures, each success contributes and each failure contributes , givingIf the observation is instead only the total count , its binomial distribution probability mass function sums over the possible ordered sequences:The raw heights differ: at they are approximately and . Their maximum-likelihood estimates are identical. More generally, multiplication by any finite positive constant independent of leaves the maximizing parameter values and all likelihood ratios unchanged. Multiplication by a parameter-dependent factor can change the MLE; dropping such a factor is not justified. Relative likelihood height sets the peak to one, without making the area under the curve one.
Normalization of is over possible data values for each fixed parameter. It imposes no requirement that . For example, the ordered Bernoulli trials likelihood above hasIts integral is not one, and its values are not posterior probabilities for . When the Bayesian posterior is defined, Bayes' theorem multiplies the likelihood by a prior density and normalizes that product. Choosing to normalize a likelihood function alone is an additional choice, such as using a uniform prior in those parameter coordinates, rather than part of the definition of likelihood.
For observations with a probability density function, the probability of an exact sample point is zero. If a scalar density is continuous at the observed value , thenThus the density compares probabilities of small, equal observation intervals at different parameter values; it is not itself the probability of that exact real number. The equal-width factor is independent of the parameter. This gives visual intuition for density likelihoods, as in MIT 18.05, Reading 10b, section 4. The normal distribution example in maximum-likelihood estimator makes the comparison explicit. If only rounded intervals are recorded, their integrated probabilities give the exact observation likelihood; using midpoint densities is an approximation.
Maximal ideal quotient criterion Created 2026-09-24 Updated 2026-11-05
Maximal spectrum Created 2026-09-24 Updated 2026-11-05
Residue field Created 2026-09-24 Updated 2026-11-05
The residue field at a maximal ideal is the quotient field . At a prime ideal , the residue field is the fraction field of .
Matter-era linear growth factor Created 2026-09-24 Updated 2026-09-24
Cosmic-time matter density modes Created 2026-09-24 Updated 2026-09-24
In cosmic time during matter domination, and the pressureless density contrast obeysIts growing and decaying solutions are and .
Laplace-transform solution of a constant-coefficient vector ODE Created 2026-09-24 Updated 2026-11-05
For a constant matrix and a forcing vector-valued function , considerWhen the component Laplace transforms converge and the Laplace transform of a derivative applies, setting and givesChoose in the convergence half-plane and outside the spectrum of . The resolvent is the Laplace transform of the matrix exponential for sufficiently large real part. Inverting gives the variation-of-constants formulaThe matrix acts on the forcing from the left, so there is no implicit commutation of a time-dependent forcing with .
Cyclic property of the trace Created 2026-09-24 Updated 2026-10-14
If is an -by- matrix and is an -by- matrix over the same field, both products are square matrices andThe products can even have different sizes: for and , and , but both have trace .[ref]
Linear Algebra Done Right by Sheldon Axler (4th edition). Axler, Linear Algebra Done Right, fourth edition, §8D, result 8.49
Grouping all but one factor proves that is unchanged by a cyclic permutation whenever the cyclic products are defined and square. In particular, every commutator has trace zero, since by linearity.
Parent Hamiltonian of a matrix product state Created 2026-09-24 Updated 2026-11-05
An MPS parent Hamiltonian is a sum of local projectors onto the orthogonal complement of the tensor's local support. The MPS is a frustration-free ground state.
Injective matrix product state Created 2026-09-24 Updated 2026-09-28
Caliper matching Created 2026-09-24 Updated 2026-11-05
Caliper matching permits a candidate matching pair only when a prespecified distance is at most a tolerance . For propensity score , possible rules are or . These are different distances; the numeric tolerance must be interpreted on the selected scale.[ref]
For a treated unit with propensity score , a raw-score caliper admits a control with score and excludes one with score . The matching algorithm still has to choose among admissible controls and decide whether controls may be reused. A tighter caliper excludes distant pairs but can leave more treated units unmatched. Excluding those units changes the population represented by the matched estimate; a caliper is not a guarantee of an unchanged average treatment effect on the treated. Check covariate balance after matching, and account for the paired or reused-control structure in statistical inference.
Covariate balance Created 2026-09-24 Updated 2026-11-05
Covariate balance means that the compared treatment groups have similar distributions of specified pretreatment covariates. Exact distributional balance in a weighted population isThis is a property of the represented covariates and chosen weights. Matching and inverse probability weighting can aim to approximate it.
Equal means are weaker than equal probability distributions. For example, a covariate taking values equally often in one group and equally often in the other has mean zero in both, but variances one and four. A zero standardized mean difference would miss that discrepancy. Inspect relevant spreads, tails, categories and combinations as well as means.
A nonsignificant difference test does not demonstrate covariate balance: small samples may have low statistical power, while large samples can detect negligible discrepancies. Covariate balance on measured pretreatment variables also cannot establish conditional exchangeability for unmeasured potential outcomes.
Regular-graph matching bound from unmatched vertices Created 2026-09-24 Updated 2026-11-05
Matching number Created 2026-09-24 Updated 2026-10-14
For a finite graph , the matching number isIt is the cardinality of a maximum cardinality matching. The vertex capacity constraint gives . The worked path graph examples have and . A perfect matching reaches ; the empty graph has matching number zero.
Maximal matching Created 2026-09-24 Updated 2026-10-14
A maximal matching is a matching in a graph to which no extra edge can be added while retaining all current selected edges. Equivalently, no edge joins two unmatched vertices in a matching; those vertices form an independent set. Every maximum cardinality matching is a maximal matching, but the converse fails.
Take the path graph with vertices and edges . A greedy algorithm that first selects the middle edge produces . Both remaining edges touch a matched vertex, so this size-one matching in a graph is maximal. Yet has two edges. No matching in a graph on four vertices has more than two edges, so is a maximum cardinality matching. The two remaining free vertices of , namely and , are not adjacent; that does not prevent a longer augmenting path in a matching from joining them.
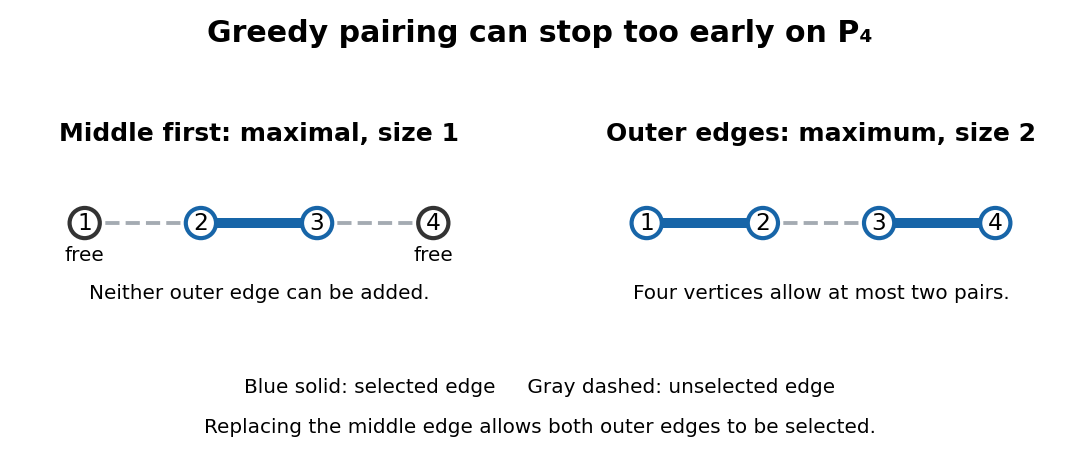
Choosing the middle edge of P₄ gives a maximal matching of size one; the outer edges give a maximum cardinality matching of size two
. Details. Maximality is useful as a quick stopping rule and a modest guarantee. For any maximal matching and maximum cardinality matching in a finite simple graph, every edge of touches an endpoint of an edge of . Assign it to one such edge of . Since has disjoint endpoints, each edge of receives at most two assignments, proving . The P₄ example reaches equality. Thus maximality guarantees at least half the largest cardinality, but says nothing comparable about arbitrary edge benefits. Its selected endpoints also form a vertex cover, as explained under vertex cover.
Perfect matching Created 2026-09-24 Updated 2026-10-14
A perfect matching is a matching in a graph that covers every vertex exactly once. Its edges have no shared endpoints, and every vertex is an endpoint of one selected edge. It is useful when a collection must be divided into disjoint pairs with no element left over.
In a bipartite graph with equally many vertices on its two sides, a perfect matching can assign every person one allowed job and every job one person. The example under permanent of a matrix has three people and three jobs, with exactly three valid assignments. The blue edges below show those three perfect matchings; a crossing in the drawing is not an extra vertex.
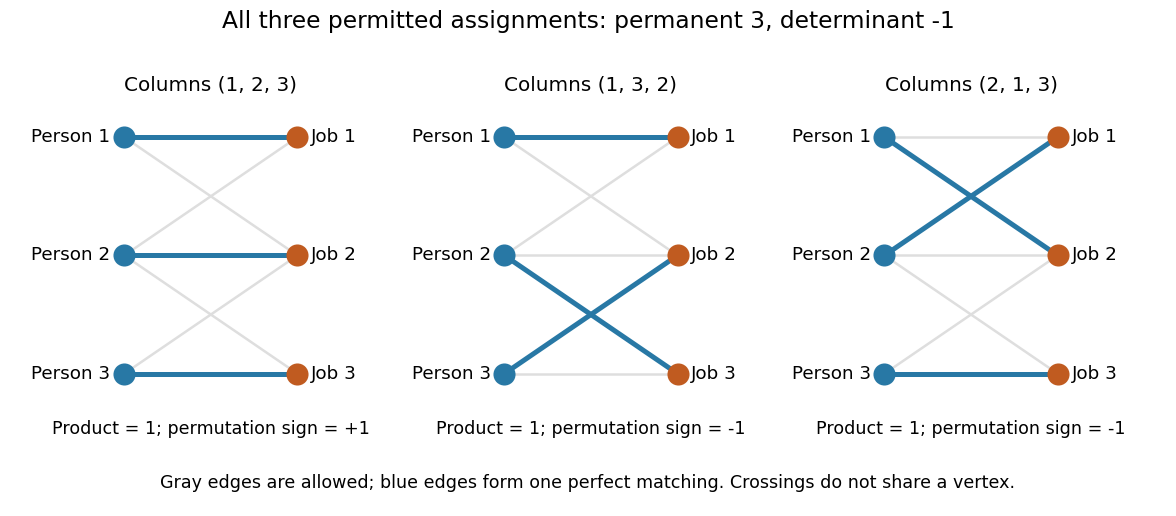


Every selected edge covers two vertices, so a graph with an odd integer number of vertices has no perfect matching. An even integer number is necessary but does not guarantee existence: an isolated vertex cannot be covered. A perfect matching also need not be unique. For example, the complete bipartite graph has two perfect matchings, corresponding to the two ways of assigning two people to two jobs.
Counting all perfect matchings is a different question from finding one. For a zero-one biadjacency matrix of a balanced bipartite graph, the count is its permanent of a matrix. The nonzero determinant criterion for a perfect matching supplies an existence test, but cancellation means that a zero determinant does not rule one out.
Snell envelope Created 2026-09-24 Updated 2026-10-14
The finite-horizon Snell envelope of rewards is defined backward by and . It is the least supermartingale dominating .
There are unlisted articles, also show them or only show them.