A measuring system combines one or more measurement instruments with the other devices needed to produce measured values for specified quantities over specified intervals. A system can also consist of a single instrument when it performs the required function on its own.[ref]
International vocabulary of metrology by JCGM. VIM3entry3.2, definition and note; entry3.1, measuring instrument
The system boundary identifies which physical components and signal-processing operations contribute to a measurement result.For an original electrical example, assemble a current source, a test resistor, two connecting leads, a voltmeter and the calculation used to infer electrical resistance. The intended measurand is the test resistor's resistance at stated conditions. In a chosen ideal model, the current is , the leads contribute total resistance , and the readout has additive measurement zero offset :Here the voltmeter measures an electric potential difference across the complete resistor-and-lead path, with negligible input-current loading.
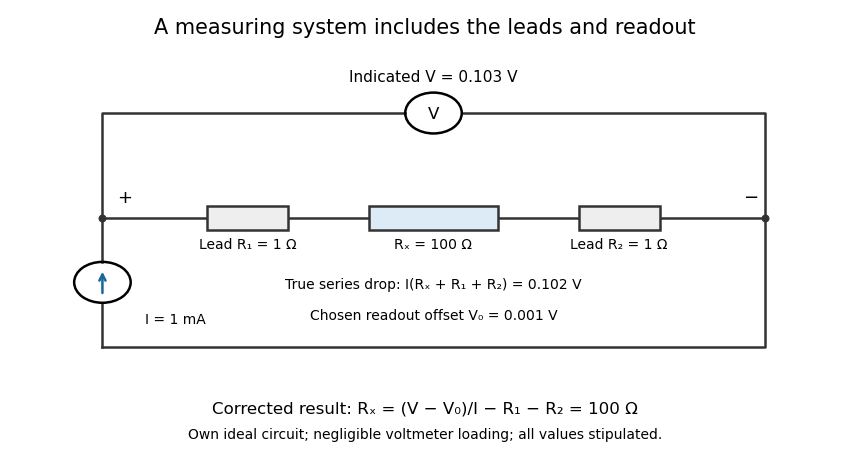
An electrical measuring system includes the connecting leads and readout response
. Own ideal circuit with stipulated1mA current,100ohm test resistor, two1ohm leads and1mV readout offset. The indicated103mV includes the102mV physical drop and1mV offset. Negligible voltmeter loading is assumed; these are teaching values rather than measured instrument performance. Details.
With , , and indicated potential difference , the model gives . Dividing the indication by the current without either correction would instead give . The numerical resolution of the voltmeter alone therefore does not describe the whole measuring system's result.
A measuring chain describes successive signal transformations within such an arrangement. Its physical response and subsequent calculation belong in the system description, together with measurement calibration, reference conditions and relevant measurement uncertainty. Changing a lead connection, source setting or correction can change the result while leaving the main readout instrument unchanged. The measurement procedure records how that particular system is operated.
A measuring transducer is a device whose output quantity has a specified relation to its input quantity and is used in measurement. VIM examples include a thermocouple, a strain gauge and a Bourdon tube.[ref] A measuring transducer provides a link in a measuring chain; it need not itself display a finished measurement result.
For an original pressure readout, choose a linear modelwith pressure , output electric potential difference , transducer sensitivity , and offset . An output then corresponds to . An amplifier, analog-to-digital converter and display can follow the transducer, each contributing to the whole measuring system.
The inverse calculation exposes distinct uncertainty contributions. Holding the other inputs fixed, a small output change changes inferred pressure by ; a small offset error changes it by . An output increment corresponds to for the stipulated sensitivity, but does not establish a total measurement uncertainty of that size.
Characterize the relevant range, temperature conditions, response time and possible instrumental drift during measurement calibration. The relation can be nonlinear, in which case local transducer sensitivity is the appropriate derivative rather than one gain valid everywhere. The definition also allows input and output quantities of the same kind; it does not require changing from a mechanical quantity to an electrical one. A sensor denotes the part directly affected by the phenomenon being sensed, whereas a complete measuring chain can contain further measuring transducers.
Detector responsivity relates a detector's output to the incident radiant input under stated conditions. For a photodiode illuminated at a specified wavelength, current spectral responsivity iswhere is the background current and is incident optical power. Its units are . NIST's detector-calibration publication develops spectral radiant-power responsivity as the quantity transferred from optical standards to photodetectors.[ref]
For an original example, incident power produces net photocurrent, giving . If readout electronics convert that current to , the complete system's voltage responsivity is . A value without its output quantity and units can therefore be misleading.
For a photodiode with no internal multiplication, let quantum efficiency be collected electrons per incident photon. A photon has energy , with Planck constant , speed of light and elementary charge . Thus a photon arrival rate gives and net current . ThereforeAt , the original example corresponds to . This relation assumes the stated charge-collection model; internal gain changes the interpretation.
Responsivity can depend on wavelength, irradiation geometry, bias and temperature. Detector linearity tests whether a response ratio stays constant as input level changes; detector saturation can make it strongly level-dependent. In a nonlinear response, the ratio of corrected output to input and the local transducer sensitivity are different quantities. Retain the wavelength, beam conditions, readout convention and measurement uncertainty when reporting a responsivity measurement.
A Bourdon tube is a curved, hollow elastic element that converts a pressure difference into movement of its free end. A common form has an oval tube cross-section and a roughly C-shaped centreline. Fluid pressure is applied through the fixed end, while the other end is closed and free to move. WIKA describes the cross-section tending toward a more circular shape under internal pressure and the resulting end motion being transmitted to a pointer.[ref]
Elastic element pressure gauges by WIKA. IN00.01,09/2010, p1, Pressure gauges with bourdon tube and labelled mechanism
In a Bourdon tube pressure gauge, the tube, linkage, gearing and pointer form a mechanical measuring chain. The sensing element undergoes elastic deformation; the movement converts a small displacement into a readable measurement indication. A steady pressure reading does not require continuous flow through the closed tube.
For an original small-range model, let free-end displacement be , with gauge pressure and stipulated . Let the linkage produce pointer angle with . At ,The combined response is . These are illustrative coefficients, not a specification for a WIKA instrument. The actual response depends on tube geometry, material and movement.
The reference pressure belongs in the interpretation. With the outside of the element exposed to local atmosphere, the response measures gauge pressure, rather than absolute pressure. WIKA separately describes sealed reference arrangements for absolute-pressure instruments.[ref]
Elastic element pressure gauges by WIKA. p1, Description, atmospheric reference; p3, Absolute pressure gauges
For instrument calibration, connect the gauge and a suitable measurement standard to a common pressure source, allow equilibration, and compare several increasing and decreasing pressures within the intended range. Record the relative height of fluid-filled pressure ports because hydrostatic pressure can add a difference between them. Differences between increasing and decreasing readings can reveal hysteresis or backlash; a zero shift after loading can reveal a changed mechanical state. The original linear model alone does not establish the gauge's measurement uncertainty.
A Bourdon tube pressure gauge combines a pressure-sensitive Bourdon tube with a motion-transmission mechanism, pointer and calibrated scale. Pressure-driven elastic deformation moves the free end of the tube; a linkage and geared movement convert that motion into an indication on the dial. WIKA's technical diagram identifies the tube, end piece, link, movement, pointer and pressure connection as distinct parts.[ref]
Elastic element pressure gauges by WIKA. IN00.01,09/2010, p1, labelled Bourdon-gauge mechanism
The complete gauge is a measuring system. Its measurement indication depends on the sensing tube and the motion transmission, including possible backlash and hysteresis. For a vented case, the tube responds to pressure relative to the surrounding atmosphere, so the intended quantity is gauge pressure. The dial alone does not define an absolute pressure reference.
For an original instrument calibration comparison, connect the gauge and a suitable pressure reference to a common fluid source. Apply several increasing pressure steps, wait for stable readings, and return through the same pressures. Record each discrepancy and distinguish the two loading directions. This tests the assembled readout rather than only the elastic element.
The locations of the pressure ports can matter as much as their shared supply. If the test gauge's port is below the reference port in a stationary water-filled connection, take and . Hydrostatic pressure givesWithout that correction, a correct lower gauge can appear to overread the upper reference. These are original apparatus values, not manufacturer test data.
Read the error specification for the actual model and size. WIKA's June2025 US sheet, for example, states an accuracy of of span for the specified four- and six-inch versions, while listing a different specification for the smaller version.[ref]
Bourdon Tube Pressure Gauges, Stainless Steel Series by WIKA. 23X.50,06/2025, p1, Accuracy class
A percentage of span is not the same percentage of the instantaneous reading. Retain range, conditions, corrections and measurement uncertainty with the reported result.Pressure gauge temperature error is the change in a gauge's indication error associated with a change from its specified temperature conditions, while the pressure comparison is otherwise controlled. It belongs to the complete Bourdon tube pressure gauge response, not merely the number of scale divisions. Distinguish an instrument-temperature effect from a real change in the pressure being measured.
A concrete manufacturer specification is WIKA's June2025 US data sheet, which gives an additional error bound of of span per departure from the reference.[ref] This is a version-specific bound; it is not a measured signed correction for an individual gauge.
For an original gauge with span at , the specified form givesAt a pressure reading of , that bound is of the reading. The percentage is referenced to span, so the same absolute bound represents a larger relative contribution near the bottom of the range. Without the sign and an appropriate measurement calibration, subtracting would not be justified.
For an original controlled comparison, hold reference pressure at and allow the gauge assembly to equilibrate first at and then at . Suppose indications are and . Their errors relative to the reference are and , so the observed temperature-associated change is , or a local average . These are illustrative readings, not manufacturer test results. Repeat at other pressures and on return to the reference temperature to check reversibility and hysteresis.
Record gauge and reference conditions, equilibration and uncertainty in the pressure comparison. Heating a sealed gas can change its actual pressure through the ideal gas law; an uncontrolled change of that kind cannot be assigned entirely to instrument error. The bound or fitted correction remains one contribution to the final measurement uncertainty.
Transducer sensitivity describes how much the output of a measuring transducer changes when its input changes. For an output responding smoothly to input , a local model usesVIM defines sensitivity of a measuring system through the quotient of corresponding indication and input changes, noting that sensitivity can depend on the input value and that the changes used must be appreciable relative to resolution.[ref] The derivative is the smooth local limit of that response ratio.
For an original pressure-to-potential transducer, stipulateIts transducer sensitivity isAt , the output is and the sensitivity is . Across the finite interval from to , output changes by , so the measured response ratio is instead . Specify the operating point or interval rather than treating these two slopes as contradictory.
An output increment corresponds locally to input-referred resolution at the first operating point. This conversion is not a complete uncertainty statement. Increasing electronic gain can enlarge output noise as well as the signal; detector saturation can flatten the response and destroy local invertibility.
Estimate transducer sensitivity with known input steps, repeated outputs and checks for changing zero, loading and temperature. In a linear response , a constant offset cancels from differences; a changing offset does not. Retain both the sensitivity relation and its uncertainty in measurement calibration, and propagate the relevant contributions when reporting a measurement result.
Input-referred resolution expresses an output increment or distinguishable output change in units of the quantity applied to a measuring system. For local response with nonzero transducer sensitivity , an output increment corresponds approximately toState what output criterion is being referred: one converter-code step, a noise-based threshold and a repeatably distinguishable input change are different specifications. Walt Kester's converter tutorial distinguishes code transitions, input-referred noise and noise-based resolution measures.[ref]
MT-004 by Walt Kester. pp1–4, code-transition noise, grounded-input histograms and noise-free/effective resolution
For an original pressure readout, suppose a transducer has , followed by an ideal 12-bit analog-to-digital converter spanning . Its code step is , corresponding to . This arithmetic specifies a nominal increment, rather than demonstrating that two pressures separated by that amount can be reliably distinguished.
Place an ideal amplifier of gain ten before the converter. The combined sensitivity becomes , so the converter step corresponds to . With zero offset in this model, the pressure span mapping onto the converter simultaneously shrinks from to . Gain trades converter coverage against nominal input increments; it does not create an unlimited input range.
Suppose the transducer itself contributes rms output noise. That is input-referred noise. The added ideal gain scales both that signal and that noise, leaving this pressure-noise contribution unchanged. More display digits therefore need not improve the useful measurement resolution.
For a nonlinear response, repeat the conversion at the relevant operating point and account for the actual observation bandwidth and processing. Near detector saturation, sensitivity can approach zero and the local conversion becomes uninformative. A complete measurement result also includes measurement uncertainty, which contains calibration and other contributions beyond the chosen resolution criterion.
A measuring chain is one successive signal path through a measuring system, beginning at a sensor and ending at an output element. The VIM illustrates this with both an electro-acoustic chain and a mechanical chain; a measuring chain need not be electronic.[ref]
Consider an original force measurement: a load cell produces an electric potential difference, an amplifier scales that signal, an analog-to-digital converter encodes it, and software converts the code to a force value. This is one measuring chain within the larger measuring system, which also includes its excitation supply, references and mounting arrangements. The load cell acts as a measuring transducer.
In an ideal linear model, let sensor response be , amplifier gain , and converter step per code increment. If the additive output offset is increments, the numerical output isThus implies . These are stipulated teaching values, not measured equipment performance.
The example exposes why measurement calibration must describe the relevant path. Changing amplifier gain changes the relation between output and force even if the load cell is untouched. A saturated stage can also discard information that later conversion cannot restore. Gain uncertainty, offsets, instrumental drift and finite conversion steps contribute at different points; treating the final display's increment as the whole measurement uncertainty overlooks those contributions.
Articles by others on the same topic
There are currently no matching articles.