The expectation-maximization algorithm fits a latent-variable model by alternating a conditional expectation over the latent variables with a maximization over the statistical parameters. Its target is the observed-data likelihood function, although its updates use the simpler complete-data log-likelihood.[ref]
Maximum Likelihood from Incomplete Data via the EM Algorithm by Arthur Pentland Dempster and others. Section 2, printed p. 6, equation (2.17) and the general E-step/M-step definition
Write for the observations, for the latent variables, and for their joint probability density function or probability mass function. The observed-data log-likelihood iswhere the integral becomes a sum for discrete . Directly maximizing a logarithm of this sum can be awkward. The E-step instead computes a conditional distribution at the current statistical parameters ; the M-step uses it to construct a new fit. The attractive idea is to retain uncertainty about the hidden labels while recovering simple weighted means and other complete-data updates. The Known-variance Gaussian mixture EM example shows the mechanism without estimating a variance or mixture weight.
Arthur Pentland Dempster, Nan M. Laird, and Donald B. Rubin gave the general framework its name in their 1977 paper, which also discusses earlier special-case algorithms.[ref]
Maximum Likelihood from Incomplete Data via the EM Algorithm by Arthur Pentland Dempster and others. Section 1, printed pp. 1 and 3: naming of the two steps and earlier special cases
Hold the old statistical parameters fixed when taking the conditional expectation, while keeping the candidate statistical parameters variable:For independent observations in a finite mixture model, is a hidden component label. Bayes' theorem gives its mixture responsibilities:These posterior probabilities are the conditional expectations of the mixture allocation indicators; they turn hidden counts into fractional counts.[ref]
Maximum Likelihood from Incomplete Data via the EM Algorithm by Arthur Pentland Dempster and others. Section 4.3, printed pp. 15-16, especially the paragraph following equation (4.3.3): conditional indicator probabilities and weighted counts
They condition on a current fixed fit, rather than averaging over a posterior distribution of the statistical parameters. Taking the conditional expectation of the complete-data log-likelihood is essential: substituting a single guessed label, or merely substituting the conditional mean into a nonlinear complete-data expression, generally gives a different algorithm.Maximize over the permitted statistical parameters, with the E-step conditional distribution held fixed.[ref]
Maximum Likelihood from Incomplete Data via the EM Algorithm by Arthur Pentland Dempster and others. Section 2, printed p. 6: general maximization step
A finite mixture model hasFor normal distributions with known common variance and fixed positive mixture weights, only the means are fitted. Dropping terms independent of these candidate means givesThe derivative in is , and its second derivative is . Thus a positive weighted count gives a unique maximizing weighted mean. This is a maximization of the surrogate ; the observed-data log-likelihood need not be concave. Recompute the mixture responsibilities after updating the means. The broader EM for Gaussian mixtures with a common variance also estimates mixture weights and the shared variance.Choose six illustrative values , fixed mixture weights , known standard deviation , and initial means . These are constructed data for a Gaussian mixture distribution, not measurements. With the standard normal distribution probability density function, the fitted log-likelihood isAt the initial means, the component density ratio is . The first E-step therefore gives
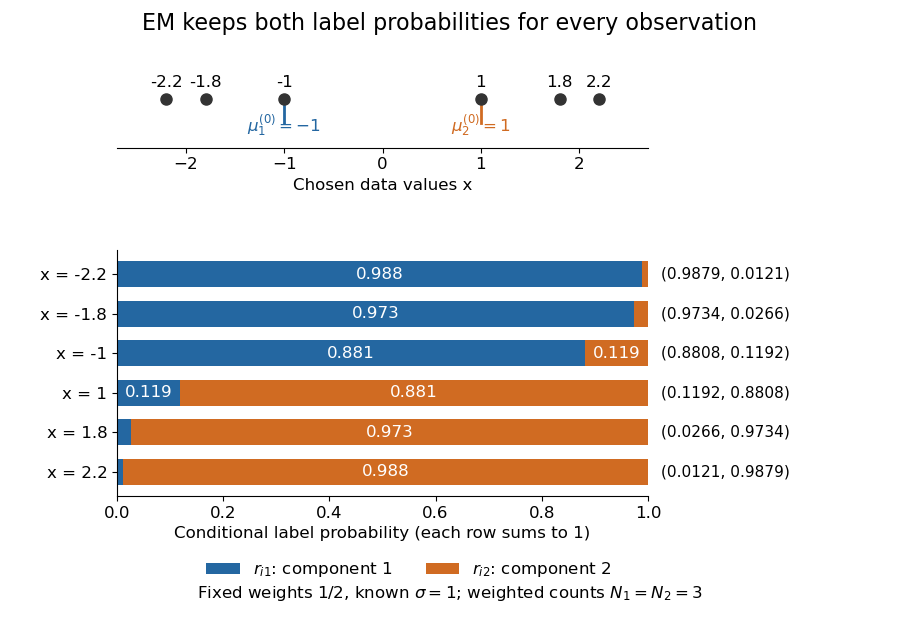
The paired values and have complementary mixture responsibilities, so exactly. The first M-step givesThe hyperbolic tangent expression follows by pairing the contributions at and . Assigning every negative value wholly to the first mixture component and every positive value wholly to the second would instead give means . Those hard assignments discard the overlap: the expectation-maximization algorithm is not the same update as K-means clustering.
The observed-data log-likelihood rises from initially to after one update and after two. Further updates approach means , with log-likelihood approximately . These values describe this initialization; EM likelihood monotonicity supplies no certificate of a global maximum.
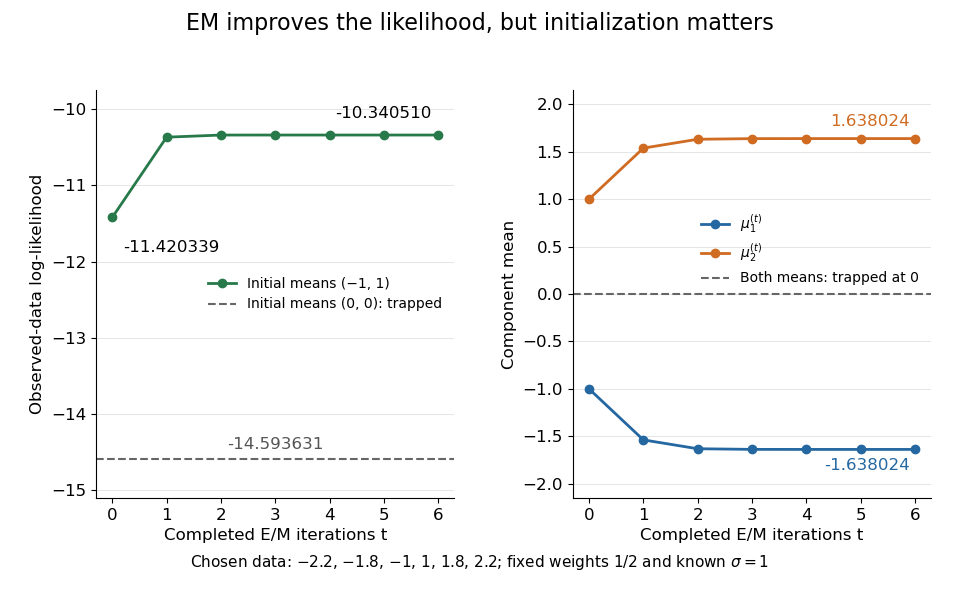
Likelihood ascent and mean updates for the chosen data, compared with an identical-means initialization
. Iteration zero is the initial fit; each subsequent point follows one E-step and one M-step. Starting at minus one and one increases the likelihood. Starting both means at zero leaves them at zero with a lower constant likelihood. All runs keep variance one and weights one half. Details.For stable numerical evaluation, put and . The log-sum-exp function givesSubtracting keeps at least one exponential equal to one, avoiding the all-zero sum that direct evaluation of tiny component densities can produce.
In the Known-variance Gaussian mixture EM example, initialize both means at the same value . The mixture responsibilities are then for every observation. Each M-step sets both means to the sample mean, zero here; the next E-step again gives . Thus is a fixed point with log-likelihood , despite the better fit found from .
One can check the failure without trusting an iteration plot. Separate the means as and use the hyperbolic cosine identity:The Taylor expansion uses . Small nonzero separation therefore improves the log-likelihood, whereas translating both means to changes it by . This stationary point has both improving and worsening directions. Identical initialization cannot discover the separation because every observation keeps identical label probabilities. Trying several distinct initial fits and comparing their final log-likelihoods is useful, but does not prove global optimality.
Keeping the variance fixed also removes a different pathology. With known , every component probability density function is at most , so . If separate component variances are allowed to shrink without restriction, one mixture component can concentrate at an observation while another retains positive density at the other observations, making the likelihood function unbounded. The fixed positive variance in this example prevents that collapse; it does not remove initialization traps.
For observations from each of two labeled exponential distributions, an E-step may produce positive completed time totals . Its expected complete-data log-likelihood is . This is strictly concave. On the closed ordering constraint , its maximum is when ; otherwise it lies at . To see the boundary case, first maximize along the equality line. At that maximum, moving into either feasible rate-separating direction has directional derivative , so concavity proves global optimality. For the open constraint , this boundary value is a supremum rather than an attained M-step.
// Target: probability-and-statistics.bigb
For a multinomial distribution with two unobserved cells merged into one observed count, the conditional allocation is a binomial distribution with probabilities proportional to the two cell probabilities. The expectation-maximization algorithm replaces the missing counts by their conditional expectations in the parameter-dependent part of the complete-data log-likelihood. The expectation of a log-factorial normalization generally differs from its value at the expected count, but this difference is independent of the candidate parameter and does not affect the maximization step.
For independent normal coordinates, an unobserved first coordinate has conditional law equal to its current marginal normal distribution, even when the second coordinate of that observation is known. Thus its E-step first moment is and second moment is . With three observed first coordinates and one missing value, the mean update is and the variance update is . The conditional variance term is essential: filling in only the conditional mean is not the expectation-maximization algorithm.
For a common unconstrained Markov kernel on the edges of a rooted tree, let be the conditional expectation of the number of transitions , given observed leaves and the old Markov kernel. The expectation-maximization algorithm maximizes over row probability distributions, giving . A row with zero total count is unrestricted by this objective. Belief propagation computes the counts exactly on a tree.
In the expectation-maximization algorithm for a stationary autoregressive process of order one, a single missing interior value has a normal distribution conditional on its neighbors. The E-step uses both its conditional mean and its conditional second moment, not just mean imputation. The M-step maximizes the expected stationary complete-data log-likelihood, including the initial-observation density and the conditional-variance contribution to the two adjacent innovation squares.
For , the Jensen inequality givesThus any expectation-maximization algorithm M-step that increases cannot decrease the observed-data likelihood function.[ref]
For a short proof, assume common support and finite expressions, and keep the E-step conditional distribution fixed. The concavity of the logarithm and Jensen's inequality giveThis evidence lower bound equals . At , the ratio inside the expectation is the constant , so equality holds. During the M-step, the second term is constant; increasing raises a lower bound that touches the current log-likelihood. HenceIncreasing likelihood values alone do not establish convergence of the statistical parameters or attainment of a global maximum. In a differentiable finite mixture model, the gradient of equals the candidate-parameter gradient of evaluated at the current fit. Thus an interior fixed point of an exact M-step is a stationary point, which need not be a local maximum; the Identical-mean EM trap is an explicit counterexample. Small changes in log-likelihood can also occur before the means have settled, so inspecting both is useful.
Articles by others on the same topic



The Expectation-Maximization (EM) algorithm is a statistical technique used for finding maximum likelihood estimates of parameters in probabilistic models, especially when the data are incomplete or have missing values. It is commonly applied in scenarios where the model depends on latent (hidden) variables, and it's particularly useful in clustering, density estimation, and other machine learning applications.