Separation of charged molecules through a gel in an electric field. Denaturing conditions suppress folded structures, helping compare RNA lengths; matching migration alone does not establish an identical nucleotide sequence or identical covalent bonds. In the ribozyme experiments, labelled RNA was detected after separation by exposing photographic film.
In DNA agarose gel electrophoresis, the backbone phosphate groups carry negative electric charge under the usual mildly alkaline buffer solution conditions. DNA therefore moves toward the positive anode, away from the negative cathode.[ref]
Agarose Gel Electrophoresis by Addgene. Introduction; Loading Samples and Running an Agarose Gel, step 6: DNA migration toward the positive electrode
The electric field points the other way: the electric force reverses direction when . The apparatus is driven by an external source of electric potential difference; the positive anode convention here belongs to that operating mode. Direction follows electric charge, so it is not a rule that all molecules move toward the same electrode.
The useful result is a spatial comparison: a mixture becomes separated gel bands, which can be compared with a DNA ladder or recovered for subsequent analysis. Agarose gel electrophoresis of linear double-stranded DNA, gel electrophoresis of denatured RNA, and SDS-PAGE of proteins use different conditions to make migration informative about chain size. An electric field supplies motion; the gel supplies a porous obstacle course.
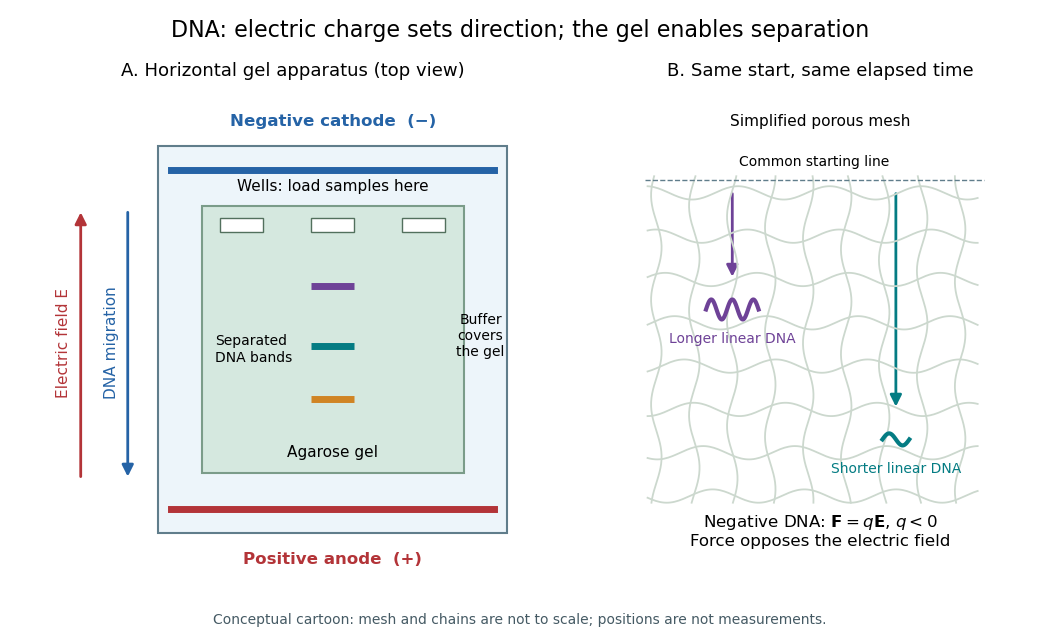
DNA migrates toward the positive anode, opposite to the electric field; the agarose mesh separates linear DNA fragments. Conceptual apparatus and mesh, not measured trajectories or a drawing to scale
. Details. Electrophoretic separation in a polyacrylamide matrix. Native conditions can preserve molecular complexes, whereas denaturing conditions address different separation goals.
A binding assay that detects a change in electrophoretic mobility when a ligand associates with a labelled target, such as an RNA–protein complex. A concentration series and competition controls help distinguish specific binding from aggregation or non-specific retention.
A gel band is a localized population of stained or otherwise detected molecules with sufficiently similar migration in one sample lane. One visible gel band need not contain only one nucleotide sequence. Two different linear DNA fragments of 375 base pairs can occupy the same unresolved gel band; equal migration supplies size evidence under suitable conditions, not a sequence determination.
Fluorescence from a bound stain can support an estimate of DNA quantity, but suitable staining and detector response matter.[ref]
Five Main Nucleic Acid Gel Electrophoresis Steps by Thermo Fisher Scientific. Step 4, Sample visualization, Fluorescent dyes: relation between fluorescence and bound nucleic acid
For a quantitative model with equal staining response per unit mass, background-subtracted, integrated fluorescence satisfies . This requires an unsaturated detector and a common proportionality constant ; visual peak brightness alone does not supply .
The amount of substance is , where is molar mass. For double-stranded DNA with approximately equal average mass per base pair, is proportional to length , so is proportional to . In a constructed example, equal integrated signals from 250-base pair and 1000-base pair gel bands imply approximately equal masses but four times as many short DNA molecules. Conversely, equal numbers of those DNA molecules would give about four times the signal for the longer fragments in this model. Neither conclusion follows from darkness in a schematic drawing.
Agarose gel electrophoresis uses a porous agarose polymer network. For linear double-stranded DNA within a suitable separation range, shorter fragments generally move farther in a fixed run. Raising the agarose concentration changes the mesh and the range of sizes that can be resolved.[ref]
Five Main Nucleic Acid Gel Electrophoresis Steps by Thermo Fisher Scientific. Step 1, Selection and gel preparation; Recommended percentage of agarose gels for separation of DNA fragments
A compact circular DNA molecule need not migrate like linear DNA of the same length: geometry affects passage through the mesh.[ref]Five Considerations for the Nucleic Acid Gel Electrophoresis Process by Thermo Fisher Scientific. Effects of conformation, Figure 1: nicked circular, linear and supercoiled forms of the same DNA
A concrete laboratory example is Addgene's documented DNA separation protocol. Its standard 1% gel contains 1 g of agarose in 100 mL of TAE buffer. Dissolved agarose sets in a casting tray around a comb; removing the comb leaves sample wells. The gel is covered with the same buffer solution in a box connected to a voltage source. Loading buffer contains glycerol to increase sample density and a tracking dye to show run progress. A DNA ladder occupies a separate lane beside the samples. With wells near the negative cathode, DNA migrates toward the positive anode. After separation, bound stain makes the DNA visible by fluorescence under a UV transilluminator. The DNA ladder supplies the size reference; the tracking dye monitors migration but does not identify sample DNA.[ref]
In the manufacturer's controlled comparison, the same DNA ladder runs in 1%, 2%, and 3% agarose gels with the same run time and other stated conditions. The changed gel band spacing shows why a calibration belongs to its particular gel conditions, rather than establishing a universal distance law.[ref]
Five Main Nucleic Acid Gel Electrophoresis Steps by Thermo Fisher Scientific. Step 1, Figure 3 and caption: same DNA ladder at three agarose percentages under the same conditions, including run time
In interpreting an unknown sample, a blank lane tests for detectable background or carryover in that blank, while the DNA ladder checks migration and detection of its known fragments. An empty sample lane cannot by itself distinguish absent DNA from unsuccessful loading or insufficient detection. These controls answer different questions; neither makes matching migration a proof of matching nucleotide sequence.
A DNA ladder contains DNA fragments of known lengths in base pairs. Its gel bands supply size references. Match the sample's strandedness and shape, and use the specified lengths for that DNA ladder. A size reference need not provide a quantitative mass standard.[ref]
Five Main Nucleic Acid Gel Electrophoresis Steps by Thermo Fisher Scientific. Step 2, Nucleic acid ladder selection guidelines: fragment structure, conformation, intended use and manufacturer-specific composition
A gel electrophoresis size calibration relates migration distance to known fragment lengths on the same gel. Here is an explicitly chosen model for linear double-stranded DNA, not measured data or a universal law. Let be the numerical length in base pairs and the numerical migration distance in millimetres from the wells:The logarithm has a dimensionless argument: is the length divided by 100 base pairs. The chosen DNA ladder fragments give , respectively. The gel bands therefore appear in the reverse order of length along the direction of migration.
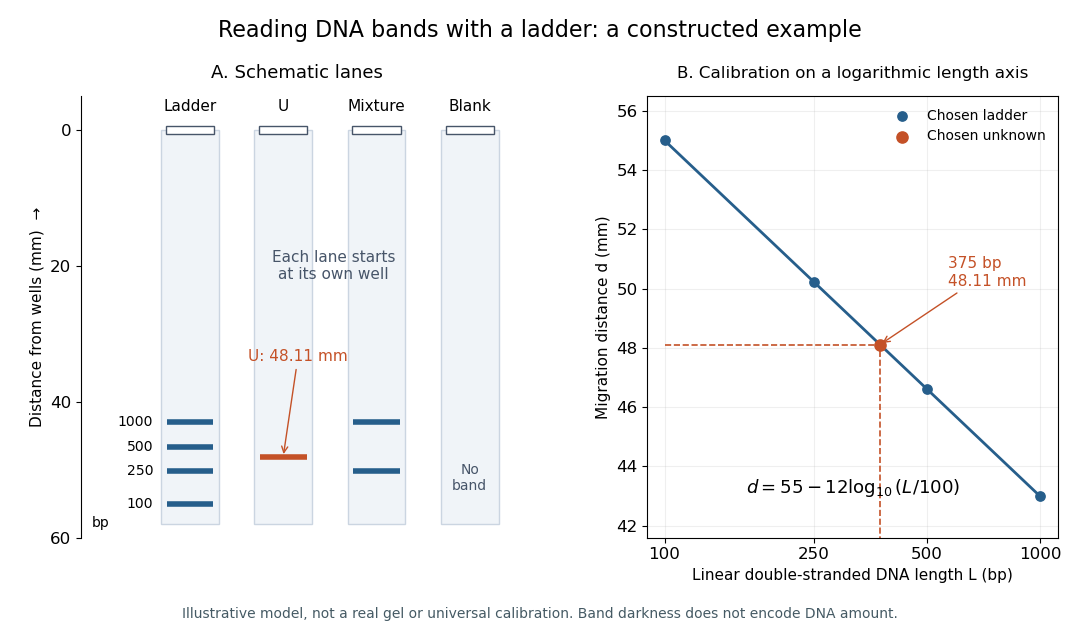
Constructed DNA ladder, unknown, mixture and blank lanes with a logarithm calibration. All positions follow the chosen model; the unknown is 375 base pairs at 48.11 mm, and darkness does not represent DNA quantity
. Details. To invert the calibration, rearrange the logarithm:Our chosen unknown gives , between the 250-base pair and 500-base pair references. Inserting that distance into the inverse recovers 375; retaining only gives about base pairs. The extra digits reflect rounding in this model, not the resolving power of a real gel.
For linear interpolation between those two reference gel bands, use the logarithm of length. Here the fraction of the distance from the 500-base pair reference toward the 250-base pair reference is , giving . Direct linear interpolation of lengths instead gives approximately base pairs. This difference explains why the choice of calibration coordinates matters. A real calibration must be checked over its usable range; folded RNA or circular DNA does not automatically share the linear double-stranded DNA calibration.
A UV transilluminator supplies ultraviolet illumination for viewing stained DNA by fluorescence after gel electrophoresis.
An analytical form of gel electrophoresis using an anionic surfactant and a polymer gel to separate proteins predominantly by chain size under denaturing conditions. Western blot separation often uses SDS-PAGE; the resulting apparent mass and subsequent antibody binding provide complementary, incomplete evidence about identity.
Starch gel electrophoresis uses a starch-based gel to separate material in an electric field. The IgG chain reduction experiment uses it to compare polypeptide chains.
Gel electrophoresis through polyacrylamide under conditions that suppress nucleic acid folding; suitable sequencing conditions resolve adjacent nucleotide lengths.
Articles by others on the same topic

Gel electrophoresis is a laboratory technique used to separate and analyze macromolecules such as DNA, RNA, and proteins based on their size and charge. The basic process involves the following key components and steps: 1. **Gel Matrix**: A gel, commonly made from agarose or polyacrylamide, serves as a medium through which the molecules will travel. The pore size of the gel can be adjusted by varying its concentration, allowing for separation of different sizes of molecules.



Technique widely used to measure the size of DNA strands, most often PCR output of a region of interest.
A simple sample application is gel electrophoresis alelle determination.