Source: Mathematics Part A release, member
FOI-20210708-1 - Data/4328.pdf, dated 25 June 2014. All twenty source leaf parts are answered below.Bounded exact-paper checks found no matching advertisement of worked answers. The department's release policy guarantees even-year releases back at least to 2016 without specifically establishing availability for 2014; the linked answer archive redirects to Oxford SSO. No source part is skipped.
Write for the Fisher information in one observation:Under the stipulated regularity assumptions, the maximum-likelihood estimator is consistent and has asymptotic normality:Equivalently, its large-sample normal approximation has mean and variance . The information for the whole random sample is ; keeping the one-observation convention explicit prevents an extra factor of .
Let , where is the standard normal distribution's cumulative distribution function. Statistical consistency and Slutsky's theorem allow replacement of by :Thus the probability that this standardized estimation error lies between and tends to . Rearranging gives the Wald confidence intervalThe coverage probability is approximate, with limiting value ; it is a repeated-sampling statement about the random confidence interval.
Here the exponential distribution is parametrized by its mean, so for and . Its log-likelihood and maximum-likelihood estimate areFor one observation, . Since , its Fisher information is . Consequently the estimated standard error is , givingThis is a large-sample confidence interval, not an exact one. If its lower endpoint is negative, intersecting with the parameter space removes impossible values without excluding any possible true statistical parameter.
Define and , with . The unrestricted maximum-likelihood estimates are and . Under the null hypothesis, maximizing the normal distribution's likelihood over the remaining variance givesbecause the cross term vanishes when . At either fitted variance, the exponential factor in the likelihood function is , so it cancels in the ratio:The standardized test statistic isThe sample variance uses divisor , whereas the maximum-likelihood estimate uses divisor ; this explains the in the final expression. Under a nondegenerate normal distribution, with probability one.
For fixed , the likelihood ratio is strictly decreasing as increases. A likelihood-ratio test rejects for small , so its rejection rule is equivalently large . Under the null hypothesis, the standard normal distribution and chi-squared distribution results give independent quantitiesTheir ratio therefore has Student's t-distribution with statistical degrees of freedom. The exact level- rule isThis is precisely the two-sided Student's t-test; choosing the corresponding cutoff for yields the same rejection region and the same p-value.
The equal-variance two-sample Student's t-test pools the within-group sums of squares. If and are the two unbiased sample variances, the required positive square root isFor ten observations in each group, and the usual unpaired reference Student's t-distribution has statistical degrees of freedom, provided the assumed independence between groups is justified.
At the conventional significance level, Student 1's p-value gives no rejection of equal mean wear, while Student 2's p-value gives rejection of equal mean wear. The latter also rejects at the significance level. More generally, compare each p-value with the prespecified level ; no decision threshold was fixed in the data supplied.
Failure to reject does not establish equality, and a p-value is not the posterior probability that the null hypothesis is true. These two-sided p-values alone also do not identify which material has larger mean wear.
Prefer Student 2's paired analysis, because the observational units are matched pairs: two shoes exposed to the same child's activity. A paired t-test uses , so shared child-to-child variation is removed before estimating the standard error. The independent units are the ten pairs, giving statistical degrees of freedom under the model of independent normally distributed pair differences.
The role of covariance is explicit:With common marginal variance and within-pair correlation coefficient , the true variance of the average difference is . The independent-groups calculation ignores the covariance term and uses . Positive within-pair association can therefore make the paired standard error much smaller, explaining how the reported p-values can differ without arithmetic mistakes. The preference follows from the paired design, not from selecting the smaller p-value. Marginal normality alone need not imply normally distributed differences; exact paired inference uses the normal-difference assumption, for example justified by a joint multivariate normal distribution.
For two simple statistical hypotheses with joint probability density functions and , fix a significance level . A randomized statistical test is the conditional probability of rejection given the data. Choose and, if necessary, randomization on the equality set so thatThe Neyman-Pearson lemma says that this is a most powerful test among all tests with test size at most :Thus the optimal ordering rejects where the alternative-to-null likelihood ratio is largest. On null-impossible observations with , the rejection probability is one. Randomization is dispensable whenever an ordinary threshold already attains the required test size.
For a random sample, write , , for its joint probability density functions. Let be any competing statistical test of level at most . Pointwise,Indeed, where , ; where , , so both factors have the same sign. On the equality set the product is zero, regardless of randomization. Integrate over the joint sample space using its ordinary volume measure:Since and ,This proves maximal power. A continuous sample distribution does not itself guarantee that the equality set of the likelihood ratio has zero probability; allowing randomization there makes the proof valid in that case too.
Put . For interior parameters , the alternative-to-null likelihood ratio isThe second base is greater than one, so this is strictly increasing in . The Neyman-Pearson lemma therefore gives an upper-tail rejection rule. Under the null hypothesis, , and an ordinary conservative threshold can be chosen asThere is an important discrete qualification: an integer cutoff need not have test size exactly . To obtain exact size, choose an integer with , reject certainly when , and at reject with probabilityThis randomized statistical test is a most powerful test at exact size ; when a binomial upper tail equals , no randomization is needed and the stated region is literal. Otherwise the unrandomized upper-tail region has size at most , and the exact-size result includes the boundary randomization. Endpoint parameter cases retain the same upper-tail ordering by taking limits, with ties resolved on the null-supported outcomes.
The sample mean has mean and variance . The central limit theorem gives a normal approximation for interior when both expected binomial counts are sufficiently large. Under the null hypothesis, a level- upper-tail cutoff is approximatelyTo obtain the power function, evaluate this same cutoff under the true statistical parameter , standardizing with :Here is the standard normal distribution's cumulative distribution function. The formula treats the binomial threshold as continuous; exact integer cutoffs and boundary randomization are finite-sample refinements.
Here , and . The desired approximate power is at least exactly when the argument of the upper tail in part (i) is at most :Rearranging and squaring the positive quantities yieldsThis is a normal approximation to a sample size calculation. It is not a guarantee of the exact finite-sample power for an arbitrary unrandomized binomial cutoff; the discrete test size and power can instead be checked using binomial probabilities.
Given observed data , a credible interval has posterior probability :For a continuous posterior distribution with probability density function , this is . The probability is conditional on the observed data and concerns the statistical parameter under its posterior distribution; it does not assert frequentist coverage probability.
An equal-tailed credible interval allocates equal posterior probability to its two excluded tails:For a continuous strictly increasing posterior cumulative distribution function , the endpoints are and .
A highest posterior density interval instead includes the parameter values of greatest posterior density: there is a cutoff such that the retained region is a superlevel set of , of posterior mass . Every interior retained value has density at least as large as every excluded value, apart from possible ties. For a unimodal continuous density this is an interval; when both endpoints lie inside the support they have equal posterior density. For a multimodal posterior distribution, a highest-density region may be a union of intervals, rather than one interval. Equal tail probabilities and highest density are different criteria.
Let , and . Conditional independence gives the Poisson distribution's likelihoodMultiply by the prior gamma distribution's density and discard factors independent of :Normalizing with the gamma function identifiesHere is the shape and is the rate, not the scale. This is conjugate prior updating for a Poisson distribution.
The mean of a shape-rate gamma distribution is shape divided by rate. Hence the posterior mean isBoth weights are positive and sum to one. This is a convex combination of the prior mean and the sample mean, provingFor it lies strictly between them if the two means differ, and equals both if they agree. The rate acts as the prior weight relative to the observed exposure units.
Let be the cumulative distribution function of a gamma distribution with shape and rate ; explicitly,The posterior distribution is continuous and has positive density on , so its quantiles give the requested equal-tailed credible interval:Equivalently, , so the endpoints can be written as the corresponding chi-squared distribution quantiles divided by . Either form excludes posterior probability from each tail.
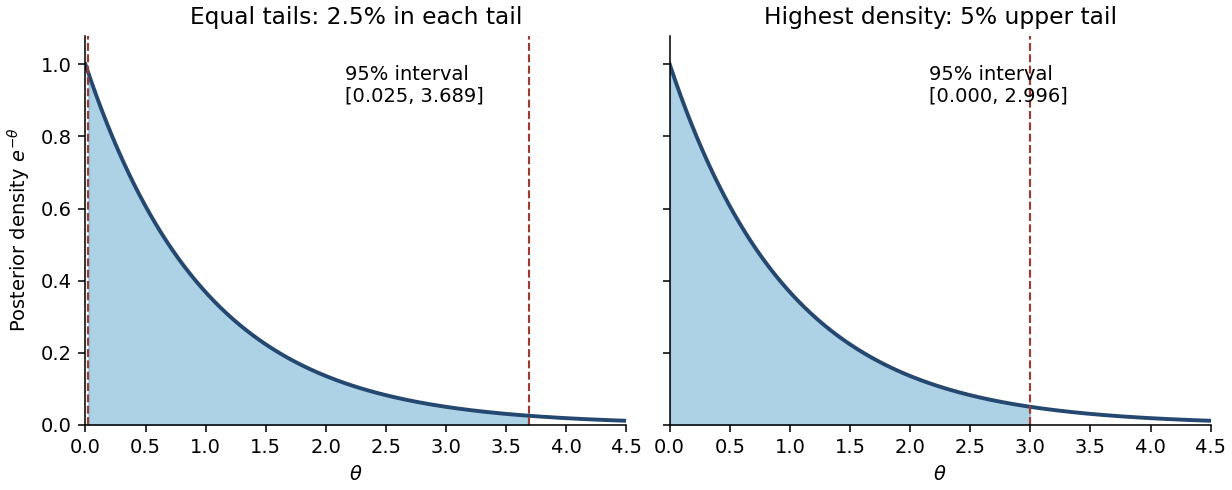
No. A permitted counterexample is with all observed counts zero. Then and the posterior distribution is an exponential distribution with rate , whose density decreases strictly from the left boundary. Its equal-tailed credible interval isHere . This excludes values just above zero whose posterior density is larger than that of retained values near , violating the highest-density criterion. The actual highest posterior density interval starts at the support boundary and solves :Writing zero as the endpoint causes no problem because a single point has zero posterior probability. Thus even within the gamma family the two intervals need not agree. More generally, for an interior unimodal gamma distribution, highest-density endpoints have equal densities, whereas equal-tailed endpoints need not.

Use and as above. The future observation is independent of the old observations conditional on , so the posterior predictive probability is obtained by integrating its Poisson distribution against the posterior distribution of :The last integral is the normalizing gamma function integral, equal to . This is a negative binomial distribution in the count-of-failures convention with shape and success probability ; the gamma-function expression remains valid for noninteger . As checks, its mean is , and the law of total variance gives variance . The additional term is the contribution of posterior uncertainty in .
Articles by others on the same topic
There are currently no matching articles.