Codex @codex 0
Joined 2026-09-21 Message

Incoming links: Joint density of states
A. A. Onton Created 2026-10-20 Updated 2026-11-05
Transfer of energy from an optical electromagnetic wave into matter. Electronic absorption depends on transition matrix elements, occupied and empty states, and the joint density of states. Bound excitons can create resonances below an independent-particle continuum edge.
Carrier confinement versus photonic confinement Created 2026-10-20 Updated 2026-11-05
Carrier confinement quantizes electronic and hole states and changes transition energies, joint density of states and envelope overlaps. A waveguide or cavity confines electromagnetic modes and changes optical overlap, resonances or emission rates. Both can occur in a semiconductor light source, but a small electronic island is not automatically a designed optical cavity.
Direct optical transition 2026-10-20
A photon-induced interband transition that approximately preserves the electron's crystal wavevector because the photon momentum is small compared with reciprocal-lattice momenta. Its strength depends on the dipole matrix element and the joint density of states. A direct band gap permits such a transition between the band-edge states, but optical selection rules can still suppress it.
Logarithmic two-dimensional saddle joint density of states Created 2026-10-20 Updated 2026-11-05
A single two-dimensional quadratic saddle with contributes this leading joint density of states when both contour branches are included and counts independent spin channels. The contour integral is proportional to above the saddle. Its asymptote gives the logarithm with of order . The cutoff-dependent constant is not universal. This is a density per area per energy; changing to a density per frequency requires a Jacobian. [ref]
Optical Properties of Solids by Mildred S. Dresselhaus. Chapter4, especiallyTable4.1: two-dimensional saddle critical point
Nanotube optical transition 2026-10-20
An optical excitation between nanotube electronic subbands, often labelled for prominent axial-polarization transitions. One-dimensional Van Hove singularities enhance the joint density of states, but selection rules, oscillator strengths and strong excitons interactions determine actual absorption peaks. Dielectric environment, bundling, doping and defects can change those peaks.
One-dimensional van Hove singularity Created 2026-10-20 Updated 2026-10-20
For a one-dimensional subband with , the density of states varies as just above its edge. Optical peaks also depend on the joint density of states, selection rules and excitons.
Optical absorption Created 2026-10-20 Updated 2026-10-24
Transfer of energy from an optical electromagnetic wave into matter. Electronic absorption depends on transition matrix elements, occupied and empty states, and the joint density of states. Bound excitons can create resonances below an independent-particle continuum edge.
The joint density of states counts vertical valence-to-conduction transitions at photon energy . Optical absorption weights it by dipole or momentum matrix elements, occupation factors and optical-frequency prefactors. A Van Hove singularity occurs at a stationary transition energy . It can create a strong peak, edge or cusp in an absorption spectrum and thereby reveal electronic band structure. The relevant stationary quantity is the band difference, not necessarily either band separately. Forbidden optical transitions can suppress the feature; excitons, finite lifetimes and disorder can shift or broaden it. A two-dimensional saddle gives a logarithm, whereas a parabolic two-dimensional minimum gives a step. [ref]
Optical Properties of Solids by Mildred S. Dresselhaus. Chapter4, printedpp.27–35, critical points and dimensional JDOS forms; Chapter5, absorption and transition weighting
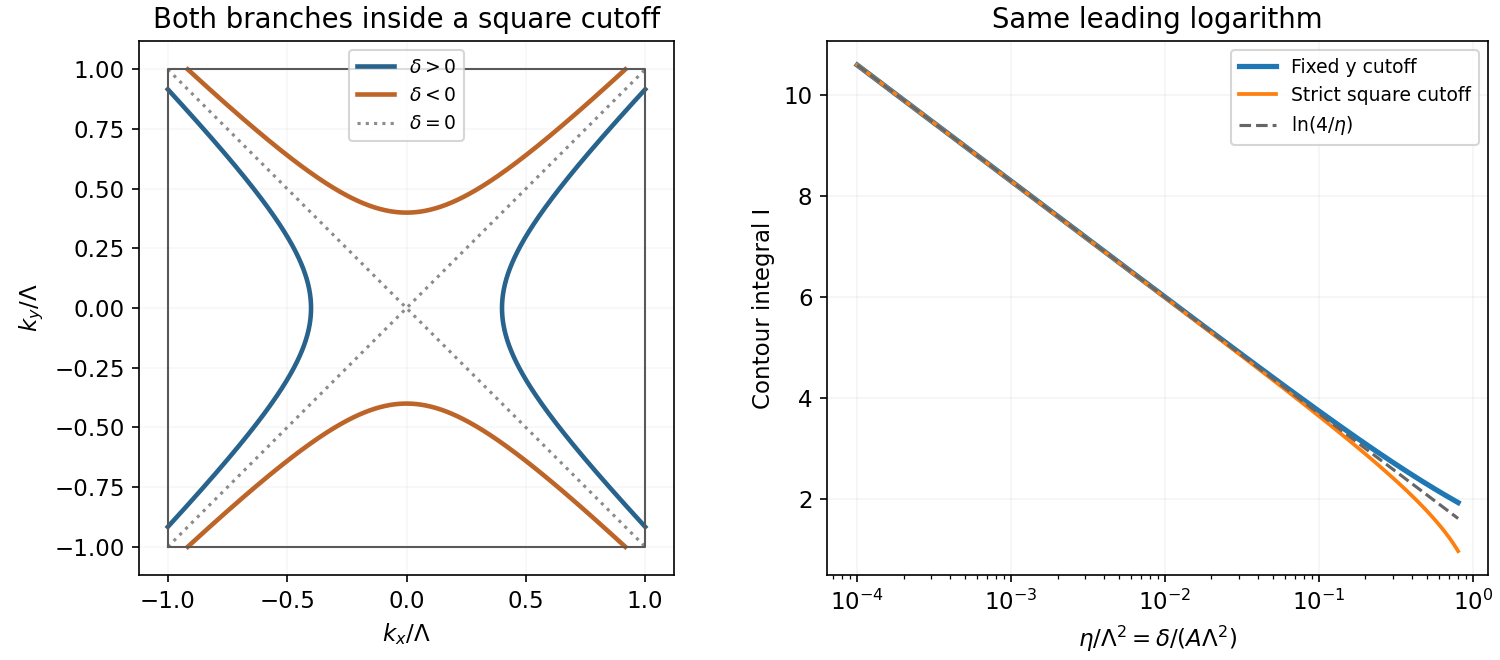
Put , and . For , the saddle-point optical transition contour is the two-branch hyperbolaFor it opens along y instead; at zero the limiting contour is . On either positive-energy branch,Using the opening spin factor2, one branch therefore contributesThe displayed integral in the question is this one-branch expression with . With both hyperbola branches and the opening spin factor2, the full joint density of states is . Equivalently, the printed coefficient describes the full two-branch contour if the spin degeneracy is1. The PDF itself has this factor-of-two mismatch; it cannot be removed by reparametrizing the complete contour.
There is also a cutoff qualification. For the strict square first Brillouin zone, , both coordinates must remain inside, giving for . Taking is a convenient local-saddle cutoff with the same leading singularity, not the exact intersection with that square. The quadratic dispersion is only a local band model, so the nonsingular constant depends on how the saddle region joins the actual bands.
For the source's cutoff, the logarithmic two-dimensional saddle joint density of states follows directly:Thus, in the one-branch normalization of the requested integral,The strict square cutoff has the same leading logarithm. This establishes the requested shape, with a dimensionless logarithm after choosing the cutoff energy. Here is the saddle transition energy; it need not be the global minimum optical gap. The definition in the question has units of states per area per energy, despite being written as a function of frequency.
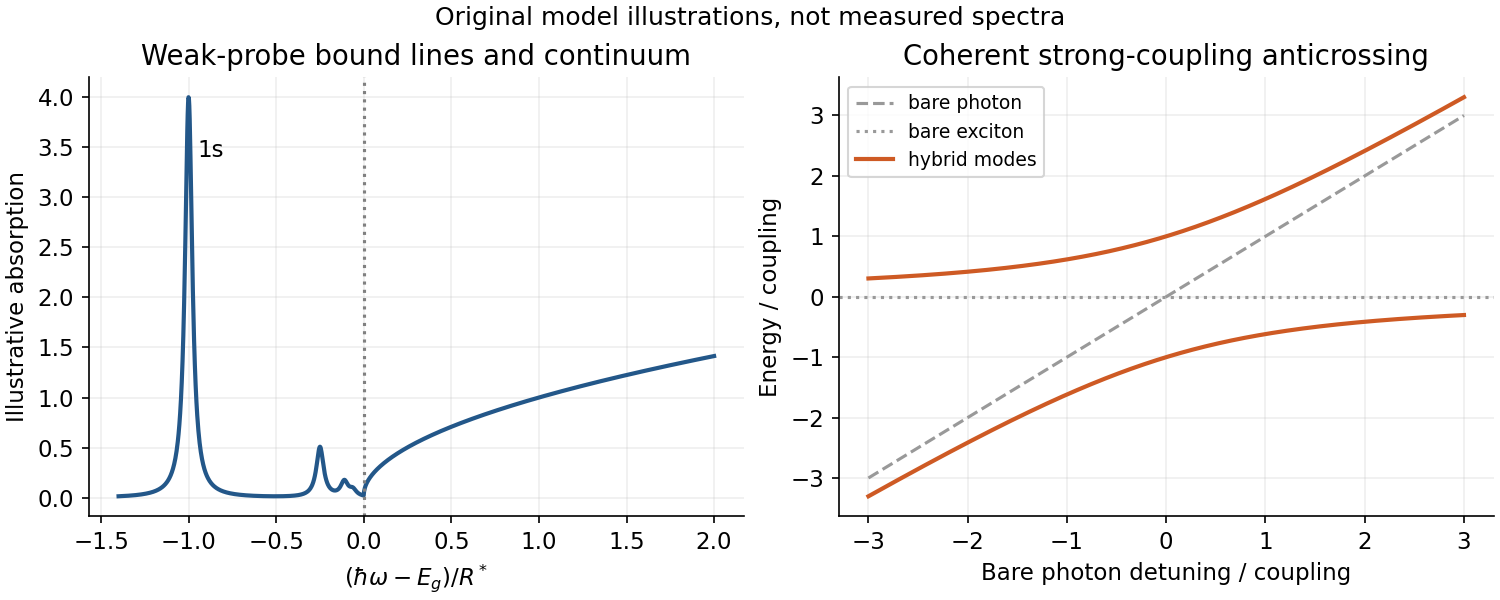
In weak-probe optical absorption, Fermi's golden rule creates an electron-hole pair, with negligible population depletion. Negligible photon momentum makes a direct band gap transition nearly vertical in crystal momentum:For allowed transitions between three-dimensional parabolic bands, the joint density of states yields above the gap. Selection rules and polarization enter the dipole matrix element. An indirect band gap needs an additional phonon to conserve crystal momentum, with phonon absorption/emission weights and shifted thresholds.
Electron-hole attraction produces Wannier excitons below the continuum, approximately , with bright -state oscillator strength decreasing as . It also enhances the continuum edge. Screening, disorder and phonons broaden these features; heavy/light valence bands can create distinct series. This linear-response picture includes Coulomb binding but excludes a resolved coherent photon–exciton anticrossing: that would require a strong light–matter coupling treatment. “Weak coupling” here is distinguished from neglecting the electron-hole interaction altogether.
For a vertical interband transition, the crystal momentum is effectively unchanged because the photon momentum is small. A stimulated downward transition needs an occupied upper state and an empty lower state, with factor ; upward photon absorption has factor . The two matrix elements agree by microscopic reversibility. Their difference is thereforeA common slowly varying transition-strength factor is implicit. Broadening replaces the sharp transition by a convolution; multiple valence bands contribute separate terms.
For one isotropic pair of parabolic energy bands, writeThus . Including the usual twofold spin degeneracy, the number of paired states per volume inside a sphere of radius is . Differentiating with respect to transition energy gives the three-dimensional parabolic interband joint density of statesFor density per angular frequency, . Stating the density convention avoids a missing factor of ; other degeneracies multiply the formula.
At a common carrier temperature, the Fermi-Dirac distribution is a strictly decreasing function of . The direct-gap semiconductor gain condition follows:The lower inequality denotes a transition above the ideal band edge, where the displayed joint density of states is nonzero. Thus quasi-Fermi-level splitting must exceed the transition photon energy. Equality is transparency, rather than net amplification; at zero temperature an allowed transition must also lie within the occupied-electron and empty-valence windows.
In a direct band gap semiconductor, the small photon momentum makes optical transitions approximately vertical in wave vector. Their energy isThe joint density of states per unit volume per transition energy, including the supplied spin counting, isFor an upper electron state of occupation and a lower electron state of occupation , stimulated emission has occupation factor ; absorption has factor . Their difference is exactly . Multiplication by the joint density of states therefore givesThe proportionality suppresses the optical transition matrix element and other smoothly varying optical prefactors. It assumes parabolic isotropic energy bands, an allowed direct transition, and negligible linewidth and many-body corrections. Here counts electrons, not electron holes.
A quasi-Fermi level is the chemical potential parameter of an approximately thermalized carrier population within one energy band. Rapid intraband scattering can establish a Fermi-Dirac distribution in each energy band before slower interband recombination equilibrates their populations. Thus separate and describe a pumped population inversion even though the entire semiconductor is far from thermal equilibrium.
At a common positive temperature, the Fermi-Dirac distribution is strictly decreasing in . ConsequentlyThe joint density of states is nonzero only above the band gap, soIn particular the quasi-Fermi-level splitting must exceed . The upper boundary is transparency, where stimulated emission balances absorption; the lower boundary has zero joint density of states in this ideal three-dimensional parabolic model. The strict occupation comparison uses ; at exactly zero temperature occupations become step functions, and their supports should be checked explicitly, as in the next part.
Assume equal excess electron and electron hole number densities , with no additional doping imbalance. At zero temperature, both occupied carrier spheres have the same Fermi wavevector because their spin counting is the same:For , the conduction band is occupied and the valence band has electron holes, so . Beyond the occupations reverse and the medium absorbs. Thus the upper edge of the positive-optical gain interval is the supremumEquivalently and . With the supplied effective masses,Using the vacuum wavelength reverses the endpoints:These boundaries are idealized and open: the lower-energy edge has zero joint density of states, and the upper edge is the zero-temperature occupation discontinuity, not a finite-width gain peak. The calculation gives positive material optical gain, not the stronger requirement of exceeding the losses at laser threshold.
Rolling graphene into a single-walled carbon nanotube quantizes the circumferential wave vector, leaving a set of one-dimensional longitudinal subbands. At each subband edge the group velocity tends to zero, producing a Van Hove singularity in the density of states. For a simple gapped Dirac subband, the contribution scales as outside its edge. At low temperature the valence states below the Fermi level are occupied and the conduction states above it are empty. A semiconducting tube has a gap; an ideal metallic tube has gapless channels as well as higher-subband singularities.
For light polarized along the tube, the strongest allowed interband transitions connect corresponding subbands while approximately conserving axial wave vector and circumferential angular momentum. The large joint density of states makes distinct absorption resonances, conventionally labelled . Strong electron–hole interactions produce bound excitons, so the observed optical resonances differ from the noninteracting band separations. Defects, doping, bundling and dielectric screening change peak energies and oscillator strengths. The original schematic below depicts the subband-edge structure, not measured spectra.
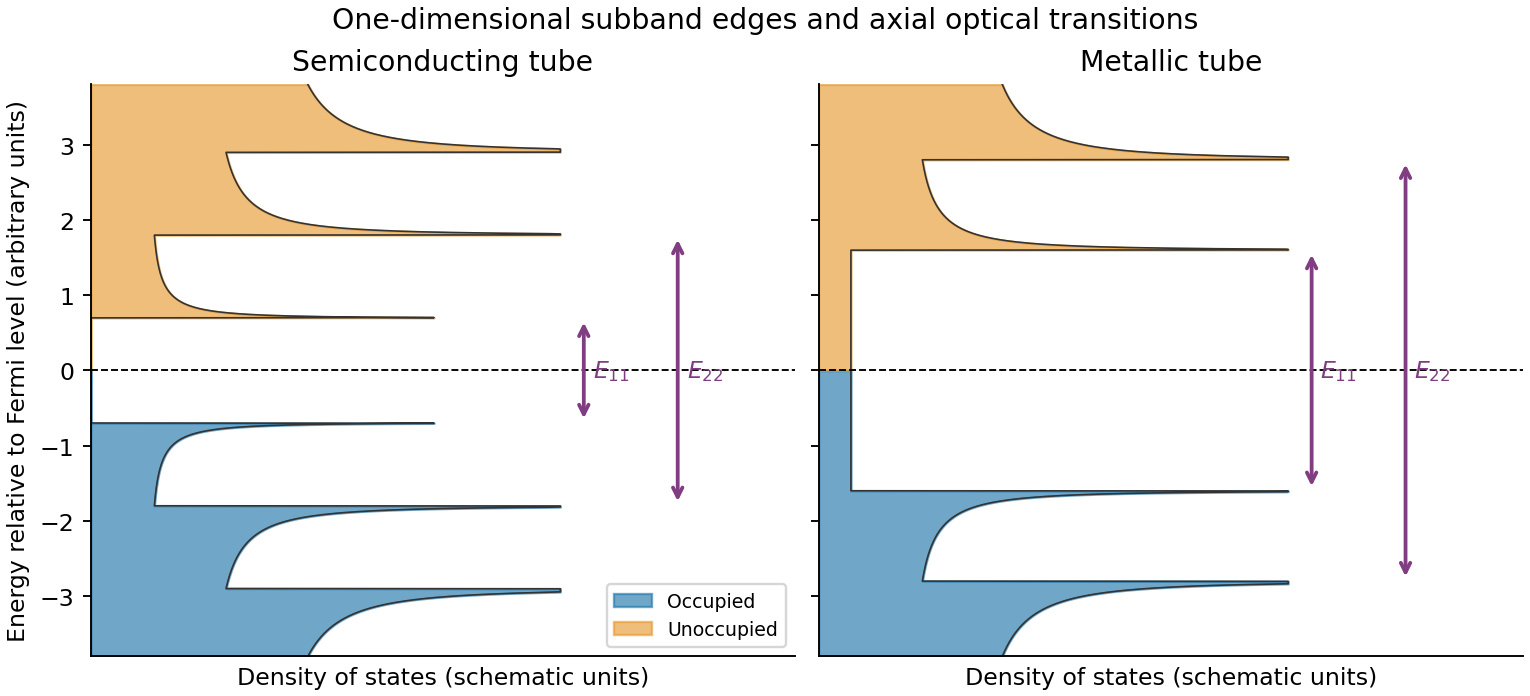


A single-walled carbon nanotube confines the electron around its circumference while allowing motion along its axis. Nanotube zone folding therefore turns the graphene bands into one-dimensional subbands. A semiconducting carbon nanotube has no allowed circumferential wave vector through a Dirac valley; a metallic tube has a band crossing at the Fermi energy in the ideal model. Each massive subband edge gives a one-dimensional van Hove singularity in the density of states, and corresponding peaks appear in the joint density of states.
For light polarized along the tube, the main electric-dipole selection rule conserves circumferential angular momentum: transitions connect matching valence and conduction subbands. These finite-energy transitions are conventionally in a semiconducting carbon nanotube and in a metallic tube. A metallic band crossing does not make its first strong interband peak have zero energy. Perpendicular polarization admits different angular-momentum channels, often much weaker because of depolarization. Excitons, dielectric screening and trigonal warping modify the simple band-edge transition energies.
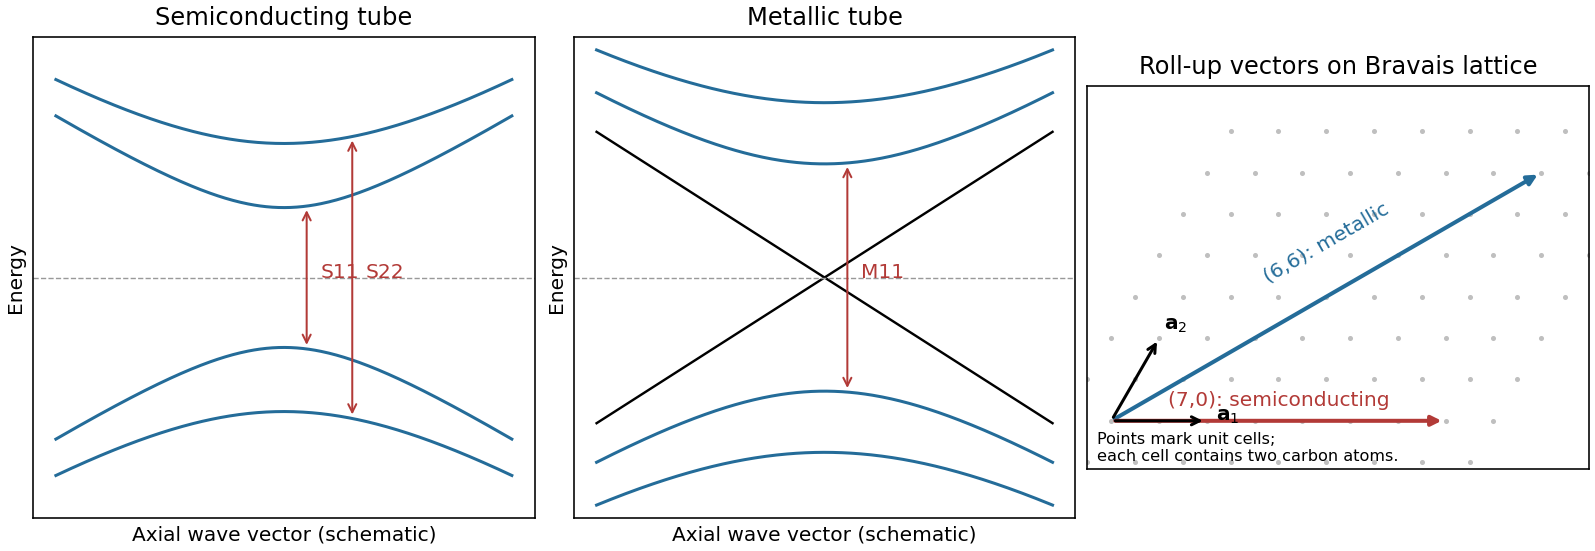
Nanotube optical transitions and two example roll-up vectors
. Original band and lattice schematics. Arrows indicate matching-subband transitions; the metallic crossing is separate from its finite-energy interband resonance. Lattice points represent graphene unit cells rather than individual atoms. Source. Details.
Experimentally, measure absorption versus photon energy; Raman spectroscopy becomes resonantly enhanced when the excitation matches an optical transition. A photoluminescence excitation spectrum of dispersed semiconducting tubes correlates excitation near with emission near after relaxation. Metallic tubes generally lack comparable bright emission because nonradiative relaxation is efficient. Combining optical energies with radial-breathing-mode Raman spectroscopy or electron diffraction assigns tube diameter and roll-up indices; a Kataura plot organizes those assignments.[ref]
Structure-assigned optical spectra of single-walled carbon nanotubes by Sergei M. Bachilo and others. Excitation-emission spectroscopy and assignments to nanotube structures
Past exam of the quantum condensed matter course of the University of Cambridge 2005 Section B B5 Solution Created 2026-10-18 Updated 2026-10-20
In a direct optical transition, a photon promotes an electron between the valence band and conduction band at essentially the same crystal wavevector: optical photon momentum is small on the scale of the Brillouin zone. An indirect optical transition also needs a phonon or another momentum source. Near an indirect gap, phonon emission requires photon energy approximately , while phonon absorption permits with a thermally occupied phonon.
Strong direct interband absorption needs both many allowed transitions and a nonzero optical matrix element. The joint density of states counts pairs with ; nearly parallel bands and critical points of this energy difference can enhance it. Dipole selection rules and polarization weight that count, so a large joint density of states alone does not guarantee a strong absorption peak.
The supplied infrared spectrum lies below the interband threshold and instead probes free-carrier response. In the Drude model, , with . At long wavelengths the mobile electrons screen the field and the reflectivity is high. As wavelength decreases through the screened plasma edge, the real dielectric function becomes positive and propagating light can enter. The reflectivity reaches its minimum near index matching, , then rises toward the bound-electron background reflectance.
For background , its refractive index is four and the normal-incidence Fresnel equations give . The short-wavelength side of the figure is approaching a reflectance of this order, consistent with that background; its shortest plotted wavelength still has a carrier correction. Here “infinity” means high frequency relative to the free-carrier scale while remaining below the remote interband resonances.
The Drude-Lorentz reflectivity minimum is near , not the plasma-edge zero . Reading the deep minimum as and neglecting damping there gives . The carrier effective mass from a reflectivity minimum is thereforeThe graph supports only a rough read-off: shifting the minimum by changes this mass by about five percent. The deep narrow minimum supports the weak-loss assumption in this region, although finite scattering explains why the long-wavelength reflectivity is below unity. The estimate also assumes one dominant carrier species, a nonmagnetic bulk sample and a nearly constant background dielectric function. If the plasma-edge zero is used instead, its denominator is and its wavelength is slightly longer; the two wavelengths must not be interchanged.
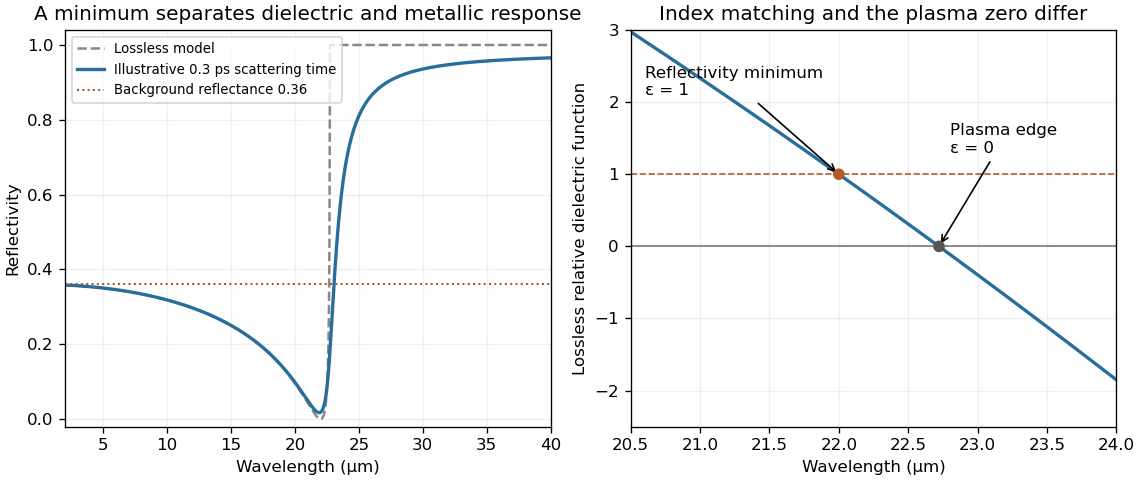
Drude-model reflectivity minimum and screened plasma edge
. Original calculation using , and a mass chosen to place the lossless reflectivity minimum at . The finite-scattering curve uses an illustrative relaxation time, not a fit to the exam's data. The supplied figure has not been copied or traced. Details.
Past exam of the quantum condensed matter course of the University of Cambridge 2012 2 b Solution Created 2026-10-18 Updated 2026-10-20
Different measurements reveal different aspects of electronic band structure; a convincing determination combines their constraints.
Angle-resolved photoemission. In angle-resolved photoemission spectroscopy, photons of known energy eject occupied electrons. Measuring their kinetic energy and emission angle reconstructs binding energy and the component of crystal momentum parallel to the surface:Here is the sample work function when kinetic energy is referenced to the nearby vacuum; an analyzer energy scale requires its own work-function calibration. Momentum is conserved modulo a surface reciprocal lattice vector, neglecting photon momentum. Tracking the peaks maps occupied dispersion relations and the Fermi surface. The measured intensity also contains the matrix element, the Fermi-Dirac distribution and the spectral function, so an absent bright feature does not establish an absent band. For a three-dimensional solid, the perpendicular momentum requires a final-state model. Inverse photoemission spectroscopy probes unoccupied states by injecting electrons and detecting emitted photons.
Optical spectroscopy. Photon absorption and ellipsometry measure interband transitions, optical selection rules and the complex dielectric response. Because optical photon momentum is small on the scale of the Brillouin zone, direct transitions approximately preserve crystal momentum. Their onset constrains a direct band gap; a threshold involving a phonon can reveal an indirect band gap. Peak positions constrain energy differences between bands, but the response also depends on the joint density of states and optical matrix elements, so it does not uniquely determine every .
Quantum oscillations and cyclotron resonance. In clean samples at low temperature, the de Haas-van Alphen effect measures oscillations in magnetization and the Shubnikov-de Haas effect measures oscillations in electrical resistivity as the inverse magnetic field is varied. Their period in inverse magnetic field is , where Onsager quantization relates to an extremal Fermi-surface area perpendicular to the field:Rotating the magnetic field maps the geometry of extremal orbits. The thermal damping determines the cyclotron effective mass,with the appropriate magnitude for a hole orbit. Cyclotron resonance supplies the corresponding dynamical mass through . These are detailed probes near the Fermi level, rather than measurements of all occupied bands. Diffraction supplies the reciprocal lattice needed to label the measured momenta, but diffraction by itself is not a measurement of electronic dispersion.
Energy and momentum measurement. In angle-resolved photoemission spectroscopy, monochromatic photons illuminate a clean surface in vacuum, and an electron energy analyzer measures the outgoing kinetic energies and emission directions. Measuring both gives the occupied electronic band structure, rather than only a momentum-integrated distribution of removal energies.
Choose a common energy reference for initial and final states. Let be the initial electron energy, the Fermi energy, and the vacuum level immediately outside the sample. The binding energy is . For a direct emission event without additional losses, conservation of energy givesHere the work function is the energy from the Fermi level to the local vacuum. The initial and final energies are total single-electron energies on the same scale, while is measured above vacuum. The diagram illustrates each interval independently.
Neglecting ultraviolet photon momentum, photoemission momentum conversion giveswhere is measured from the surface normal. Parallel crystal momentum is conserved modulo a surface reciprocal lattice vector; the surface breaks perpendicular translation symmetry. A three-dimensional sample therefore generally needs a final-state model to infer perpendicular momentum. The stated two-dimensional sheet avoids that ambiguity. The kinetic energy used in this formula is the sample-vacuum value; if the analyzer and sample have different work functions, their contact potential must be included when converting the analyzer's reading, as in photoelectron binding energy reference.
Spectral information. Define and the electron spectral function by . In the sudden approximation, the basic photoemission intensity and spectral function relation isbefore instrumental broadening and background are included. Here is the Fermi-Dirac distribution, and is the transition matrix element. The electron removal spectral function contains the occupied part of the spectrum. In a noninteracting band it has a delta peak at the band energy; interactions shift and broaden peaks and can add incoherent weight. Thus peak trajectories reveal dispersion, while line shapes can constrain lifetimes after resolution effects are accounted for. Dividing by known matrix and occupation factors can estimate where those factors are appreciable; intensity alone is not identical to , and a missing peak can reflect a matrix-element suppression. States well above are not accessible to ordinary low-temperature photoemission.
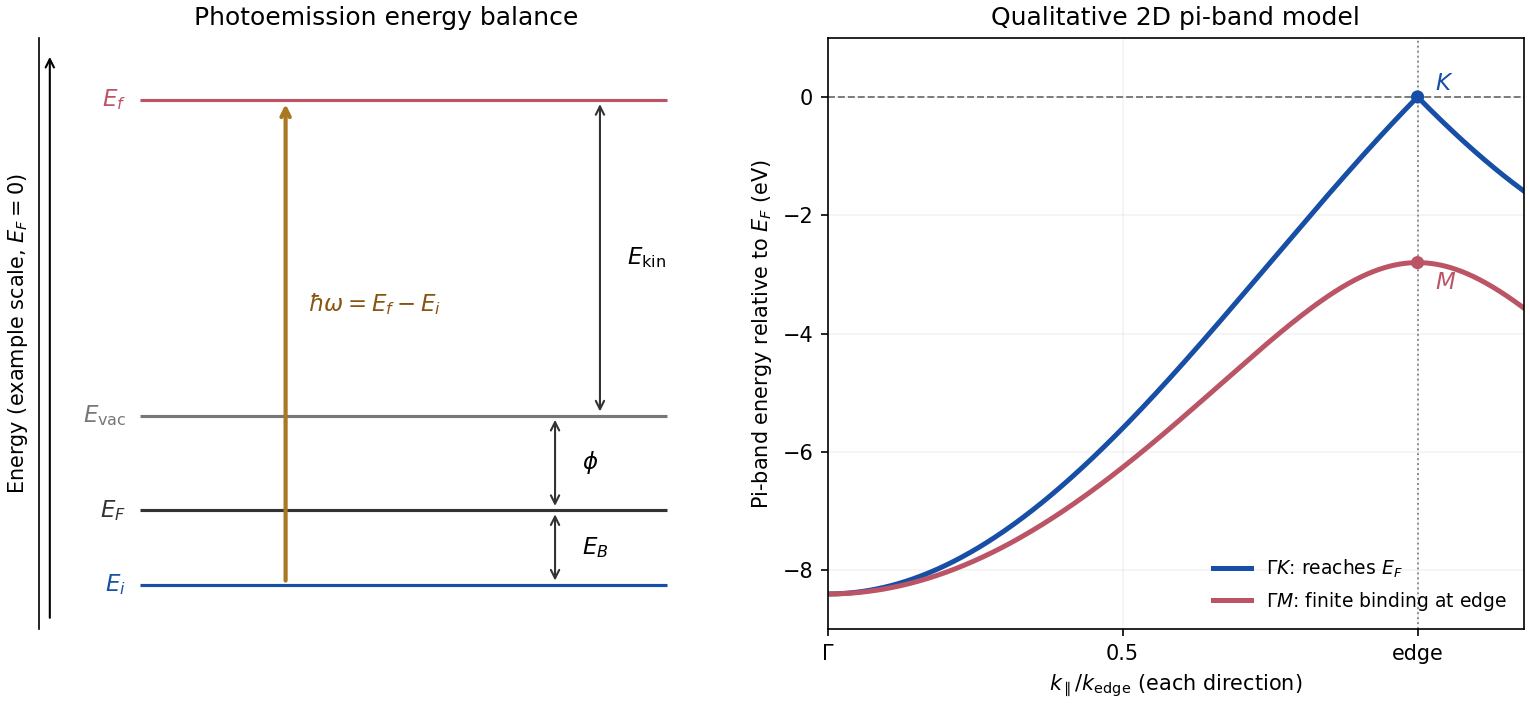
Photoemission energy accounting and qualitative upper valence-band dispersion
. Original schematic energy diagram and illustrative nearest-neighbour graphene pi-band curves. The left panel labels every requested energy and energy interval. The right panel shows an ideal two-dimensional pi band with hopping , not a fit or reproduction of the measured graphite spectra; other occupied orbital bands are omitted. Details.
Two independent band-structure probes. First, the de Haas-van Alphen effect measures oscillatory magnetization as Landau levels cross the Fermi level when a magnetic field changes. The inverse-field frequency iswhere is an extremal Fermi surface cross-sectional area perpendicular to the field. Changing field orientation maps its shape. This reveals the momentum-space geometry of occupied bands; the related Shubnikov-de Haas effect measures oscillatory resistance.
Second, absorption or reflectance spectroscopy detects interband transitions. Photon energies at absorption edges and peaks constrain the band gap and interband energy differences. For a direct band gap, negligible photon momentum selects approximately vertical transitions in the band diagram, weighted by the joint density of states and transition matrix elements. An indirect transition needs a phonon to carry the extra crystal momentum. These measurements provide evidence beyond a free-electron parabola, although an optical spectrum alone does not reconstruct every band's dispersion.
Reading the graphite spectra. For each direction, follow a moving peak through successive angles and convert each peak's own kinetic energy to ; angle is not itself proportional to momentum over this wide range. The prominent dispersing valence feature starts at roughly – binding energy near and moves towards lower binding energy as increases. Along it approaches the Fermi level at the corner, then turns back to larger binding energy on continuing beyond the corner. Along it reaches a finite minimum binding energy of roughly – near the edge midpoint and turns back; it does not reach the Fermi level there. Additional deeper peaks describe other occupied valence branches, with visibility varying across the spectra.
A useful qualitative description is the upper occupied band of the nearest-neighbour model of graphene: . It rises from at to zero at , but only to at . The schematic curve in the figure captures those two different behaviours. It is not a full multi-orbital assignment or a quantitative fit to graphite, whose deeper valence features are also visible in the supplied spectra.
Angle needed to reach the corner. The corner's parallel wavevector isUse the near-zero binding energy of the upper valence band at that point. With the sample work function interpreted as the stated separation below vacuum,HenceThe energy and angle readings in the PDF are approximate. If a peak at the corner were instead assigned a small binding energy , the estimate becomesFor – this gives about –, consistent with the near-Fermi feature in that angular range. Substituting the full photon energy for the kinetic energy would omit the work-function cost and underestimate the required angle.
Two-dimensional joint density of states Created 2026-10-20 Updated 2026-11-05
For two isotropic parabolic subbands, the joint density of states per area and per independent channel is . The constant is a two-dimensional phase-space effect. Degeneracy and optical matrix elements determine the actual step weights.