James A. Blackwell, Jr. coauthored NASA's 1972 study of rear-upper-surface modifications to a supercritical airfoil with Charles D. Harris. The report connects specified shape changes with measured aerodynamic loads.[ref]
The apparatus combined surface pressure orifices with a downstream rake for the fluid wake, in the Langley 8-foot transonic wind tunnel. Surface readings characterized the pressure coefficient distribution, while wake measurements supplied separate information for drag. These observations constrain different parts of the aerodynamic response.[ref]
Wind-tunnel Investigation of Effects of Rear Upper Surface Modification on an NASA Supercritical Airfoil by Charles D. Harris and James A. Blackwell, Jr.. Printed pp. 4–6, Apparatus and Techniques
An original pressure-load example illustrates that distinction. On normalized airfoil chord , stipulate two lower-minus-upper pressure coefficient distributions,Both integrate to one, giving the same chord-normal pressure force. Their first moments differ:At dynamic pressure and airfoil chord , both loads are . In this chord-normal-load model, nose-up-positive pressure moments about the quarter-chord are instead and per metre of span. Equal integrated force therefore does not establish equal load location or pitching moment. These profiles are invented, not reconstructed report data; a measured pressure distribution also does not by itself include the full viscous stress contribution to drag.
Charles D. Harris is the first named author, with James A. Blackwell, Jr., of the 1972 NASA report testing rear-upper-surface changes on a supercritical airfoil. The experiment examined a local off-design velocity peak while also checking the consequences at the design condition. The published summary reports that the particular attempted change adversely affected design-condition drag.[ref]
Wind-tunnel Investigation of Effects of Rear Upper Surface Modification on an NASA Supercritical Airfoil by Charles D. Harris and James A. Blackwell, Jr.. Byline, Summary and Introduction, printed pp. 1–2
The tests covered Mach numbers from to in a transonic wind tunnel. The models differed in rear-upper-surface shape while retaining their trailing-edge thickness; pressure measurements and a wake rake connected the geometric change to aerodynamic observations.[ref]
An original comparison shows why an improvement needs its operating condition. Stipulate that a proposed modification changes drag coefficient by at one condition and at another. With the same reference dynamic pressure and area for this arithmetic example,gives and , respectively. The sign of the benefit reverses. These invented coefficients are not values reported by Harris; they isolate why suppressing one local feature cannot establish lower total drag throughout an operating range.
A useful experimental comparison therefore records the Mach number, Reynolds number, angle of attack, loading and surface condition with the measured pressure coefficient distribution and drag. Changes of boundary-layer transition or mounting effects can alter the result. The documented negative outcome is scientifically informative because it tests a specific geometric proposal rather than assuming that a locally smoother-looking flow must improve complete performance.
Earll Murman is an aerospace engineer and MIT professor emeritus whose institutional profile identifies aircraft systems engineering among his specializations. His authored lecture on aircraft performance connects aerodynamic forces, propulsion, energy and maneuvering constraints. The lecture title page credits him directly and is dated 18 September 2003; the host course is a separate Fall 2004 offering.[ref][ref]
Introduction to Aircraft Performance and Static Stability by Earll Murman. Title slide and Today's Topics

Earll Murman in the portrait provided by his official MIT AeroAstro faculty profile
. One useful connection in that lecture is aircraft energy height. For constant mass , gravitational acceleration , altitude and true airspeed in a still-air model, divide the sum of gravitational potential energy and kinetic energy by gravitational weight:If thrust acts along the motion, drag opposes it, and other energy exchanges are neglected, the specific excess power isThis expresses the possibility of using the available mechanical power for climbing, accelerating, or both.[ref]
Introduction to Aircraft Performance and Static Stability by Earll Murman. PDF pp. 21–24, Specific Energy and Excess Power and Summary of Power Characteristics
For an original stipulated example, take , , and . Then . At constant true airspeed, that is the model's climb rate. At constant altitude, the same instantaneous power gives . These are alternative allocations at the stipulated condition, not a claim that an actual engine maintains the same excess thrust throughout a maneuver.
The distinction illustrates why satisfying a lift or aerodynamic load factor requirement alone does not establish sustained performance. Measurements of speed change, altitude change, thrust and drag test different terms of the energy account. The lecture's force and energy models make those assumptions explicit; they do not replace configuration-specific experimental data.
Catherine B. McGinley is identified as a Langley researcher and coauthor with Dan H. Neuhart of a 2004 experimental report on wind-tunnel turbulence intensity. The primary title page establishes this byline; the report connects the claimed flow quality to a documented measurement procedure.[ref]
Free-Stream Turbulence Intensity in the Langley 14- by 22-Foot Subsonic Tunnel by Dan H. Neuhart and Catherine B. McGinley. Title page and printed pp. 7–9, apparatus and data analysis
The experiment used calibrated hot-wire anemometry to convert electrical signals into mean and fluctuating velocity. Its comparisons included different positions and tunnel operating conditions. Calibration and retained frequency range belong to the interpretation of a turbulence result; the report's Figure 20 explicitly examines bandwidth sensitivity.[ref]
Free-Stream Turbulence Intensity in the Langley 14- by 22-Foot Subsonic Tunnel by Dan H. Neuhart and Catherine B. McGinley. Printed pp. 8–9, hot-wire calibration; Figure 20, integration-bandwidth comparison
An original calculation illustrates why a numerical turbulence intensity needs a scale. With , stipulate and mean speed . Then . If an independent additive measurement-noise component has RMS , the observed fluctuation RMS becomesgiving . Subtracting RMS values directly would give the wrong answer; independence permits subtraction of variances. These stipulated numbers are not measurements from the report. The example shows why a small recorded fluctuation cannot be interpreted without considering apparatus noise and the measurement model.
Dan H. Neuhart is the first named author, with Catherine B. McGinley, of the 2004 Langley study of wind-tunnel turbulence intensity. The report's title page identifies the byline and Langley affiliation. Its scientific contribution is an experimental characterization of tunnel flow with a specified signal chain, rather than an assertion that a facility has one universal turbulence number.[ref]
Free-Stream Turbulence Intensity in the Langley 14- by 22-Foot Subsonic Tunnel by Dan H. Neuhart and Catherine B. McGinley. Title page, Summary and flow-quality survey
The study combined hot-wire anemometry, velocity calibration and spectral analysis. The reported dynamic-data procedure retained approximately to , sampled at and acquired simultaneous records. The distinction between sampling rate and retained bandwidth is essential: increasing the former does not establish which fluctuations were included in the reported intensity.[ref]
An original ideal spectral example makes that distinction quantitative. Suppose a one-sided power spectral density is constant at across a selected band and zero elsewhere. ThenKeeping only a subset of that flat band gives . The changed answer reflects a changed integration band, not a measured improvement in the underlying flow. Real spectra are not generally flat; the invented example isolates the reporting issue without attributing either value to Neuhart's experiment.
Ira H. Abbott was an aerospace engineer whose Langley work connected airfoil geometry, wind tunnel measurements and corrections to aerodynamic data. NASA's institutional profile records his arrival at the Variable Density Tunnel in 1929, subsequent airfoil research and participation in tunnel design. The profile emphasizes that section data do not by themselves determine a complete three-dimensional aircraft wing's behavior.[ref]
Ira H. “S” Abbott by NASA. Technical-career paragraphs, Variable Density Tunnel and distinction between airfoil and wing design
A specific primary contribution is the 1939 report with Eastman N. Jacobs on support interference in the variable-density wind tunnel. Its abstract states that the support effect made earlier drag coefficients and their apparent increase with airfoil thickness too large; the report supplies corrected data and methods. The apparatus supporting a model can alter the flow being measured, so its effect is not established merely by an empty-tunnel zero.[ref]
For an original arithmetic illustration, stipulate measured drag coefficients of and for two sections, with separately established support corrections of and . The corrected values are and : the apparent difference falls from to . At dynamic pressure and a shared reference area of , these correspond to corrected drag values of and . This invented example illustrates the experimental question; it does not replace the report's geometry-dependent correction method with a universal subtraction.
Richard T. Whitcomb was an aerospace engineer at the National Advisory Committee for Aeronautics and National Aeronautics and Space Administration's Langley laboratory. His research linked aerodynamic geometry with measurements of pressure, drag and flow changes near the speed of sound. NASA's official profile identifies his area rule, supercritical airfoil and winglet work.[ref]
Richard T. Whitcomb by NASA. Named biography and passages on the three aerodynamic contributions
His 1947 sweep investigation provides a concrete earlier example. A wing was tested with zero, forward and backward sweep in the Langley 8-foot high-speed wind tunnel. Pressure measurements and wake surveys supplied loading and drag information, showing that changes associated with shocks were delayed by sweep without following a universal cosine shift exactly.[ref]
For the area rule, the scientific question was whether the streamwise area distribution of the complete wing-body combination mattered more than judging each component separately. NASA describes testing his proposed distribution with a specially built wing-body model, then applying the result to a fighter configuration.[ref]
Richard T. Whitcomb by NASA. Area-rule passage, prioritized model test and subsequent configuration change
An original bookkeeping example illustrates the geometric idea without predicting wave drag. If a body contributes of cross-sectional area at one station and the added wing contributes another to the stipulated combined section, their sum is . Reducing the body's contribution to restores a total there. The relevant research concerns how that total varies along the vehicle; this one-station sum is not a drag law.
His later supercritical airfoil and winglet contributions addressed different flow mechanisms. NASA describes a shaped high-subsonic section and carefully tailored wing-tip devices, rather than treating every drag reduction as the same geometric correction.[ref]
Richard T. Whitcomb by NASA. Supercritical-wing and winglet passages
The common experimental method is to specify the geometry, identify the predicted flow change and measure the resulting aerodynamic response.- A Design Approach and Selected Wind-Tunnel Results at High Subsonic Speeds for Wing-Tip Mounted Winglets by Richard T. Whitcomb
- An Investigation of the Effects of Sweep on the Characteristics of a High-Aspect-Ratio Wing in the Langley 8-Foot High-Speed Tunnel by Richard T. Whitcomb
- A Study of the Zero-Lift Drag-Rise Characteristics of Wing-Body Combinations Near the Speed of Sound by Richard T. Whitcomb
Robert M. Pinkerton investigated airfoil aerodynamics at the National Advisory Committee for Aeronautics. He coauthored the related-section study with Eastman N. Jacobs and Kenneth E. Ward and later compared measured surface pressure distributions with potential flow calculations.[ref]
The Characteristics of 78 Related Airfoil Sections from Tests in the Variable-Density Wind Tunnel by Eastman N. Jacobs and others. Report byline
[ref]His 1937 report describes a 5-by-30-inch NACA 4412 model in a variable-density wind tunnel, with 54 pressure orifices at the middle of the span. Seventeen angles of attack, from −20 to 30 degrees, were tested at a Reynolds number of approximately. These readings test the distribution of pressure, not merely whether the total lift happens to agree with a calculation.[ref]
Calculated and Measured Pressure Distributions over the Midspan Section of the NACA 4412 Airfoil by Robert M. Pinkerton. NTRS abstract, apparatus and conditions
An original simplified example explains the extra information. If a thin airfoil has a constant difference over its chord, its surface pressure integration for airfoil lift gives the normal-force approximationWith dynamic pressure and airfoil chord , the normal force per unit span is . A different distribution can give the same integral while producing a different pitching moment or boundary layer behavior. These are invented uniform data, not Pinkerton's measurements.
Finite pressure-tap spacing and pressure-tap position error can change the inferred integral. A measured distribution therefore offers both a stricter test of potential flow and a way to see where its assumptions cease to describe the actual fluid flow.
Kenneth E. Ward was a National Advisory Committee for Aeronautics researcher whose wind tunnel investigations examined interactions between aircraft components. He also coauthored the systematic related-airfoil investigation with Eastman N. Jacobs and Robert M. Pinkerton.[ref]
Interference Effects and Drag of Struts on a Monoplane Wing by Kenneth E. Ward. Byline, Introduction and Apparatus and Tests
[ref]In his 1931 strut experiment, a 5-by-30-inch Göttingen 387 airfoil was tested first alone and then with inclined struts attached in different upper- and lower-surface positions. The variable-density wind tunnel operated at 20 atmospheres and approximately . A repeated wing-alone test before and after the strut trials checked the comparison's repeatability. Separate strut measurements helped isolate aerodynamic interference.[ref]
Interference Effects and Drag of Struts on a Monoplane Wing by Kenneth E. Ward. Printed pp.2–5, Apparatus and Tests and Discussion of Results
The central question is whether component drag adds. Define an interaction residual at matched operating conditions byFor invented measurements of , and, respectively, . The assembly's drag increase is twice what the isolated struts contribute. Ward reported that interaction drag could be as large as the struts' own drag; the numerical forces here simply illustrate the subtraction.[ref]
Interference Effects and Drag of Struts on a Monoplane Wing by Kenneth E. Ward. Summary and Discussion of Results, interference compared with isolated strut drag
This aircraft component drag interaction is why a streamlined part cannot be assessed solely in isolation. Changing its location also changes neighboring pressure and fluid flow. Comparable Reynolds numbers, mounting corrections and repeat measurements are needed to distinguish that interaction from a changed test condition.
Eastman N. Jacobs (1902–1987) was an aerodynamicist at the National Advisory Committee for Aeronautics' Langley laboratory. He joined in 1925 and led its variable-density wind tunnel section from 1928 to 1939. His work connected systematic NACA airfoil geometry with experimental measurements and later helped drive low-turbulence airfoil research.[ref]
The scientific problem was that a wind tunnel can influence the very phenomenon being studied. Higher air density raises the model's Reynolds number, making a small airfoil more representative of a larger one. But a large wind-tunnel turbulence intensity can alter boundary layer transition, preventing an otherwise appropriate Reynolds number match from reproducing flight behavior. NASA's account describes this difficulty as a motivation for Jacobs's low-turbulence tunnel program.[ref]
An original scale comparison makes the distinction concrete. At mean speed , an illustrative fluctuating velocity with root mean square has intensity . A second test with the same mean speed, density, dynamic viscosity and model dimensions but has intensity . Both have the same Reynolds number; their fluctuation levels differ twentyfold. These stipulated values are not historical tunnel measurements.
Jacobs's program thus illustrates why dimensional analysis and careful apparatus design complement one another. A laminar flow claim needs evidence about the flow environment as well as a smooth-looking airfoil. His collaborators Kenneth E. Ward and Robert M. Pinkerton supplied further experiments on related sections and their measured performance.

Eastman N. Jacobs seated at the far-left control panel during airfoil testing in the variable-density wind tunnel,15 March 1929. NACA photograph.
Source. Pradeep Raj is an aerospace engineer whose work concerns computational fluid dynamics in aircraft design. His Virginia Tech profile records a 1976 doctorate in aerospace engineering and describes teaching in aircraft design and applied computational fluid dynamics. Its account emphasizes using calculated forces and torques as inputs to structural and control design, while recognizing credibility problems in strongly separated flows.[ref]
His account of simulation-driven design identifies an important distinction: a virtual prototype can be inexpensive to change, but it helps engineering only if its predictions correspond sufficiently well to the real system. Faster calculations alone do not establish model validation.[ref]
An original uncertainty calculation illustrates the issue. Suppose a stipulated aircraft model requires and a computation predicts drag . Its predicted lift-to-drag ratio is . A second design predicted to have appears better, with . If either actual drag can independently differ from its prediction by up to , their intervals overlap and either ordering is possible. The nominal 5% drag reduction is not by itself a verified improvement.
Experiments addressing the relevant Reynolds number, Mach number and flow separation can test that comparison. Computational fluid dynamics and wind tunnel measurements have different limitations; their agreement is informative only when geometry, operating conditions and measurement definitions are comparable. This is a reason to study predictive credibility alongside numerical efficiency.


William H. Mason, whose earlier course notes use the byline W. H. Mason, was an aerospace engineer and Virginia Tech professor whose work connected aerodynamic theory, computation and aircraft design. His university identifies both his academic work and his earlier industrial experience at Grumman in introducing the posthumous Lecture Notes on Configuration Aerodynamics by William H. Mason.[ref]
Lecture Notes on Configuration Aerodynamics by William H. Mason. Publisher landing page, author byline and scope; official departmental announcement linked in source card
The earlier Applied Computational Aerodynamics by W. H. Mason gives a particularly concrete example of this approach. Its geometry appendix turns an airfoil or wing planform into explicit equations suitable for calculation: a shape is not merely a sketch but a set of coordinates, chord distributions and area integrals. For a trapezoidal wing, specifying wingspan, root chord and wing taper ratio determines the projected wing area, which then enters the definition of lift coefficient.[ref]
Applied Computational Aerodynamics by W. H. Mason. Appendix A, Geometry for Aerodynamicists, pp. A-1 and A-27–A-29
This emphasis is useful in interpreting a simulation. A computed change in lift can come from a changed wing planform, a changed angle of attack, or a changed normalization by wing area; checking the geometry and reference quantities is part of checking the result. Mason's later lecture notes extend the design perspective across low-speed and high-speed configurations, with Pradeep Raj serving as editor of the published volume.[ref]
Raymond S. Castner is an aerospace engineer whose NASA work includes the interaction between exhaust plumes and shock waves in supersonic flow. His 2010 report describes a wind tunnel model designed to study how an exhaust nozzle changes the near-field pressure pattern associated with a sonic boom.[ref]
Wind Tunnel Model Design for the Study of Plume Effects on Sonic Boom for Isolated Exhaust Nozzles by Raymond S. Castner. NASA/TM-2010-216259, abstract and sections II–III
The apparatus places an isolated nozzle between transparent tunnel walls, allowing Schlieren photography alongside pressure measurements and comparison with computational fluid dynamics. Its geometry was chosen to leave a useful observation region before shock waves reflected from the tunnel walls reached the model centreline. This is an example of experimental design in which the measuring environment itself creates disturbances that must be separated from the physical effect under study.[ref]
Tom Benson is an aerospace engineer whose NASA work connects computational fluid dynamics, wind tunnel measurements and scientific education. In his institutional autobiography, he describes computing three-dimensional supersonic flow through aircraft inlets and studying the movement of fluids in microgravity.[ref]
His educational work developed interactive simulations that behave like small virtual wind tunnels: a student changes inputs, the program calculates a new result, and computer graphics display the response. The accompanying Beginner's Guide to Aeronautics connects those simulations with the underlying equations. This makes the relation between a mathematical model, an adjustable input and an observable prediction part of the explanation itself.[ref]
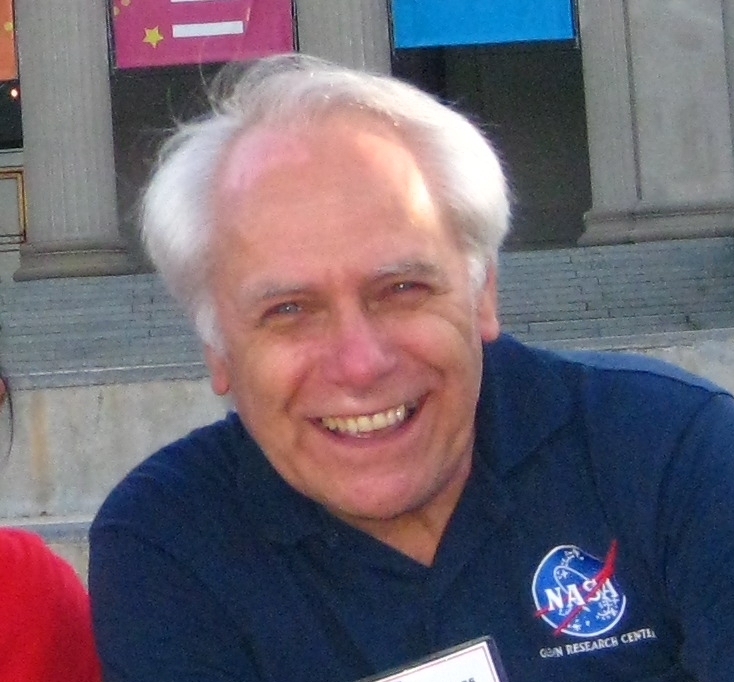
Portrait of Tom Benson
. Nancy Hall is an aerospace engineer whose NASA biography describes work on fluid mechanics in microgravity. She moved to the Fluid Physics Branch in 1994 and helped researchers use facilities such as a drop tower and reduced-gravity aircraft, as well as prepare proposed flight experiments.[ref]
In such work, understanding the scientific question and the apparatus are closely connected. A microgravity environment changes the relative importance of gravity compared with other forces acting on a fluid; an experiment must specify the conditions it actually achieves. Her described role linked principal investigators with engineering teams and ground-based facilities, helping translate a proposed measurement into an experiment. The institutional biography provides a historical account of this work rather than a statement of her current assignment.[ref]
Biography of Nancy Hall. Fluid Physics Branch, ground-based facilities and flight-definition experiments

Portrait of Nancy Hall
. Articles by others on the same topic
There are currently no matching articles.