Parametric linkage analysis specifies a disease-transmission model: the mode of inheritance, disease-allele frequency and penetrance of each genotype. Combining these with Mendelian segregation and the recombination fraction gives a pedigree likelihood. One can estimate the recombination fraction or compare a linked model, , with the unlinked model, , using a likelihood-ratio test or LOD score. Incomplete penetrance and unobserved genotypes are accommodated by summing over the possible underlying inheritance states.
Nonparametric linkage analysis instead tests whether relatives with the same disease phenotype share marker alleles identical by descent more often than expected from their pedigree. For example, affected-sib-pair analysis compares sharing among affected full siblings with its Mendelian null distribution. It avoids specifying a complete disease-penetrance model and disease-allele frequency. “Model-free” still assumes an inheritance model for the marker, correct family relationships and a justified treatment of genetic-study ascertainment; it does not mean assumption-free.
Parametric analysis models the disease likelihood; nonparametric analysis tests departure from the marker's Mendelian sharing distribution.
Label the two paternal ancestral marker copies and the two maternal copies . Treat these as four distinct ancestral copies in an outbred pedigree; equal observed alleles need not imply identity by descent. By Mendelian segregation, each child independently receives either paternal copy with probability . Thus the indicator that the two full siblings inherit the same paternal copy satisfiesThe same argument gives for the maternal copy. Paternal and maternal meioses are independent, so and are independent. Consequently the number of copies shared identical by descent has a binomial distribution, givingThis is Mendelian IBD sharing of full siblings. It describes an ordinary, unselected sib pair: conditioning on a shared disease phenotype can change the distribution if there is genetic linkage to its causal locus.
For the Mendelian identity by descent count , the expected shared proportion isThe corresponding expected number of shared copies is one. These are different scales for the same random variable.
With genetic linkage to a disease locus, selecting two affected full siblings preferentially selects transmissions of disease-associated ancestral copies. A nearby genetic marker may then show excess identity by descent: the expected shared proportion can exceed , which is the basis of affected-sib-pair analysis. The precise distortion depends on penetrance, inheritance and the recombination fraction; disease status alone does not prescribe a universal alternative distribution. In the fully penetrant recessive model derived below, setting givesThus the expected shared proportion rises from at to one at complete genetic linkage, .
Let denote the disease allele. Complete penetrance with recessive inheritance makes each affected child . The unaffected parents must therefore both be genetic carriers. Condition on these parental genotypes and the fully informative marker; the distinct paternal and maternal marker copies identify which parent's copies are shared. Average over the two equally likely marker-disease haplotype phases in each parent. This is the phase-symmetric model implicit in the requested pedigree likelihood identities.
For one parent, suppose first that both children receive the same marker copy. If that marker copy is on the parental chromosome carrying , both children receive with probability ; in the opposite phase the probability is . The phase-averaged probability isIf the children receive different marker copies, one disease-allele transmission is recombinant and the other is nonrecombinant in either phase. The probability that both receive is thereforePaternal and maternal transmissions are independent. Sharing zero marker copies means the different-copy case for both parents; sharing two means the same-copy case for both; sharing one means one of each. Thus the recessive affected-sib-pair likelihood isHere is the probability that both children are affected conditional on the marker sharing state , not the probability of conditional on their being affected. Since ,At , all three conditional disease probabilities equal , as expected from two independent children of an mating. At , only the two-copy-sharing state can produce two affected children. Phase weights other than would require a different likelihood function and need not obey these identities.
Take the affected sib pairs from independent families with the same disease model. Conditional on their marker sharing states, multiply the recessive affected-sib-pair likelihoods:Write , so that and . ConsequentlyFor an unordered count sample there can also be a multinomial likelihood coefficient, and the Mendelian probabilities of the observed marker sharing states supply further factors. All these factors are independent of .
If genetic-study ascertainment explicitly conditions on both children being affected, the normalizing disease probability is constant:Thus the conditional sharing likelihood differs from the displayed likelihood function only by factors independent of the recombination fraction. Multiple pairs drawn from the same larger sibship would not, in general, justify treating these pair likelihoods as independent.
Put and . The usual recombination fraction range gives , and the preceding likelihood function becomesTo see its relation to nonparametric linkage analysis, use Bayes' theorem and the constant disease probability to obtain the affected-pair marker-sharing probabilitiesTheir multinomial likelihood has exactly the same -dependent kernel, since its extra factor is constant. Set and . Then , and is the total number of shared ancestral copies. At fixed , the Fisher-Neyman factorization theorem makes a sufficient statistic. The observed mean shared proportion is , and the binomial likelihood kernel givesThe unlinked null is , whereas linkage corresponds to , or expected shared proportion . If , the constrained likelihood is maximized at the unlinked null. For , its log likelihood ratio iswhose derivative in is . Hence it orders samples exactly by excess IBD sharing. Under this fully penetrant recessive model, parametric linkage testing and a one-sided test of the overall IBD-sharing proportion use the same information. This is allele-sharing sufficiency for recessive linkage, not a general equivalence for all disease models. Use limiting values for terms such as , and assume for the estimators.
The kinship coefficient is the probability that a randomly selected allele copy from individual and an independently selected copy from individual at the same genetic locus are identical by descent. The sampling is of gene copies, not of whole genotypes. For a noninbred individual , sampling its two copies with replacement gives ; in general , where is its inbreeding coefficient.
For two full siblings in an outbred pedigree, the two sampled copies are both paternal with probability , both maternal with probability , and of different parental origin with probability . Given that both are paternal, their independent Mendelian segregation transmissions select the same paternal ancestral copy with probability ; likewise for both maternal. The different-parent case cannot be identical by descent when the parents are unrelated. ThereforeEquivalently, conditional on an IBD-sharing count , the chance that the two random copies match is , so . The expected shared proportion and the usual additive relationship coefficient are twice this kinship coefficient; confusing these conventions would double the subsequent inbreeding coefficient.
Let the first cousins be , with parents and respectively, where are full siblings and have no ancestral relationship to one another or to that sibling family. To compute , choose one allele copy from each cousin. They originate from and with probability . All other parental combinations have zero kinship coefficient under the otherwise outbred pedigree assumption. HenceThe two gene copies within a child of are random transmissions from these parents. They are identical by descent precisely in the event defining parental kinship, so the child's inbreeding coefficient isFor a direct ancestral-path check, there are two shared noninbred grandparents. Through either grandparent, the two cousin-to-grandparent paths have two meioses each, and matching the ancestral grandparental copy supplies a further factor . Each contributes , giving the same first-cousin inbreeding coefficient. Additional ancestral relationships or inbred grandparents would change the result.
Assume a single disease allele , complete penetrance of , no disease in or , and Hardy-Weinberg equilibrium in the outbred population. If its population frequency is , the disease prevalence is , so .
For a child with inbreeding coefficient , the two inherited copies are identical by descent with probability . In that component there is just one ancestral allele draw, and it is with probability . In the remaining component there are two independent ancestral draws, with probability of . Thus the inbreeding genotype frequencies giveUsing the first-cousin inbreeding coefficient , the disease-risk ratio isThe absolute risk in this model is . This calculation averages over the parental genotypes in first-cousin marriages before observing an affected child. It is not the risk conditional on both parents being known genetic carriers, and assumes the specified cousin relationship is independent of disease status rather than conditioning on a selected disease pedigree.
Assume the parents are unaffected, the disease has complete penetrance with a single recessive causal allele, and there are no phenocopies, new disease mutations or alternative causal loci. An affected first child has genotype , so each unaffected parent must be a heterozygote . Conditional on these parental genotypes, Mendelian segregation in the second child's paternal and maternal meioses is independent of the transmissions to the first child. ThereforeThis is the same sibling recurrence risk as for unrelated, unaffected parents under the same recessive model. Parental kinship increases the prior probability that both parents carry the same rare disease allele; after both are identified as carriers, it does not alter their Mendelian transmission probabilities. The factor from the preceding part is therefore not an additional multiplier on the sibling recurrence risk.
If unaffected parents are not explicitly required, the rare-disease assumption is an approximation supporting the usual carrier-by-carrier calculation, rather than a logically exact consequence of an affected child alone. Under complete penetrance, the compatible parental matings are , and , with second-child risks respectively. Let their prior probabilities be , including both orders in . Conditioning on the affected first child givesWithout negligible or excluded affected-parent matings, this mixture need not equal and may depend on consanguinity. Likewise incomplete penetrance or disease heterogeneity invalidates the assertion that an affected child of unaffected parents necessarily identifies an mating. The stated answer uses the unaffected-parent, fully penetrant single-locus assumptions.
Use standard diploid coalescent time units of generations, where is the fixed effective population size, and take . In the neutral Kingman's coalescent, each unordered pair of ancestral lineages merges at rate one. With lineages, the next coalescence time therefore has an exponential distribution with rateThe memoryless construction and the Markov property make these epoch durations independent. During epoch there are branches, each of duration , so the total branch length of a neutral coalescent isBy linearity of expectation,The ancestral branch above the sample's most recent common ancestor is excluded: mutations there would be shared by all sampled chromosomes and would not create segregating sites.
Let be the mutation rate per chromosomal segment per generation, and use the population-scaled parameter . In -generation coalescent units, mutations occur on each ancestral lineage at rate . Independent mutations on all branches of a given phylogenetic tree superpose to give a Poisson distribution with mean .
Under the infinite sites mutation model, each mutation occurs at a distinct position, and every mutation below the sample's common ancestor separates a nonempty proper subset of sampled chromosomes from the remainder. Thus the mutation count is exactly the segregating site count, givingBy the law of total expectation and the previous branch-length formula,This also gives the Watterson estimator as an unbiased moment estimator of . Here all sample segregating sites are counted, including singletons; filtering sites by a minimum sample frequency or by external SNP discovery would introduce genetic-study ascertainment and change this calculation.
Let , with all , and put . The independent exponential epoch times have joint densityTake a proper prior distribution density on , independent of the neutral genealogy. Independence is appropriate because the specified neutral Kingman's coalescent does not depend on the mutation parameter. The conditional observed-count likelihood function isIts prior predictive probability, or Bayesian model evidence, isAssuming , Bayes' theorem gives the joint posterior of mutation rate and coalescent times:It is zero outside the prior support and positive-time region. For , use the usual convention in the Poisson mass. An improper prior cannot be sampled as the proposal in the following algorithm, even in cases where its formal posterior can be normalized.
Use the joint prior density as the proposal for rejection sampling. Since the Poisson probability lies in , the following algorithm is valid:
- Draw from the proper prior distribution .
- Independently draw from the exponential distributions with rates , for , and calculate .
- Draw uniformly on , independently of all previous draws. Retain if ; otherwise restart.
The joint density of a proposed pair together with its acceptance event is . Its integral is , so conditioning on acceptance gives precisely , the desired posterior density. Repeating independent proposal trials until each acceptance produces independent posterior observations. This is Bayesian rejection sampling for a segregating-site count.
An equivalent implementation simulates and accepts exactly when . Its acceptance probability is the same Poisson mass. Propose from the joint prior and accept according to the exact observed-count likelihood. No approximation to the posterior distribution is involved in the accepted draws.
Integrating the acceptance probability over the joint-prior proposal givesThe mean number of independent proposal trials per acceptance is , by the geometric distribution. To make the acceptance rate explicit for an arbitrary specified prior, define the segregating-site likelihood under the neutral coalescent by . ThenFor the last identity, is the sum of independent exponential variables with rates ; combine their Laplace transforms with the conditional Poisson probability generating function. If an explicit mass is wanted, also has density : it is the maximum of independent unit exponential variables, whose successive spacings have exactly these exponential rates. Expanding and integrating the Poisson mass givesUse for . The positive integral or generating-function expression may be numerically preferable to this alternating sum.
A sharper rejection envelope improves the algorithm without changing its proposal. For , maximize the Poisson mass over :It increases until and decreases afterwards, so its maximum is . For , the maximum is . Replace the acceptance rule by . This is bounded by one, and its accepted density is unchanged because the factor cancels on normalization. ThusFor it is strictly more efficient, with improvement factor by Stirling's formula. For this envelope improvement gives no increase. Evaluating the Poisson mass and using a uniform draw also avoids generating a Poisson count only to discard it. A proposal concentrated near the posterior can improve efficiency further, but then its density and a valid rejection bound must be included.
The accepted values have marginal posterior densityEstimate this one-dimensional density by a histogram or kernel density estimation from the simulated values. Where , likelihood reconstruction from posterior simulation givesUse bins or a sufficiently fine grid, and refine near the maximum. For a histogram with bins , its posterior mass divided by prior mass estimates a prior-weighted average of the likelihood in that bin:Narrowing the bins gives pointwise likelihood reconstruction at continuous positive-prior points. A flat proper prior over the search interval makes the highest posterior-density bin approximately the highest-likelihood bin. With a nonconstant prior, maximizing the posterior alone gives a maximum a posteriori estimate, generally different from maximum likelihood estimation. Choose prior support covering the intended search region and include a possible boundary maximum; for , decreases with , so the maximum-likelihood estimate is .
The sampled genealogies provide a second likelihood reconstruction when the one-dimensional prior integral is computable. PutTheir posterior density is . Therefore, for any trial value ,This is an importance sampling estimate of the likelihood curve using the posterior genealogies. It can be maximized over a grid without estimating a posterior density in , provided wherever the target integrand is positive and the weights are numerically usable. The ordinary moment estimate is not automatically a maximum-likelihood estimate: it uses only the mean equation, while the likelihood integrates the entire random branch-length distribution.
Let and encode the alleles at two loci on a randomly chosen population haplotype. Write , and . The linkage disequilibrium coefficient isThe determinant identity follows by substituting the marginal frequencies and . All four haplotype frequencies can be recovered asThus is precisely independence of the two allelic states. Its sign depends on which alleles are labeled one, and its possible magnitude depends on the marginal frequencies.
One other measure is squared allelic correlation. For segregating loci, , their indicator-variable covariance is , and their variances are and . HenceThis is the squared correlation, useful for measuring how well one marker predicts the other in association mapping. It is undefined if a locus is monomorphic. Linkage disequilibrium describes population haplotype frequencies; genetic linkage describes transmission within meioses. Physically linked loci can have , and population mixing can produce LD even between unlinked loci.
Across a human chromosome, neighboring single-nucleotide polymorphisms often show substantial linkage disequilibrium, while average allelic correlation tends to decline with increasing genetic distance. A new mutation starts on one ancestral haplotype; repeated genetic recombination separates it from progressively more distant markers. In an ideal randomly mating two-locus population without further mutation, migration or selection, gamete formation gives , where is the recombination fraction. The marginal allele frequencies remain fixed, soHere the prime means the next-generation value, not a separately standardized LD statistic. This simple decay explains the distance trend, rather than asserting an exact deterministic law for real finite populations.
The local pattern is heterogeneous. Many regions have haplotype blocks with strong LD and a small number of common haplotypes, separated by intervals showing more historical recombination, often recombination hotspots. A hotspot can therefore cause a rapid drop in LD between markers that are close in physical distance. Block lengths and boundaries are not uniform, perfectly sharp or independent of the population and the statistical block definition. These empirical features are documented in the HapMap data.
Population history also matters. Population bottlenecks can reduce the number of ancestral haplotypes and increase the extent of LD; population stratification or admixture can create longer-range associations, including between distant loci. Different populations can consequently have different haplotype frequencies and LD patterns at the same genomic interval. Raw also varies with allele frequency, so comparing LD across markers requires attention to the chosen measure. The typical pattern is locally strong, block-like and highly variable LD, with a broad decline over genetic distance rather than a uniform chromosome-wide decay.
Suppose a disease-risk mutation first occurs on an ancestral haplotype. Descendants carrying the risk allele initially share that surrounding haplotype. Historical genetic recombination progressively replaces the flanks while retaining the disease allele, leaving linkage disequilibrium between the causal variant and some nearby genetic markers. A noncausal marker can therefore have different allele frequencies in affected individuals and suitably chosen controls. This is the basis of association mapping.
One first tests dense markers or multi-marker haplotypes for genetic association with the disease phenotype. Strongly correlated single-nucleotide polymorphisms can be represented by tag SNPs to locate an associated region efficiently. Within that region, denser genotyping and examination of disease-associated haplotypes locate historical recombination breakpoints: segments retained across independently recombined disease-bearing chromosomes are stronger candidates for containing the causal allele. Compare affected and unaffected carriers as well, since incomplete penetrance and other risk factors can prevent a perfect haplotype-disease correspondence.
Association mapping can achieve fine resolution because it uses recombination accumulated over many generations, rather than only the few observed meioses in a present-day linkage pedigree. Resolution depends on the local recombination history: a long region of strong LD may identify a disease-associated block while leaving many variants statistically indistinguishable. Additional informative haplotypes or populations with different LD can help separate them. Conversely, very weak LD requires closer marker spacing to avoid missing the causal region.
Population stratification must be controlled by ancestry-matched comparisons, statistical adjustment or an appropriate family-based association design, since ancestry can affect both disease frequency and marker frequency. A marker association alone establishes neither causality nor identity of the disease gene; nearby correlated variants must be distinguished by further genetic and functional evidence. Use LD to detect a disease-associated ancestral segment, then use historical recombinants to narrow the causal interval. The correlation between causal variants and their surrounding haplotypes, together with the value of representative markers, is illustrated in the HapMap study.
An ancestral recombination graph, or ARG, is the directed ancestry of a sample of chromosomal segments when ancestral lineages can both coalesce and undergo genetic recombination. It records which ancestral material each lineage carries, the times of events and the recombination breakpoints. At any fixed genomic position, following only the ancestral material at that position gives a marginal phylogenetic tree. Different positions can have different trees, while sharing substantial parts of their history. The graph is acyclic in time, although its underlying undirected graph can have loops because a lineage splits backwards and its ancestors can later rejoin.
For the standard neutral, constant-size, randomly mating diploid model, measure time in generations and set , where is the recombination rate across the whole segment. The backward process is a continuous-time Markov jump process on collections of lineages carrying ancestral material:
- Each unordered pair of current lineages coalesces at rate one. The parent lineage carries the union of their ancestral material, with common ancestry recorded at overlapping positions. With lineages the total coalescence rate is . The full ARG permits a pair to merge even when its carried material is disjoint; such an event creates no merger in a local tree at that instant.
- A lineage splits into two parental lineages at a recombination breakpoint. With a uniform recombination map on a segment of normalized length one, the intensity of breakpoints along a fully ancestral lineage is per unit length. If a lineage carries only part of the segment, only cuts leaving ancestral material on both sides need be retained, giving rate , where is the span between its leftmost and rightmost ancestral positions. Material to the left goes to one parent and material to the right to the other. A gap within that span still permits a cut that separates two carried pieces.
For a state with lineages, independent exponential event clocks give total rateThe next waiting time has exponential distribution with rate ; choose its event type in proportion to the corresponding rate. A coalescing pair is uniform among unordered pairs; a recombining lineage is selected with weight and its breakpoint is uniform over its active span. With a nonuniform genetic map, use the corresponding integrated intensity and map-weighted breakpoint distribution. Initially all sample lineages span the whole segment, so the initial rate is . Ancestral material no longer needed after its sample copies have found their local common ancestor can be pruned.
Mutations are placed independently on the resulting ancestral branches, with local rate in coalescent units for a locus having scaled mutation parameter . Without recombination, the graph reduces to a single Kingman's coalescent tree. With recombination, each individual locus still has that marginal coalescent distribution, but trees at different loci are dependent. The ARG combines backward pairwise mergers with backward recombination splits; local trees are its position-specific projections. The neutral two-locus construction is developed in Hudson's two-locus model.
Five consequences of the ancestral recombination graph are:
- Linkage disequilibrium and its distance dependence. Nearby sites often inherit the same local genealogy, so mutations on their shared ancestral branches produce correlated alleles. The chance of an ancestral breakpoint between sites increases with their genetic distance, reducing shared genealogy and, on average, linkage disequilibrium. This gives the genealogical explanation of the two-locus decay calculation.
- Haplotype blocks and recombination hotspots. With a varying recombination map, the ARG has relatively few breakpoints within low-recombination regions and many near recombination hotspots. Long intervals can consequently retain a small number of common ancestral haplotypes, while genealogical relationships change more frequently across the intervening regions. This explains why LD blocks are heterogeneous rather than equally spaced units.
- Mosaic inheritance and shared ancestral tracts. Backward splits assign different pieces of one contemporary chromosome to different ancestral chromosomes. Two sampled chromosomes can therefore share a recent ancestor over one interval but not its neighbors. For a specified total of independent ancestral meioses, a tract of genetic length has approximately expected crossovers under a Poisson crossover model, so its probability of remaining intact is . This relates long IBD segments to recent common ancestry, while distinguishing tract-boundary sampling from length-biased sampling at a random genomic point.
- Incompatible site patterns and four observed gametes. Under an infinite sites mutation model on a single rooted tree, the descendant sets of two mutations are nested or disjoint. They cannot cross, so all four haplotypes cannot occur. Recombination permits different local trees: one site's derived clade can be and the other's , producing all four without repeated mutation. The four-gamete test therefore detects a failure of the unrecombined, single-mutation-per-site model. Recurrent mutation would be an alternative explanation if the infinite-sites assumption were dropped.
- Variation in local diversity and allele frequencies. Coalescent mergers describe genetic drift; their random times produce different branch lengths and descendant-group sizes. Recombination makes these genealogies vary along the chromosome. Conditional on a local genealogy, its segregating site count is Poisson with mean , so a longer tree tends to contain more variants. A mutation on a branch subtending of the samples appears at sample frequency . Together, random branch lengths, descendant counts and mutations explain heterogeneous local diversity and the distribution of allele frequencies without requiring selection.
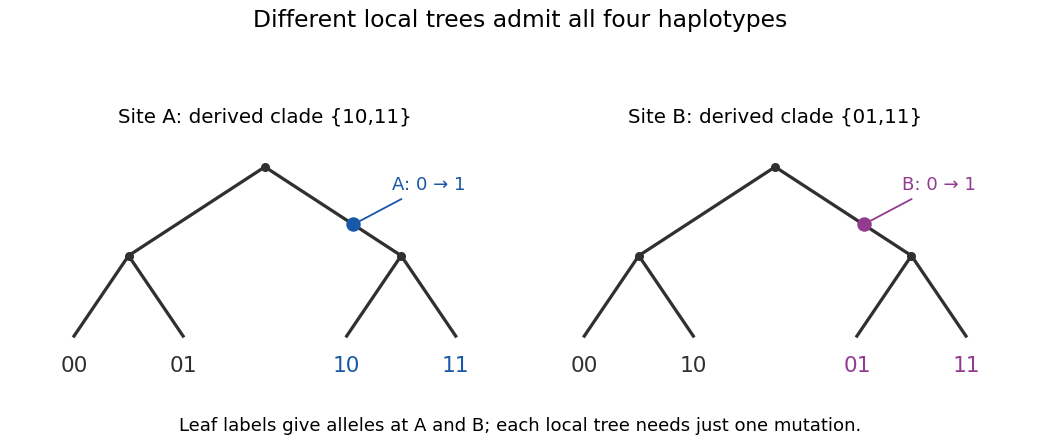
Different local genealogies can generate all four haplotypes with one mutation per site
. Details. 
Shared ancestry explains correlation; recombination makes ancestry a mosaic; mutation on the resulting branches converts genealogy into observed variation. These explanations use the neutral ARG, with a variable recombination map where stated. Selection, population subdivision or changing population size can also be studied genealogically, but require extending the event model rather than being consequences of the constant-size panmictic neutral process alone.
Articles by others on the same topic
There are currently no matching articles.