The cover dates this Part C paper to 18 June 2019; the public bundle filename says 2018. Numerical spectral readings below are estimates from the original plotted curves.
Let be the specific specific gas constants and the specific heat capacities of the noncondensible gas and vapour. Write for the saturation vapor pressure, for vapour mass per unit dry-gas mass, and . For a dilute ideal gas mixture,The second equation is the Clausius-Clapeyron equation, neglecting condensed-phase volume and taking constant latent heat . The first law of thermodynamics for saturated ascent, with condensate removed and negligible condensate heat capacity, is to leading orderSince , the resulting moist adiabat has logarithmic slopeConsequently a sufficient dry adiabat criterion isThe first two conditions justify neglecting the vapour's effects on the gas law and sensible heat capacity; the last two suppress latent heating. With and , the latent conditions are and . Usually , so the squared-latent term gives the stronger condition. At sufficiently low surface temperature, the exponential smallness of makes these conditions hold andThese are local conditions along the column. They can be checked at the surface when : on this dry profile the strongest latent parameter is proportional to and decreases upwards. Without that restriction a surface-only test need not bound every altitude. If suspended condensate is retained, its own heat capacity and loading must also be negligible; saturation alone does not specify those quantities.
Interpret the requested mass path as the vapour column; no condensed-water loading is prescribed. Hydrostatic equilibrium gives , so if is vapour mass fraction,For the mixture . Under the dilute conditions of part (a), . Introduce , so and . Integrating the constant- Clausius-Clapeyron equation relative to the surface givesThereforeThe explicit cancels: decreasing vapour mass fraction in a denser dry column compensates its greater total mass. This cancellation belongs to the dilute, dry-adiabatic approximation, and is not a general property of moist atmospheres. With suspended condensate, an additional and unspecified condensate mass path would have to be added.
For ordinary condensibles, is typically of order ten or more near low atmospheric temperatures. At the approximate triple-point temperatures, the supplied substances give about for water and – for carbon dioxide, methane and nitrogen. This is consistent with the supplied large ratios of latent heat to sensible heating: for molecular gases is only a few. The relevant is typically a few tenths.
The integral is concentrated where . There , so givesThis is an Laplace's method, rather than an assumption that vapour is uniformly mixed. The effective contributing depth in log-pressure is , explaining why the near-surface atmosphere dominates.
An exact representation within the same dilute model makes the error explicit. Set and define the exponential integral . ThenThe saturated vapor column on a dry adiabat estimate overstates the exact dilute-model column by roughly , about five to ten per cent for those illustrative values. It is not accurate for a warm, nondilute steam atmosphere.
Take as the integrated line mass absorption coefficient, and as the absorber mass fraction, assumed constant; for a pure absorbing gas set . All spectral intervals below use the paper's wavenumber coordinate. The normalized Lorentz line shape isIf instead an absorption coefficient per length is wanted, multiply by absorber density. Neglecting temperature dependence, pressure broadening gives . In the line wings, with ,Define the line-opacity parameter and characteristic wavenumber widthAt an emitting level , the wing estimate implies . Thus the strong-line limit relevant to outgoing radiation isIt ensures that the opaque-to-transparent transition lies in the Lorentz wings, rather than the narrow central core, and the characteristic absorption width is much larger than . At a grazing ray angle the criterion is even easier to satisfy because of the larger optical depth. This is a criterion for the radiatively important wings, not a claim that collision broadening remains physical at arbitrarily small pressure.
For a vertical ray, the transmittance from to space is . Direct integration of the full pressure-dependent Lorentz line shape gives, for ,The exact Lorentz-model transmittance and its strong-line limit are thereforeThe approximation is justified at the radiating level by . At zenith-angle cosine , replace by ; if a hemispheric flux transmission is desired, its normalized value is . The pure Lorentz model formally gives infinite line-centre optical depth from every nonzero to , because . This is an unphysical central-core singularity, addressed in part (d), rather than a divergence of the integrated outgoing flux.
For a vertical ray, the formal Schwarzschild equation solution isIn the wing model , the contribution per interval is proportional to when the source varies slowly, and is concentrated near . This motivateslimited to in transparent spectral regions. Rays contributing to the hemispheric flux replace this by , an order-one angular refinement.
For , put and . With the vertical optical-depth-one estimate, the spectral outgoing longwave radiation is approximatelyThe cold flat central portion comes from the isothermal stratosphere; intermediate wings sample progressively warmer, deeper tropospheric levels; far outside the line the warm surface is seen. The transitions are smooth in the exact transfer solution. If , the entire column and ground are isothermal and there is no line contrast. If , the given max-profile has no cooler troposphere: the atmosphere can instead produce an emission feature above the colder surface background. Assuming a narrow isolated line permits the local Planck function background to be treated as nearly constant across its width. The original schematic below also compares the optical-depth-one estimate with angular and source-function integration for illustrative, explicitly chosen parameters.
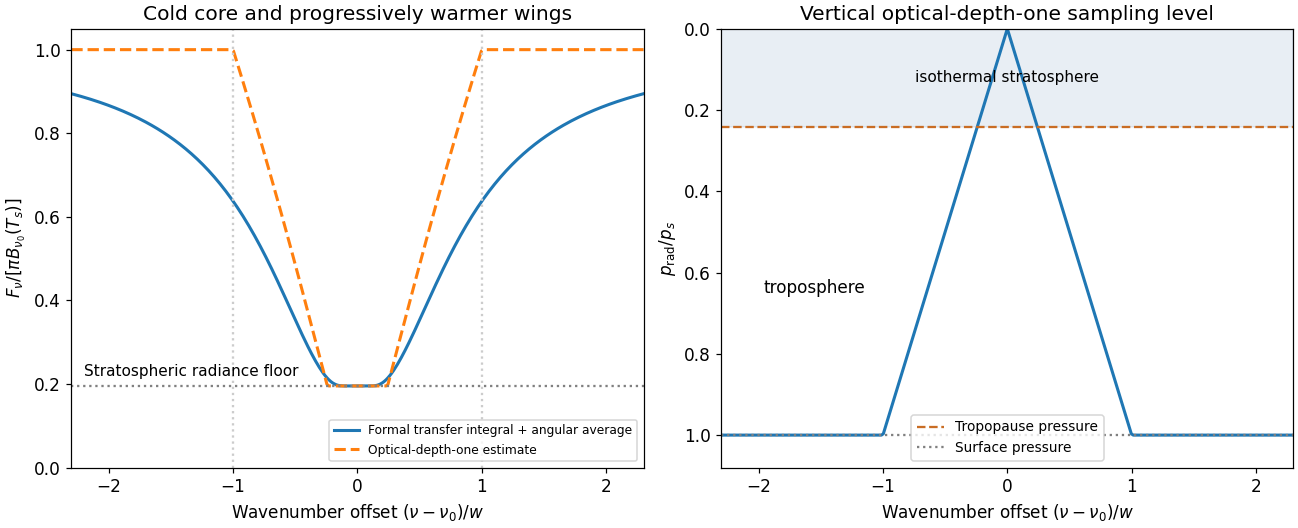
An isolated absorption line samples an isothermal stratosphere, a warmer troposphere and the surface
. Illustrative narrow-line model with , , and line centre ; horizontal offsets are normalized by . No measured spectrum is reproduced. Details.
Pressure broadening is proportional to collision frequency and therefore becomes small in the upper atmosphere. Doppler broadening remains finite at finite temperature, with a characteristic width of order up to the stated width convention. Where that exceeds the collisional width, the line core is Doppler dominated. A Voigt profile combines the two mechanisms; natural broadening can contribute at still lower pressures. Thus a Lorentz pressure-broadened profile cannot hold all the way to .
At line centre, replacing the fictitious opacity by a finite Doppler-core coefficient removes the divergent column optical depth. The emitting pressure is then finite rather than arbitrarily close to zero. If that level still lies in the isothermal stratosphere and the core is opaque, the central brightness temperature stays approximately , so the flux floor changes little. If it lies below the stratosphere, or the Doppler-core column becomes thin, warmer layers or the surface contribute and the core brightens. The core-to-wing transition changes shape and width, but Lorentz wings formed mainly at higher pressures remain approximately as in part (c). The size of the correction needs the missing spectroscopic widths, but no unique numerical correction is requested.
Assume an ideal gas dominated by carbon dioxide, constant mean molar heat capacity , and a dry convective adiabat connecting the stated emitting layer to the ground. Conservation of entropy gives , where is the universal molar gas constant. ThusThe estimate extrapolates across a pressure ratio of . It neglects radiatively stable layers, variable heat capacity, departures from an ideal gas and changes in composition; these approximations limit its accuracy. A brightness temperature observed from space cannot generally be equated to a unique material level, but this calculation uses the layer interpretation explicitly supplied by the question.
For a non-scattering atmosphere above a blackbody surface, the difference between the two curves is the transmitted surface term . The atmospheric-only curve is an integral of local thermal emission weighted by transmission to space. Molecular absorption blocks some wavelengths and permits narrow windows at others. In a transparent window, adding the hot surface substantially increases the emerging radiance; in an opaque interval, the two curves nearly coincide because the surface contribution is extinguished.
The original graph shows the clearest surface-dominated window around –, with the blue curve near at its maximum and the atmospheric-only contribution small. Weaker possibilities are around – and near , with less available signal. The – peak contains a measurable surface contribution but a larger atmospheric background. The near-equality around – makes that peak a poor surface thermometer despite its appreciable total radiance. These are approximate readings, not precisely tabulated band edges.
At , the Wien displacement law puts the thermal wavelength peak near . A window is still in the Wien approximation regime, but its radiance is exponentially larger than for an Earth-like or colder Martian surface. For example, at the Planck function ratio is of order . A modest hot-spot temperature increase likewise gives a relatively large fractional radiance change. Inverting this signal for surface temperature requires an atmospheric transmission and emission model, not just identifying a peak.
Assume a circular orbit, nadir viewing, negligible planetary rotation and a fixed camera relative to the orbital ground track. If is the planet's radius and the orbital altitude, the orbital angular speed isThe nadir footprint moves across the surface at , rather than the slightly larger satellite speed . HenceThis is an upper integration time for approximately one along-track sample without motion compensation. Using satellite speed directly changes it by only about four per cent; the expression above keeps the projection onto the planetary surface.
The etendue is the area–solid-angle acceptance of a ray bundle, more generally . In an ideal lossless optical system it is conserved. Increasing pupil area increases accepted power only together with the appropriate field and detector cone; passive optics cannot arbitrarily increase radiance. For a small nadir pixel here, denotes entrance-pupil area times the solid angle of its surface footprint.
Choose – within the surface-sensitive window. A representative band-mean total radiance read from the original blue curve is , uncertain at roughly the tens-of-per-cent level. Its band integral isThe provided SNR formula depends on only through this band integral. If is wavenumber, the selected band spans about and ; numerical radiance densities in the two coordinates must not be mixed. Convert the specific detectivity to SI: and . Using the footprint dwell time from part (c),A square footprint at altitude subtends . Thus the collecting area and circular aperture diameter areThe Rayleigh criterion independently requires only at , so the noise requirement dominates diffraction. The detector size corresponds to focal length about for this pixel field. This assumes one detector footprint per stated feature size; stricter spatial sampling would need smaller footprints and a revised photon budget.
The estimate assumes a clear, non-scattering atmosphere as in the graph, a night-side or otherwise isolated thermal signal, negligible extra stray-light and read-noise penalties beyond the supplied detectivity, and transmission for the instrument alone. Atmospheric attenuation is already included in the plotted incoming radiance. The selected band has little atmospheric-only signal, but actual hot-spot detection concerns contrast relative to the background: SNR on total radiance is not a guarantee for an arbitrarily small temperature anomaly. An illustrative radiance range – in the plotted units would give diameters about –.
The first term describes collision-coalescence: a collector sweeps area , overtakes small droplets at relative terminal speed , encounters liquid mass per volume , and retains a fraction of that intercepted liquid. The second term describes diffusion-limited condensational growth, with vapour supersaturation and combined thermal and vapour-diffusion resistances . Condensation is positive for and reverses to evaporation for . The liquid-water content here is a local mass-per-volume quantity, not a vertically integrated liquid-water path.
For an initially monodisperse cloud the relative settling speed vanishes, so there is no gravitational collection term in this model. Set and use . Condensational growth givesTaking upward height from cloud base as positive, the droplet speed relative to the ground is the updraft minus its downward terminal velocity:For a launch at ,This assumes the prescribed uniform updraft and supersaturation persist along the trajectory, and that the Stokes-type radius-squared fall law remains applicable.
Neglecting , the no-settling trajectory is , while the settling trajectory is a downward-curving parabola, . For the given coefficients . At ,The radius is then , with terminal speed , still much less than the updraft. Such droplets are carried almost to cloud top rather than falling as rain. Condensation alone would take about to reach , much longer than the approximately cloud transit time. It also reduces relative radius differences because grows at the same rate for every droplet, leaving inefficient differential gravitational collection. This is the warm-rain growth bottleneck, not a claim that condensation is absent.
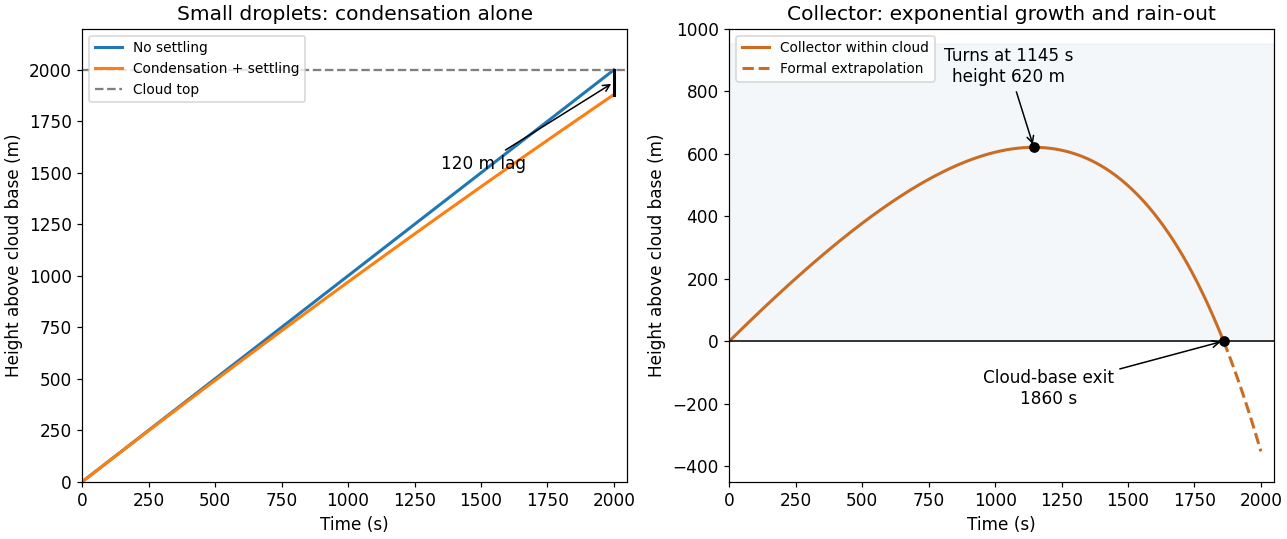
Condensational droplets rise through the cloud while rapidly collecting drops can turn and precipitate
. Trajectories calculated from the two growth models in question 4; the collector curve is solid only while the drop remains within the cloud. The dashed extension below cloud base is a formal extrapolation. Details.
Neglect condensation and the smaller droplets' fall speed, while retaining their specified liquid-water content. For exponential cloud collector growth, the collection law and spherical collector mass giveThus . The growing terminal speed eventually exceeds the updraft, andwhere the last expression uses in seconds and . Numerically,The trajectory reaches maximum height when , at , and . It returns to cloud base near , with radius about . The left-to-right sketch in the preceding figure shows this rise and subsequent fall.
Once the drop leaves the cloud, the prescribed in-cloud , and collection law need not persist. Consequently the negative -second value describes the requested constant-coefficient model's extension, not a prediction that collection continues below cloud base. Its actual subsequent height needs an outside-cloud model. Within the cloud, the exponential feedback between increasing radius and increasing swept volume explains how a minority of collector drops can escape the condensation bottleneck and initiate warm rain; depletion, breakup and changes in fall law eventually limit indefinite exponential growth.
A broad initial cloud-droplet size distribution can be seeded by giant or unusually soluble cloud condensation nuclei, producing a minority of larger droplets before gravitational collection becomes efficient. Variable supersaturation histories, entrainment and mixing can broaden the distribution relative to a perfectly homogeneous monodisperse model. Turbulent relative motion and preferential concentration can increase encounters, and rare successful collisions can create unusually rapid stochastic collectors. These mechanisms can work together; a single deterministic condensational law applied equally to identical droplets cannot create the initial differential fall speeds by itself. For warm rain, the subsequent amplification is liquid collision-coalescence, distinct from ice-phase precipitation mechanisms.
In the horizontal rotating-fluid equation of motion, scale advective acceleration as and Coriolis acceleration as , where . Their ratio is the Rossby number,A small Rossby number means that rotation strongly constrains the flow; with slow evolution, weak friction and a suitable pressure field it permits geostrophic balance. Local time dependence introduces the separate condition . A synoptic midlatitude cyclone with , and has . A tornado with and has ; its rotational motion does not mean that the Earth's rotation dominates its local dynamics.
The vertical relative vorticity is , while planetary vorticity is . Thus is of the order of the Rossby number, although it is not an identity for arbitrary velocity fields: an irrotational strain can have nonzero but zero . Absolute vorticity is .
On large, slowly evolving midlatitude scales, the horizontal pressure gradient force is mainly balanced by the Coriolis force, which is perpendicular to velocity. Consequently the wind is nearly parallel to atmospheric isobars, rather than accelerating directly into a low or out of a high. Curvature adds a gradient wind correction, and surface friction permits the cross-isobar component considered in part (d).
The internal Rossby deformation radius compares gravity-wave adjustment with rotational turning:Use for a positive length; the signed expression in the question denotes the same scale. The atmosphere has a deep troposphere and much larger internal gravity-wave speed, typically tens of metres per second. For example gives at . Atmospheric weather systems can span several such radii.
Oceanic density contrasts are small relative to the full density, so reduced gravity is small and the active stratified layer is shallower. Taking and gives and . Thus an atmospheric cyclone normally has a longer horizontal scale than a midlatitude ocean eddy. The ocean's external free-surface wave speed is not the relevant internal scale for a baroclinic eddy.
For a hydrostatic Boussinesq approximation, introduce reduced pressure and buoyancy . The geostrophic balance and perturbation hydrostatic balance equations areCommuting the mixed derivatives gives the height-coordinate thermal wind relationsEquivalently and . In an atmosphere the corresponding ideal-gas form is conveniently derived from geopotential on pressure surfaces: , , and . HenceSince , this gives the vertical shear at a fixed horizontal location,The horizontal temperature derivatives here are on isobars; replacing them by fixed-height derivatives is a small-slope approximation. This qualification avoids mixing compressible and Boussinesq density gradients.
For an illustrative poleward temperature drop across , mean , and depth ,Adding a modest surface wind gives an upper-level westerly jet of order –. The thermal wind fixes vertical shear, not the absolute wind without a boundary or reference value.
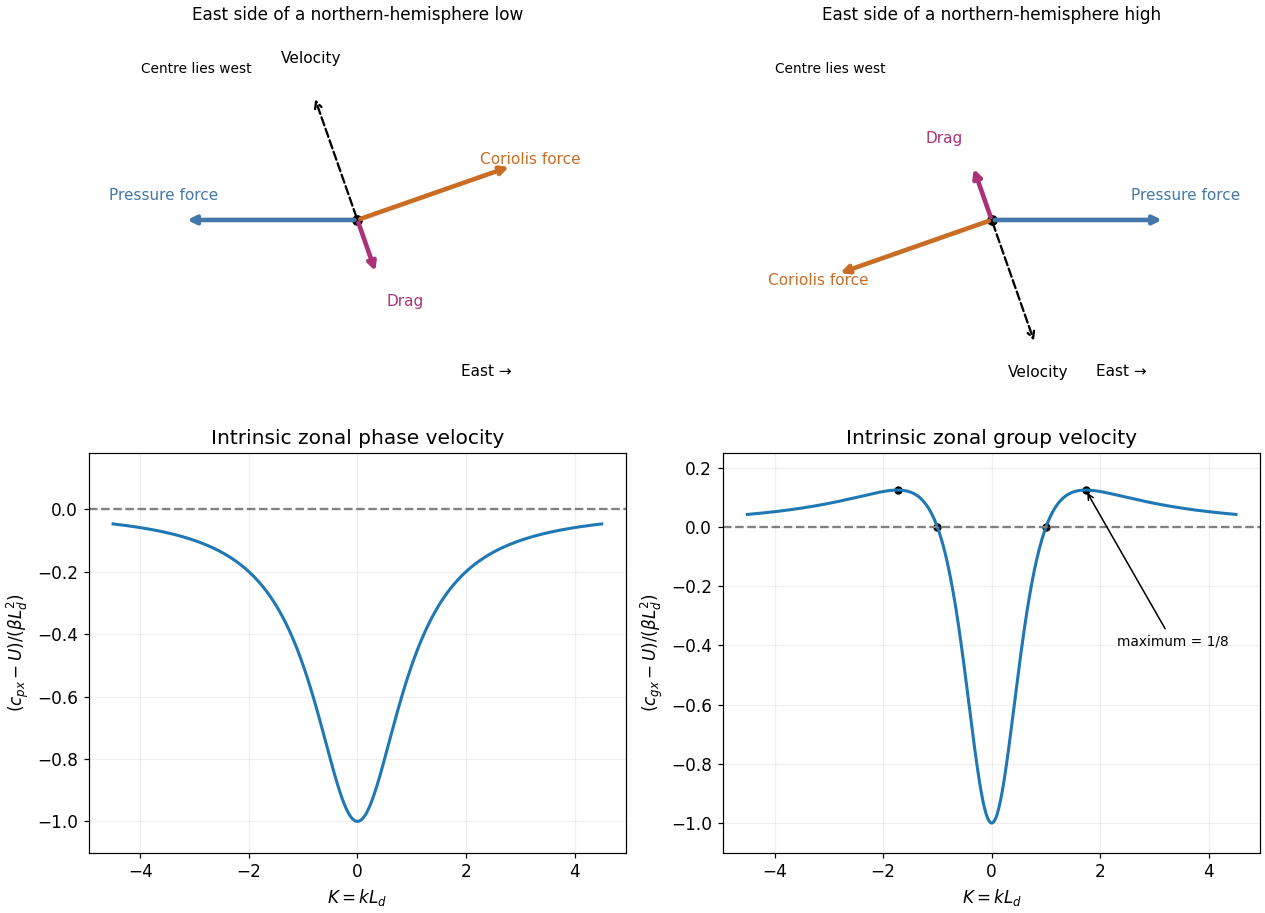
Approximate the surface layer as locally steady with small horizontal advective acceleration. Write and . Since , the drag-modified force balance can be inverted exactly:The geostrophic wind is , so the ageostrophic flow isIts cross-isobar component is , always towards lower pressure, in either hemisphere. Thus the surface wind spirals into a cyclone and out of an anticyclone. In the northern hemisphere, the nearly tangential circulation is counterclockwise around the low and clockwise around the high; those rotations reverse in the southern hemisphere. The original force diagrams below show pressure, drag and Coriolis force closing to zero at the east side of each system.
Surface convergence into a low requires upward motion out of the friction layer by the continuity equation; divergence from a high requires subsidence. In unsaturated adiabatic motion the rising parcel expands and cools, while descending air compresses and warms. The relevant warming or cooling relative to its surroundings depends on the environmental stratification, and latent heating can modify the ascending-air result.
For otherwise unsupported weather systems this is quasi-geostrophic Ekman spin-down: drag dissipates kinetic energy, convergence tends to fill a low and divergence tends to erode a high. In a simple column with upward velocity at its base and negligible vertical velocity aloft, cyclonic vorticity decreases because ; the opposite sign weakens anticyclonic vorticity. Cooling beneath a fixed upper-level pressure also tends to raise the surface pressure through the hydrostatic column, while warming tends to lower it. Real baroclinic development, upper-level mass transport and condensation can sustain or deepen a cyclone despite surface friction, so temperature changes alone do not prove a universal decay rate.

The underlying principle is material conservation of potential vorticity for adiabatic, inviscid, rotating, stably stratified motion. In the quasi-geostrophic approximation, the leading horizontal velocity is nondivergent and geostrophic:Here is the reference Coriolis parameter, on a spherical planet, and . The positive buoyancy frequency squared is ; in a Boussinesq fluid it is . To quasi-geostrophic order the potential vorticity is the background plus the stated perturbation .
Linearizing its material derivative about uniform zonal velocity giveswhich is the supplied equation. The uniform basic flow contributes no relative-vorticity gradient or vertical shear term.
The approximation needs small Rossby number, time scales long compared with , vertical hydrostatic balance, stable stratification, small departures from the reference state and meridional extent small enough for a local beta plane. Buoyancy and rotation must balance at the relevant aspect ratio. Friction, diabatic heating and strong nonlinear advection are neglected here. It applies to balanced midlatitude ocean and atmospheric motions; an atmospheric version also requires a consistent reference-density or pressure-coordinate treatment. It fails in a sufficiently near-equatorial region where vanishes.
The quasi-geostrophic potential vorticity perturbation combines relative vorticity, , with the stretching contribution . The latter measures how buoyancy surfaces and rotating fluid columns are displaced in a stratified fluid. Even a flow with no vertical dependence can have nonzero relative vorticity, while its explicit stretching term vanishes.
For a vertically uniform plane wave with horizontal wavenumbers , . Substitution givesThus phase propagates westward relative to the current. Physically, northward parcel displacement carries lower background planetary vorticity into a region with larger , requiring negative relative vorticity to conserve total potential vorticity; southward displacement requires positive relative vorticity. The velocity induced by that vorticity pattern shifts the displacement wave westward. This is a statement about phase motion, not a claim that every Rossby-wave packet has westward group velocity.
For constant , substitution of the vertical cosine and horizontal plane wave givesThe top rigid-lid condition is satisfied by . To select a discrete vertical mode one must also impose the corresponding no-flow, adiabatic condition at the flat bottom, . It requires . The mode is barotropic; the gravest nonzero baroclinic mode has . HenceThe lid condition alone is insufficient: also has zero derivative at the lid but violates the bottom condition. Constant depth motivates the additional physical boundary, which must be used to obtain the printed denominator.
Let and set . The zonal phase velocity and group velocity areThe phase curve is even in , with limiting value at zero and approach to from below at large . The group curve is also even: it starts at the same long-wave limit, equals at , reaches at , and approaches from above at large . The normalized curves appear in the bottom panels of the preceding figure. For , the phase speed means the limit ; there is no zonal crest propagation to define directly at exactly zero wavenumber.
Use the standard Earth radius and rotation rate . At S,Take a predominantly zonal wave train, , and the gravest baroclinic mode from part (c). ThenThe background current is westward, so . The pulse uses the baroclinic Rossby-wave group velocity, not the crest speed:ThereforeFor comparison would give about years, but that is a crest transit time and not the requested pulse delay.
The approximately three-year group delay is comparable to the stated three-to-five-year El Niño–Southern Oscillation period. Wind-driven thermocline disturbances can store and convey oceanic adjustment westward; interaction with the western boundary and subsequent faster signals can contribute a delayed feedback on the tropical coupled system. This calculation supports a relevant time scale, not a complete ENSO oscillator: realistic meridional structure, variable stratification and currents, damping, boundary conversion and equatorial coupling are omitted. A nonzero unspecified meridional wavenumber would also change the numerical group speed, so the assumption is material.
Articles by others on the same topic
There are currently no matching articles.