X-ray emission spectroscopy studies the frequency spectrum of emitted X-rays. The spectral line positions identify electronic energy differences; their strengths also depend on excitation, photon absorption inside the sample, geometry and detector response. An X-ray tube may excite a sample with Electrons, while X-ray fluorescence uses incident photons. The distinction matters when choosing what the experiment measures: identifying a chemical element from a line position is different from determining its abundance from a line strength.
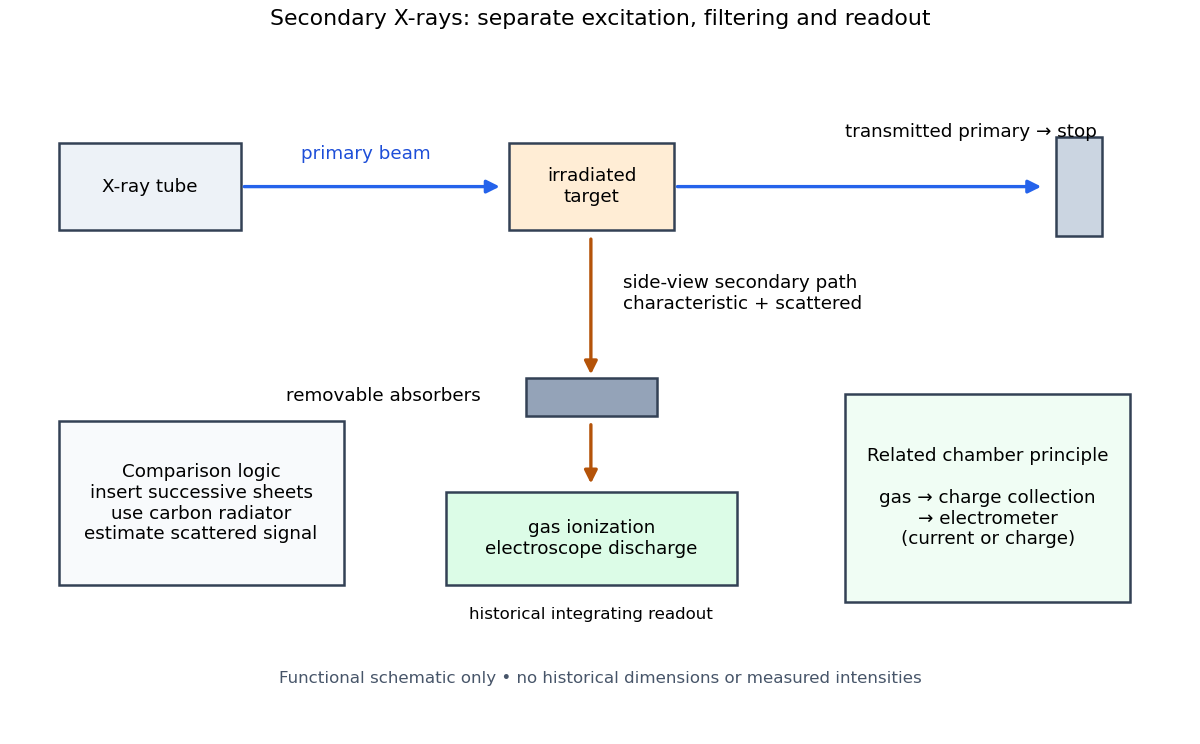
Charles Glover Barkla's 1911 paper describes irradiating a target with an X-ray tube and observing secondary X-rays using an electroscope. For soft Characteristic X-rays from tin, he used a soft primary beam and placed the electroscope close to the target to limit loss in air. Successive aluminium absorbers changed the gas-ionization signal. Thick absorbers suppressed the soft component; a carbon radiator supplied a comparison for the surviving scattered component. Subtracting this estimated contribution left approximately equal fractional losses through successive sheets, evidence for a nearly homogeneous component. Changing primary-beam hardness could suppress excitation of the more penetrating characteristic component.[ref]
The Spectra of the Fluorescent Röntgen Radiations by Charles Glover Barkla. Barkla, The spectra of the fluorescent Röntgen radiations (1911), p. 396: soft tube, nearby electroscope, aluminium sheets, carbon comparison and subtraction
An electroscope reads loss of stored electric charge; ionization in its detecting gas enables discharge. An ionization chamber with an electrometer instead measures the collected electric charge or electric current. These are integrating readouts: neither directly assigns an energy to each arriving photon. The diagram separates these functions without claiming a surviving apparatus drawing.
The K and L components were distinguished by their penetrating power and dependence on the emitting chemical element. Barkla's Nobel lecture, delivered on 3 June 1920 for the 1917 prize, explains that absorber-defined K radiation had seemed homogeneous, whereas later diffraction experiments resolved neighbouring spectral lines in both K and L groups. Absorber tests therefore distinguished groups without resolving every line.[ref]
Characteristic Röntgen Radiation by Charles Glover Barkla. Nobel Lectures, Physics 1901–1921; Barkla, Characteristic Röntgen radiation, printed pp. 392 and 395, PDF pp. 132 and 135: lecture date and limitations of absorption analysis
Henry Gwyn Jeffreys Moseley subsequently related the frequencies of corresponding spectral lines to atomic number. The approximate relation , with series-dependent constants , is Moseley's law; its discovery should be distinguished from Barkla's identification of characteristic secondary radiation.[ref]
Moseley and X Rays by University of Oxford Department of Physics. University of Oxford Department of Physics, Moseley and X rays: Moseley's graph and the story of Moseley and X-rays
A continuous incident frequency spectrum can contribute a continuous scattered background alongside discrete Characteristic X-rays. Here “scattered” identifies a production process, not a universal spectral shape: scattering of a narrow incident line need not make a continuum. In particular, the characteristic component is photon emission after vacancy creation, rather than simply the primary beam redirected. Source hardness, target substitution and absorber thickness probe different parts of that distinction. A surviving signal alone establishes neither an additional electron shell nor a fully resolved spectral line.
Precision X-ray emission spectroscopy turns closely spaced spectral lines into quantitative constraints on atomic energy levels. Bragg's law makes a crystal an angular ruler for wavelength: resolving nearby directions can reveal components hidden inside an apparently single line. Accurate line positions and the ability to separate two lines are related, but distinct, experimental achievements.
Karl Manne Georg Siegbahn received the 1924 Nobel Prize in Physics; his lecture was delivered on 11 December 1925.[ref]
The X-ray Spectra and the Structure of the Atoms by Karl Manne Georg Siegbahn. Nobel Lectures, Physics 1922–1941; The X-ray Spectra and the Structure of the Atoms, heading, printed p. 81
His son Kai Siegbahn received the 1981 Nobel Prize in Physics for electron spectroscopy.[ref]
Facts on the Nobel Prize in Physics by Nobel Prize Outreach. Family Nobel Prize laureates in physics, Father and son: Manne and Kai Siegbahn
The Barkla characteristic X-ray experiment distinguished element-dependent K and L groups through absorption and excitation. Moseley's law related corresponding line frequencies across chemical elements to atomic number. Measuring the components within those groups asks a further question: which distinct atomic energy differences produce the neighbouring spectral lines?
Siegbahn's lecture organizes measured spectral lines into energy levels and resolved double levels.[ref]
The X-ray Spectra and the Structure of the Atoms by Karl Manne Georg Siegbahn. Nobel Lectures, Physics 1922–1941; Printed pp. 84–86, Figs. 1–2
The payoff is a map of atomic energy differences as well as an element's position in the periodic table.A crystal X-ray spectrometer selects a narrow wavelength interval by diffraction at known interplanar spacing and Bragg angle . For fixed diffraction order , a known lets an angular measurement determine . This reverses the crystallography problem of finding from a known wavelength.
Siegbahn's laboratory developed X-ray tubes and evacuated spectrographs for longer wavelengths. Rotating the crystal selected reflections; photographic plates recorded positions. Opposite-side exposures measured angles on both sides of the direct beam. Later tube instruments mounted a beam-defining slit opposite the plate holder. A separate double instrument compared two reflected beams with two ionization chambers. These were different instruments, not one universal assembly.[ref]
Manne Siegbahn, His Research by Hugo Atterling. Hugo Atterling, Manne Siegbahn: Development of precision spectroscopy; Work at Uppsala 1923–1927
The Nobel biography describes constant-temperature spectrographs and a precision angular scale read by diametrically opposed microscopes.[ref]
Manne Siegbahn - Biographical. Nobel Lectures, Physics 1922–1941; Biographical, paragraph beginning As a measure of the high precision; inspected collected volume pp. 90–91
Temperature control matters because thermal expansion changes ; an accurately read angle cannot compensate for an unknown interplanar spacing.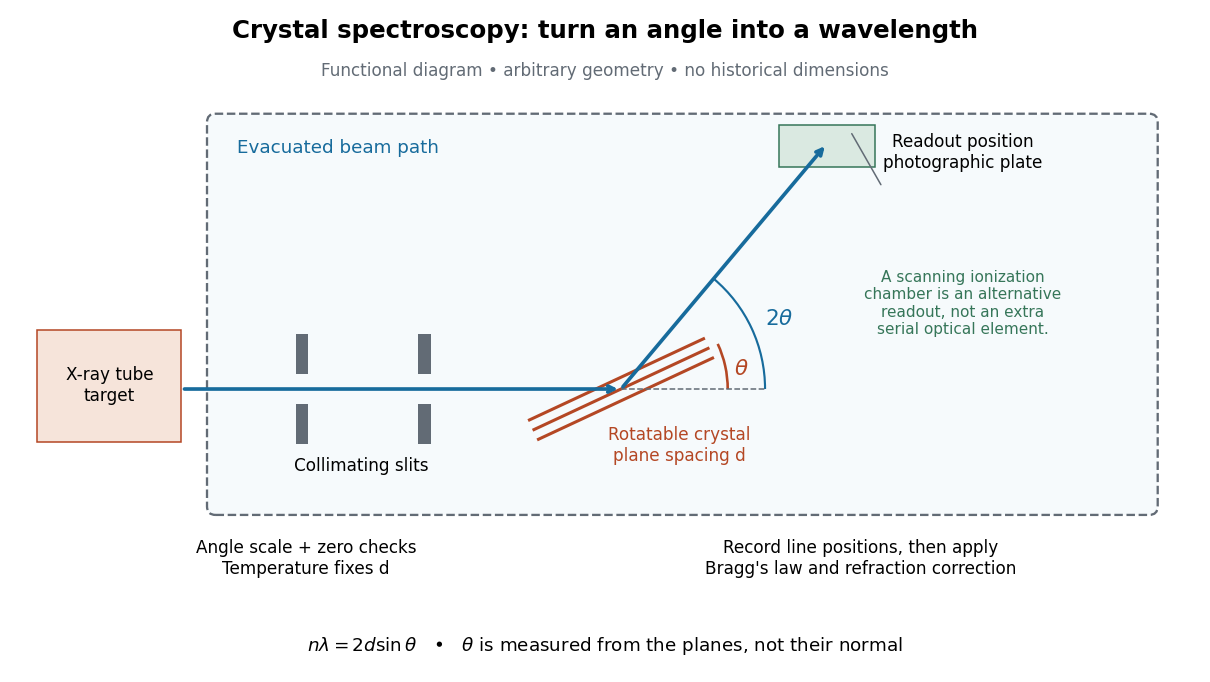
The schematic separates preparation, selection and readout. An X-ray tube target supplies Characteristic X-rays with a possible bremsstrahlung background. A collimator limits incident directions; evacuation reduces air X-ray attenuation. Rotating the crystal brings different wavelengths into reflection. A photographic plate stores line positions over an exposure, whereas an ionization chamber can measure collected electric charge at successive angles. Neither readout alone establishes absolute wavelength: an angular zero, angular-scale calibration, diffraction order, and any required refraction correction enter the inference. Narrower slits reduce accepted angular spread but also reduce signal; a weak line can become harder to locate despite a narrower instrumental response.
A control reported in Siegbahn's lecture photographed a line system with copper-sulphate and calcium-sulphate crystals. Irregular relative shifts around copper's characteristic frequency supported anomalous dispersion; the arrangement excluded differing absorption across that frequency as the explanation.[ref]
The X-ray Spectra and the Structure of the Atoms by Karl Manne Georg Siegbahn. Nobel Lectures, Physics 1922–1941; Printed pp. 88–89, final experiment
A finer angular scale alone cannot remove this physical refraction correction.Differentiate Bragg's law at fixed correctly assigned diffraction order:Divide the second equality by the first. For small signed changes,The Bragg angle error must be in radians. An error quoted for detector deflection must first be halved. The expression is a first-order Taylor expansion; an unknown diffraction order is a discrete assignment error, not an infinitesimal perturbation.
For error bounds, add magnitudes. For independent zero-mean random errors with standard deviations , variance addition instead givesCorrelated errors require a covariance term. A shared calibration bias does not become independent merely because many line positions are measured.
With a chosen angular error arcseconds, , the angular contribution is at and at . Larger Bragg angles reduce this contribution because decreases. For a nearby spectral doublet, the inverse relation is : a fixed fractional separation spreads farther apart angularly at large Bragg angle.
This does not permit unlimited improvement. The geometry requires ; a desired wavelength might not have an accessible large-angle reflection with the chosen crystal. Higher diffraction orders can reach larger Bragg angles but their strengths depend on the crystal lattice structure factor. Finite crystal response, slit widths and source size remain relevant. An error in , including uncorrected thermal expansion, remains even when the angular term is small. Very near , the leading angular derivative vanishes and the second-order Taylor expansion matters.
For two lines measured with the same interplanar spacing at the same temperature, division of Bragg's law givesThe common cancels. Consequently a precise wavelength ratio can coexist with an uncertain conversion to SI length. In contrast, angular calibration errors generally survive: a shared small zero offset changes the inferred ratio fractionally by approximately . Nearby lines partially cancel this effect, but widely separated angles need not. Different crystals, temperatures or refraction corrections also prevent unqualified cancellation.
The historical X unit was a practical X-ray wavelength unit, approximately . Its scale used an assigned calcite spacing; relative wavelength measurements could be more precise than absolute determinations. Variation between crystal specimens led to calibration using reference spectral lines. An X unit value therefore cannot simply be read as an exact multiple of .[ref]
Nomenclature System for X-ray Spectroscopy prepared by R. Jenkins and others. IUPAC, Nomenclature system for X-ray spectroscopy, §5.1 Units, printed p. 745
An angular-scale check determines how an indicated rotation corresponds to an angle. A reference line transfers a wavelength scale. An absolute determination ties that scale to an independently established length standard. These are different calibration tasks. Repeating measurements can reduce random scatter without correcting the common scale: if every inferred is too large by a chosen , all inferred absolute wavelengths are too large by , while ratios using that same are unchanged.
A spectral doublet comprises two neighbouring spectral lines. Resolving it requires information about the line response, relative strengths and noise, not only precision in reading an angle. Choose two equal angular responses shaped as Gaussian functions with common standard deviation and separation . If is angular displacement from their midpoint, their summed signal isThese are assumed response shapes, not a measured Siegbahn frequency spectrum. By symmetry , andThe midpoint changes from a maximum to a minimum at . For this particular equal-width, equal-height model, two distinct maxima occur when . Each isolated Gaussian function has full width at half maximum ; the two-maxima threshold is therefore about times that width.
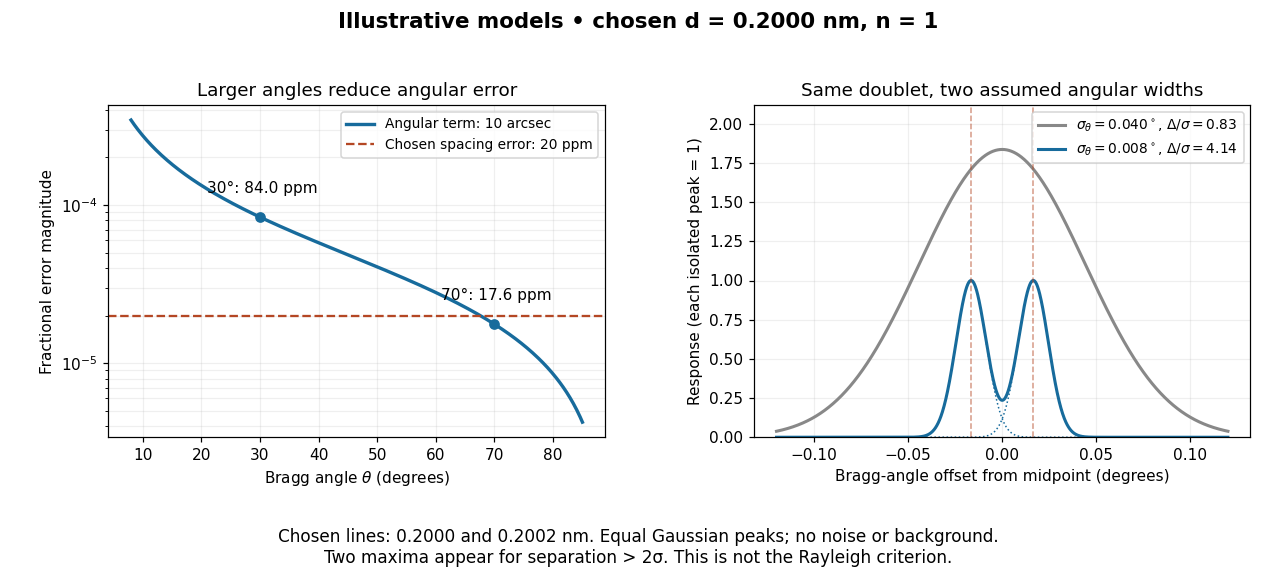
In this chosen model, the two Bragg angles are and . Their separation is times for , giving one maximum, and times for , giving two. Sharpening the response can reveal the doublet without changing either emitted wavelength.
The Rayleigh criterion uses a first-zero convention for specified diffraction patterns. A Gaussian function has no finite zero, so its two-maxima threshold is not the Rayleigh criterion. Neither convention is a universal inference limit: known response shapes and adequate signal-to-noise ratio can support estimating a separation before two visible maxima appear. Unequal strengths, background, finite sampling and uncertainty in the response can make that inference much harder. Measurement resolution, the precision of an isolated line's centre and absolute wavelength accuracy should therefore be reported separately.
For a fixed homogeneous absorber in a narrow-beam geometry, define the X-ray spectral attenuation operator on L1 space over a bounded positive energy interval. A physical input is an integrable function giving incident photon rate density. Let its linear attenuation coefficient be a measurable function, with . The transmitted uncollided density isHere is a fixed bounded detector response described by a measurable function; background has been subtracted. This is a positive linear operator on L1 space. Since , it cannot increase the integrated absolute incident rate. Multiplication of exponentials proves for successive layers of the same material. Ignore secondary radiation entering the detector, saturation and changes to the source. Discrete spectral lines use the finite-sum version below instead of an ordinary rate density.
For a chosen filter, stipulate , and input line rates in a common arbitrary rate unit. Assume equal calibrated detector weight for both lines. At ,The selected line's fraction rises from to , but its absolute rate falls by about . Filtering improves purity at the cost of signal. It multiplies existing components and cannot create a new emitted spectral line.
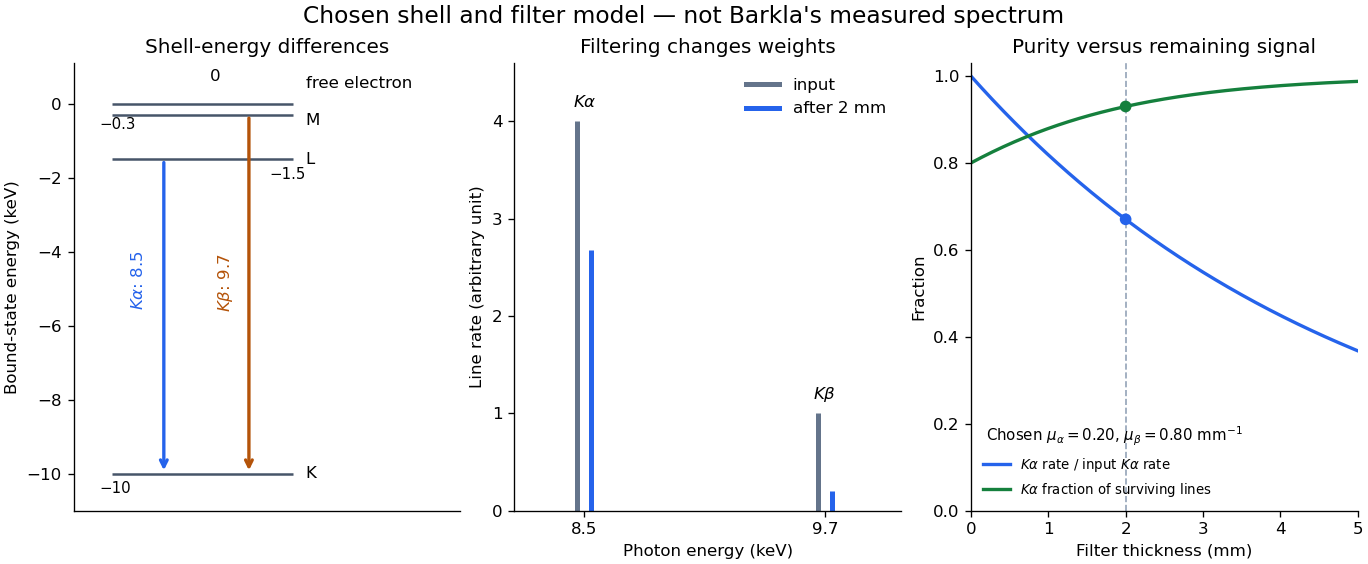
With just one integrated reading, , the two unknown line rates are underdetermined. If the source is unchanged between an empty-path reading and a filtered reading, the ideal inverse problem becomesThe determinant is nonzero, so these two ideal readings determine the two stipulated line rates uniquely. Identical coefficients would give zero determinant and destroy that separation. This small linear algebra example explains why absorber contrast supplies information, while also showing its limit: unknown scattered components or unknown detector weights add unknowns that two readings cannot determine.
Articles by others on the same topic



X-ray emission spectroscopy is a technique used to analyze the elemental composition of materials by measuring the X-rays emitted from a sample when it is excited by a source of X-rays or other high-energy radiation. This method provides information about the types and quantities of elements present in the sample. ### Key Principles: 1. **Excitation**: When a sample is irradiated with high-energy photons (such as X-rays), inner-shell electrons may be ejected from atoms in the sample.