Topics (384k) Articles (398k) Users (410) Discussions (242) Comments (383) Files (13k) New article

The coronary sulcus is the external groove around the heart at the boundary between its atria and ventricles. It provides a route for parts of the right coronary artery, circumflex artery, great cardiac vein and coronary sinus.[ref]
Anatomy and Physiology 2e by J. Gordon Betts and others. §19.1, External Anatomy and Coronary Circulation
An anatomical route can be reconstructed from connected landmarks: the great cardiac vein runs from the anterior interventricular sulcus into the coronary sulcus and toward the coronary sinus. The turn distinguishes a vessel following the atrial–ventricular boundary from one continuing toward the cardiac apex. This is useful when relating an anterior view to a posterior view of the same specimen.
The groove should not be treated as a rigid pipe carrying all of these vessels in one fixed order. In a primary dissection series, the great cardiac vein's relationship to the neighboring arteries differed among specimens.[ref]
The anatomy of the coronary sinus and its tributaries by J. R. Ortale and others. Abstract, relationships within the coronary sulcus
A diagram can therefore correctly show the main route while suppressing variation in crossings and spacing. The coronary sulcus describes surface geography; identifying a particular artery or vein still requires tracing its connections.The anterior interventricular sulcus is the external groove between the right ventricle and left ventricle on the anterior surface of the heart. The left anterior descending artery and the anterior course of the great cardiac vein follow this region toward the cardiac apex.[ref]
Anatomy and Physiology 2e by J. Gordon Betts and others. §19.1, External Anatomy and Coronary Circulation, Figures 19.6 and 19.15
The name is a position description: anterior refers to the front-facing surface and interventricular to the two neighboring ventricular chambers. The anterior interventricular sulcus helps orient a specimen before the heart is opened. By contrast, the interventricular septum separates the cavities internally. A surface line in a photograph and a wall in an opened specimen are different views of related anatomy.
For an illuminating comparison, trace the left anterior descending artery from the left coronary artery toward the cardiac apex, then trace the nearby great cardiac vein toward the coronary sinus. Shared location does not imply shared flow direction or identical branching. Direct dissection also shows that superficial/deep relationships between these vessels vary; an anatomical study of 37 hearts documented such vein–artery relationships rather than assuming one invariant crossing pattern.[ref]
The anatomy of the coronary sinus and its tributaries by J. R. Ortale and others. Abstract, dissection method and arteriovenous relationships
The posterior interventricular sulcus is an external groove marking the meeting of the right ventricle and left ventricle on the posterior/inferior aspect of the heart. It provides a surface route for the posterior descending artery and middle cardiac vein toward the cardiac apex.[ref]
Anatomy and Physiology 2e by J. Gordon Betts and others. §19.1, External Anatomy and Coronary Circulation; Figures 19.6 and 19.15
Three objects must be distinguished when reading an anatomical drawing: the posterior interventricular sulcus is the groove, the vessels are structures within or along it, and the interventricular septum is the partition inside the heart. Following the groove toward the cardiac apex locates a ventricular boundary on the surface; it does not open a communication between the two ventricular cavities.
A useful dissection exercise is to identify the middle cardiac vein by tracing it back toward the coronary sinus, then compare its route with the neighboring posterior descending artery. The two vessels can occupy a common corridor while transporting blood in different directions. The origin of the posterior descending artery also varies with coronary dominance; the position of the groove does not by itself identify the supplying coronary artery. The posterior interventricular sulcus is therefore a stable anatomical landmark for describing a variable vascular network.
End-diastolic volume is the volume of blood in a specified ventricle at the end of filling, before the subsequent ejection. It is the starting volume in the usual volumetric stroke volume calculation and the denominator of ejection fraction:The right ventricle and left ventricle each have their own end-diastolic volume. The chamber, phase and measurement convention must be identified before two values are compared.
For a constructed example, a chamber filling to 120 mL and ending ejection at 50 mL has a stroke volume of 70 mL and ejection fraction about . Another chamber filling to 180 mL and ending at 110 mL has the same 70 mL stroke volume, but ejection fraction about . Equal ejected volumes do not imply equal relative emptying.
The quantity can be obtained from time-resolved images by choosing the filling phase and identifying the complete cavity. A primary right-ventricular magnetic resonance imaging study generated volumes from cine images with three-dimensional modelling; its reference analysis also considered age, sex and body size.[ref]
Reference right ventricular systolic and diastolic function normalized to age, gender and body surface area from steady-state free precession cardiovascular magnetic resonance by Alicia M. Maceira and others. Abstract, Methods and results
These factors help explain why an isolated volume should not be treated as a universal reference value.For a simple sum-of-slices model, , where is the measured cavity area in a slice and its represented thickness. Omitting a slice with area 10 cm and represented thickness 0.8 cm omits about 8 mL. This example connects image segmentation and coverage to a concrete volume error; it does not require a spherical ventricle.
End-systolic volume is the volume of blood remaining in a specified ventricle at the end of its ejection phase. It must be associated with a particular chamber and cardiac cycle. Subtracting it from the preceding end-diastolic volume gives the chamber's volumetric stroke volume:For example, mL and mL give mL. The residual 60 mL is not a separate compartment of permanently trapped blood; it is a chamber-volume measurement at one phase of a recurring cycle.
Measuring end-systolic volume requires both a phase choice and a cavity boundary. A primary magnetic resonance imaging study used cine images and three-dimensional modelling to measure right ventricular volumes and function in 120 healthy subjects.[ref]
Reference right ventricular systolic and diastolic function normalized to age, gender and body surface area from steady-state free precession cardiovascular magnetic resonance by Alicia M. Maceira and others. Abstract, Methods and results
An image's smallest-looking cavity in one view is not automatically the smallest three-dimensional volume.An original sensitivity calculation makes the boundary issue tangible. If a selected cavity volume mL has surface area cm, a hypothetical uniform outward boundary shift of cm gives a first-order volume error mL. This geometrical approximation does not prescribe how a real image should be segmented, but shows how many small boundary displacements can accumulate into a volume error.
At fixed end-diastolic volume, increasing end-systolic volume reduces both stroke volume and ejection fraction. That algebra does not identify the physiological cause: changing contraction, loading and valve behavior can affect the observed volumes. A single residual-volume number is therefore a measurement of state, not a complete mechanism.
The left atrium is the heart chamber receiving blood through the pulmonary veins and delivering it through the mitral valve to the left ventricle. It is the receiving chamber on the oxygenated return side of the pulmonary circulation.[ref]
Its role changes during the cardiac cycle. The chamber can accumulate incoming blood while its outlet is closed, pass blood onward during ventricular filling, and contribute to late filling through atrial contraction. The storage role is called atrial reservoir function.[ref]
Anatomy and Physiology 2e by J. Gordon Betts and others. §19.1, Left Atrium
A volume balance makes this more precise:Here the sum includes the incoming pulmonary vein blood flow rates, and the outlet term is signed net flow through the mitral valve. In a constructed interval with total inflow L/min and zero outlet flow for s, the stored volume increases byThe example describes transient storage, not an indefinitely sustained steady state. Over a repeating cycle with no net accumulation, average inflow must equal average outflow.
The entering streams can also differ in oxygen content. Their mixed content is weighted by their blood flow rates, not by the number of vessels. Thus the same anatomical chamber supports two distinct balance questions: how its volume changes with time, and how transported oxygen combines. Its volume alone determines neither the stroke volume of the left ventricle nor the oxygen content entering the left ventricle.
The cardiac apex is the pointed inferior end of the heart, formed mainly by the left ventricle. It lies toward the patient's left and supplies a useful endpoint for describing the cardiac long axis. The anterior interventricular sulcus and posterior interventricular sulcus approach this region along the ventricular surface.[ref]
The cardiac apex is an anatomical landmark, not a fifth chamber or an opening through which blood leaves. Blood flow from the left ventricle passes through the aortic valve; a pointed chamber outline does not indicate the outlet. This distinction is helpful when translating a simplified heart-shaped drawing into actual chamber connections.
A concrete orientation exercise begins with an anterior view of a specimen: identify the cardiac apex, follow the anterior interventricular sulcus away from it, then locate the coronary sulcus. These landmarks relate the ventricular tip, ventricular boundary and atrial–ventricular boundary. Right and left refer to the patient's anatomy, so a frontal illustration viewed face-on reverses them relative to the viewer.
The distinction between a landmark and a measurement also matters for the apical impulse. A motion detected at the chest surface is an observation of transmitted movement, whereas the cardiac apex is a location on the heart. Similarly, an echocardiography image needs an identified viewing direction: distance from an image edge is not an anatomical definition of the apex. A shared anatomical reference makes different views comparable.
A papillary muscle is a muscular projection inside a ventricle that anchors chordae tendineae attached to the mitral valve or tricuspid valve. During ventricular systole, its contraction helps maintain the supporting geometry and tension that restrain the valve leaflets. Valve opening is driven by the appropriate pressure difference; a papillary muscle does not act as a cord-operated opener.[ref]
Anatomy and Physiology 2e by J. Gordon Betts and others. §19.1, Right Ventricle and Heart Valve Structure and Function
The anchor's position matters as well as its ability to contract. In a primary simulator study, investigators examined six human and five porcine specimens of the mitral valve, measuring six selected chordae tendineae with force transducers. Eight tested anchor configurations used 5 mm displacement components relative to a reference position. The resulting tension changes depended on which chord was measured.[ref] Moving an anchor therefore need not distribute extra load equally through the apparatus.
An original mechanical approximation illustrates the distinction. If a taut cord has reference length , cross-sectional area and effective Young's modulus , a small extra extension givesThis is a local Hooke's law approximation, not a claim that biological cords remain linear at every strain. Anchor displacement changes the cord's extension and direction, while active muscle contraction changes the moving support itself. In the equal-tether example under chordae tendineae, changing direction also changes the tension needed to balance a fixed leaflet load. The apparatus is consequently a coupled geometrical and muscular system; naming its parts alone does not predict its forces.
The chordae tendineae are collagen-rich tensile cords connecting valve leaflets of the mitral valve and tricuspid valve to papillary muscles. Their tension helps restrain the leaflets against displacement toward an atrium during ventricular systole. They are supports for pressure-loaded leaflets, rather than muscles that pull the valves open. The aortic valve and pulmonary valve do not have this chordal apparatus.[ref]
Anatomy and Physiology 2e by J. Gordon Betts and others. §19.1, Right Ventricle; Heart Valve Structure and Function
An original static model shows why the arrangement matters. Suppose a leaflet attachment experiences a resultant force from a pressure difference acting over effective area . Two equal tethers each carry tension at angle to the load axis. Their transverse components cancel and their axial components balance the load:A stipulated kPa over cm gives N. Changing from to raises each tether's tension from about to N without changing the pressure load.
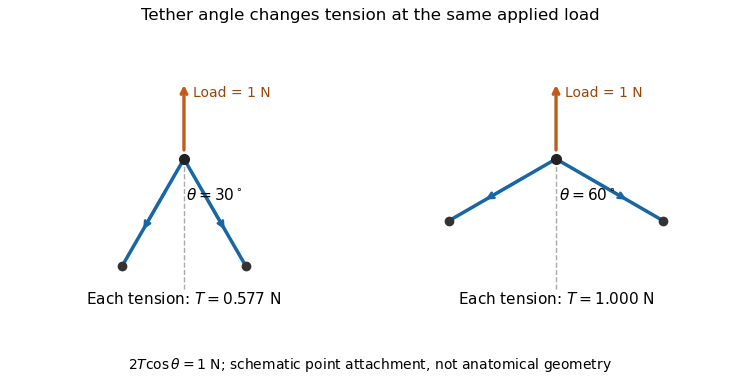
A primary experiment tested the related geometrical question in a left-heart simulator. Force transducers measured selected chordae tendineae while the positions of papillary muscles were changed. Different chordal types responded differently.[ref]
Effects of papillary muscle position on chordal force distribution: an in-vitro study by Jorge Hernan Jimenez and others. Abstract, Methods and Results
Real leaflets distribute loading among many attachments, so the two-tether model explains a mechanism without supplying a universal chordal force. Material behavior, geometry and the timing of ventricular contraction remain separate inputs.Ejection fraction is the fraction of a ventricle's end-diastolic volume lost from its cavity during ejection:The numerator is volumetric stroke volume; is end-systolic volume. The chamber must be specified: right ventricular ejection fraction concerns the right ventricle, whereas a calculation for the left ventricle concerns its own pair of volumes.
Time-resolved magnetic resonance imaging can estimate the two volumes from a consistently defined cavity. A primary right-ventricular study used cine images and three-dimensional modelling in 120 subjects.[ref]
Reference right ventricular systolic and diastolic function normalized to age, gender and body surface area from steady-state free precession cardiovascular magnetic resonance by Alicia M. Maceira and others. Abstract, Methods and results
The ejection fraction is a derived quantity, not an additional independent volume observation.An original example illustrates its scale dependence. Volumes of 120 and 60 mL give and stroke volume 60 mL. Volumes of 240 and 120 mL give the same ejection fraction but twice the stroke volume. Consequently, ejection fraction alone does not determine cardiac output; heart rate and an appropriate forward-flow interpretation are also needed.
Its response to shared measurement errors is instructive. Multiplying both measured volumes by the same positive scale leaves the ejection fraction unchanged. Adding the same offset does not:For the 120/60 mL example, and mL change the calculated fraction from to , even though the volume difference remains 60 mL. This is an error-model example, not a universal correction for image segmentation. Likewise, cavity volume loss can include backward flow through a heart valve; the formula alone does not establish net useful delivery.
A cardiac long axis is a base-to-apex direction used to describe the heart or a specified ventricular chamber. In left-ventricular imaging it is commonly planned through the cardiac apex and the center of the mitral valve. It is a chamber-based anatomical reference, not necessarily the vertical direction of a patient's body or an image display.
The primary cardiovascular magnetic resonance imaging protocol specifies connected two-chamber, four-chamber and short-axis planning from anatomical landmarks.[ref]
Standardized cardiovascular magnetic resonance imaging (CMR) protocols: 2020 update by Christopher M. Kramer and others. General techniques, Left ventricular structure and function, items 3 and 6; Figures 1–3
A long-axis image plane contains the chosen cardiac long axis; the corresponding cardiac short axis describes a transverse direction or view. Different planes can contain the same long-axis line while displaying different walls and neighboring chambers.An original vector construction makes the distinction precise. Let be the apex position and a chosen basal reference point. Thenis the axial unit vector. A displacement has axial component and transverse component . The line alone does not determine how the transverse coordinates are rotated around it.
This geometry matters for cardiac image foreshortening. In a simple projection model, a length tilted by out of the display plane projects to . A 10 cm length tilted by appears about 8.66 cm long. This is a geometrical illustration, not a correction formula for a tomographic slice: a slice may miss the true apex rather than project it. Consistent landmark selection is therefore part of meaningful comparisons of cavity shape, motion and volume.
The apical impulse is a localized movement of the chest wall associated with the heart's mechanical activity, assessed by inspection or palpation. It is a surface observation rather than the anatomical cardiac apex itself. Its position, area, duration and timing within the cardiac cycle describe different features of the observation.
A primary study compared physical examination with two-dimensional echocardiography in 41 patients. The investigators found that impulse location relative to selected chest landmarks did not reliably identify increased left ventricular end-diastolic volume.[ref]
Accuracy of precordial palpation for detecting increased left ventricular volume by S. D. Eilen and others. Abstract, examination/echocardiography comparison and conclusion
The observation illustrates why an external landmark should be tested against an independent measurement instead of being treated as a direct cavity-volume reading. It does not establish a universal diagnostic rule for all patients.A simple original measurement model explains one source of ambiguity. Let represent an internal mechanical displacement and let the measured local surface displacement beThe coefficient summarizes an idealized mechanical coupling and viewing direction; represents other contributions. If the same internal motion mm is observed with or and zero background, the surface amplitudes are 1 mm and 0.5 mm. Changing the coupling can change the observed amplitude without changing the internal motion.
Real chest wall mechanics are more complicated than a single gain. The model nevertheless explains why body position, contact and the chosen observation site belong to the measurement description. Neither a surface displacement amplitude nor an apparent lateral position alone specifies ejection fraction or ventricular volume.
Atrial contraction is active shortening of the atrial myocardium that contributes to moving blood from the atria into the ventricles. In the usual coordinated cardiac cycle, it occurs late in ventricular diastole, while the mitral valve and tricuspid valve permit filling. It supplements earlier passive filling; ventricular filling is not restricted to the period of atrial contraction.[ref]
For the left atrium, this active contribution is called atrial booster-pump function, distinguishable from atrial reservoir function and atrial conduit function. A volume balance separates storage from transport:where is summed pulmonary vein inflow and is net outflow through the mitral valve. During atrial contraction, a decrease in chamber volume can accompany outflow larger than the continuing inflow.
In an original example, the left atrium loses 15 mL during a chosen contraction interval while receiving 5 mL through the pulmonary veins. Integrating the balance shows that 20 mL must have left through the mitral valve. The volume decrease alone would undercount that interval's forward transport by 5 mL. Conversely, not all blood entering the left ventricle in that interval was necessarily stored before contraction began.
The distinction matters experimentally: a changing cavity volume, a velocity recorded at a valve and the trajectory of a particular parcel of blood are different observations. A primary flow-component study used time-resolved computed tomography, computational fluid dynamics and modeled particle paths to distinguish atrial transport routes.[ref]
Comprehensive left atrial flow component analysis reveals abnormal flow patterns in paroxysmal atrial fibrillation by Sophia Bäck and others. Abstract; Methods
A volume change associated with contraction is informative, but its interpretation requires the concurrent inflows and outflows.A cardiac short axis is a transverse reference direction or imaging view relative to a specified cardiac long axis. For left-ventricular imaging, a short-axis plane is planned across the chamber rather than through its base-to-apex length. The chamber and anatomical landmarks must be specified; a patient's horizontal body plane is not automatically a cardiac short axis plane.
A primary cardiovascular magnetic resonance imaging protocol plans short-axis images using linked long-axis views and covers the ventricle from base to apex.[ref]
Standardized cardiovascular magnetic resonance imaging (CMR) protocols: 2020 update by Christopher M. Kramer and others. General techniques, Left ventricular structure and function; Figures 1–2
A cardiac short-axis stack turns successive cavity outlines into volumetric information.For an original geometrical construction, let be the unit vector along the chosen cardiac long axis. A transverse plane through satisfiesParallel planes at different axial positions sample different portions of the ventricle. With measured cavity areas and represented slice thicknesses , a simple volume estimate is .
An oblique slice also illustrates a useful caution. An ideal circular cylinder cut at angle away from its perpendicular section has an elliptical cross-sectional area . At this is about larger. This does not prove that an entire consistently acquired oblique stack overestimates volume: integrating all areas with the correct normal spacing and complete coverage still recovers volume. Orientation, spacing and coverage must be treated together. The major practical question is whether the chosen stack and image segmentation represent the complete intended cavity, not whether one slice happens to look circular.
A Fibonacci heap implements a meldable priority queue using a collection of heap-ordered trees and a pointer to a minimum. Insertion and melding defer consolidation. Removing the minimum promotes its children and repeatedly links roots with equal numbers of children, keeping the smaller key above the larger. Decreasing a key cuts a violating node; mark bits and cascading cuts control how much child loss a retained node may accumulate.
The potential method charges stored work using the number of tree roots plus twice the number of marked nodes. It yields constant amortized cost for insertion, melding and decrease-key, and for removing the minimum. These are sequence guarantees, not worst-case bounds for each operation. A node with children has at least a Fibonacci-sized subtree, bounding logarithmically in total heap size. The inexpensive decrease-key operation improves Dijkstra's algorithm to with adjacency lists.[ref]
A headphone transfer function describes how an input electrical signal becomes acoustic pressure at a specified point near or within the listener's ear. For a linear small-signal description,where is complex sound pressure amplitude and the input electric potential difference. This transfer function includes both magnitude and phase. With these variables its units are pascals per volt, rather than a dimensionless gain.[ref]
Variability in the characterization of the headphone transfer-function by Abhijit Kulkarni and H. Steven Colburn. Section I: electrical input, pressure at an ear-canal point and headphone transfer.
For example, at one frequency let and apply a sinusoidal input. The pressure amplitude is under the model. A compensating filter for a desired pressure would ideally supply , but division by a small or uncertain response can demand a large, fragile correction.
The coupling to the ear is part of the system. Abhijit Kulkarni and H. Steven Colburn repeatedly positioned headphone cushions on a KEMAR acoustic mannequin and measured changes in response. Their measurements showed that repositioning could complicate compensation using a fixed inverse filter. A transfer function measured for one fitting need not remain identical after the device is moved.[ref]
Variability in the characterization of the headphone transfer-function by Abhijit Kulkarni and H. Steven Colburn. Abstract and introduction: placement-dependent supra-aural measurements and inverse compensation.
This differs from a head-related transfer function, which characterizes transformation from an external sound source to an ear location. Reproducing a desired spatial sound over headphones can require accounting for both transformations, rather than confusing the headphone's coloration with the directional effect being simulated.
Total harmonic distortion measures the root-sum-square amplitude of the selected higher harmonic components relative to the fundamental amplitude. For nonzero and one common amplitude convention,Peak amplitudes or root mean square amplitudes give the same ratio when used consistently for all sinusoids. The finite upper order , measurement bandwidth, and treatment of noise must be specified. The primary Anritsu procedure distinguishes this fundamental-normalized definition from normalization by the full harmonic component sum.[ref]
Total Harmonic Distortion Measurements by Anritsu. Printed p. 2, THD Definitions and Calculation Approach
For an original example, let a waveform have fundamental peak amplitude , second harmonic component , and third harmonic component , with no other components. ThenA logarithmic amplitude-ratio report is . The phases do not enter this RMS sum because distinct integer harmonic components are orthogonal over a full period.
If the denominator instead includes the fundamental and all included harmonic components, excluding DC, the resulting ratio isabout in the example. The two conventions are close at low distortion but differ markedly when higher harmonic components are large; only the latter is bounded by one. A quoted percentage without its denominator convention is incomplete. Broadband noise is a different contribution and is not silently included in the displayed THD formula.
A motivating apparatus uses a clean sinusoidal source, the device under test, and calibrated receivers tuned to the fundamental and harmonic component frequencies. Anritsu's worked system calibrates the receiver over those frequencies before combining separate measurements.[ref]
Total Harmonic Distortion Measurements by Anritsu. Printed p. 3, Figure 1; printed pp. 4–7, multichannel acquisition and combination
With an FFT-based instrument, spectral leakage bias in harmonic distortion measurements can misassign a strong fundamental to harmonic component bins; aliasing and insufficient receiver bandwidth can also hide or relocate components. Small THD therefore describes a stated test and analysis, not every possible waveform or operating level. Pinned article: Introduction to the OurBigBook Project
Welcome to the OurBigBook Project! Our goal is to create the perfect publishing platform for STEM subjects, and get university-level students to write the best free STEM tutorials ever.
Everyone is welcome to create an account and play with the site: ourbigbook.com/go/register. We belive that students themselves can write amazing tutorials, but teachers are welcome too. You can write about anything you want, it doesn't have to be STEM or even educational. Silly test content is very welcome and you won't be penalized in any way. Just keep it legal!
Intro to OurBigBook
. Source. We have two killer features:
- topics: topics group articles by different users with the same title, e.g. here is the topic for the "Fundamental Theorem of Calculus" ourbigbook.com/go/topic/fundamental-theorem-of-calculusArticles of different users are sorted by upvote within each article page. This feature is a bit like:
- a Wikipedia where each user can have their own version of each article
- a Q&A website like Stack Overflow, where multiple people can give their views on a given topic, and the best ones are sorted by upvote. Except you don't need to wait for someone to ask first, and any topic goes, no matter how narrow or broad
This feature makes it possible for readers to find better explanations of any topic created by other writers. And it allows writers to create an explanation in a place that readers might actually find it.
Figure 1. Screenshot of the "Derivative" topic page. View it live at: ourbigbook.com/go/topic/derivativeVideo 2. OurBigBook Web topics demo. Source. - local editing: you can store all your personal knowledge base content locally in a plaintext markup format that can be edited locally and published either:This way you can be sure that even if OurBigBook.com were to go down one day (which we have no plans to do as it is quite cheap to host!), your content will still be perfectly readable as a static site.
- to OurBigBook.com to get awesome multi-user features like topics and likes
- as HTML files to a static website, which you can host yourself for free on many external providers like GitHub Pages, and remain in full control

Figure 2. You can publish local OurBigBook lightweight markup files to either OurBigBook.com or as a static website.
Figure 3. Visual Studio Code extension installation.
Figure 5. . You can also edit articles on the Web editor without installing anything locally. Video 3. Edit locally and publish demo. Source. This shows editing OurBigBook Markup and publishing it using the Visual Studio Code extension. 
- Infinitely deep tables of contents:



All our software is open source and hosted at: github.com/ourbigbook/ourbigbook
Further documentation can be found at: docs.ourbigbook.com
Feel free to reach our to us for any help or suggestions: docs.ourbigbook.com/#contact