Classification of a presentation using specified diagnostic criteria. A diagnosis groups observed features; it does not, by itself, identify the causal processes maintaining a particular person's difficulties.
Arterial blood gas analysis applies blood gas analysis to a sample taken from an artery, providing a time-specific observation of systemic arterial gas tensions and acid-base state. Arterial oxygen partial pressure concerns oxygen tension, while arterial carbon-dioxide partial pressure and pH provide different information. The arterial qualifier is a sampling condition, not merely a label attached to any blood result.[ref]
Arterial Blood Gas (ABG) Test by MedlinePlus. What is an arterial blood gas test? measured quantities
The measurement chain includes obtaining an identified sample, preserving its gas composition and analyzing it with a checked instrument. Air contamination, fluid contamination and analysis delay can change the specimen after it leaves the circulation. A reproducible analyzer reading cannot repair a specimen that no longer represents the intended physiological state.[ref]
Equal oxygen tension need not mean equal arterial oxygen content. An original illustrative carrier model writeswhere is hemoglobin concentration, its oxygen-bound fraction and the carrier capacity per gram. Choose mL/g, mL/(dL·mmHg), and mmHg. Samples with and g/dL then contain about 20.00 and 10.15 mL O/dL, respectively. They have identical stipulated tension and saturation but very different oxygen content. The constants define the illustration; these are not patient results or diagnostic thresholds.
Interpretation also depends on the conditions when the sample was obtained. Inspired oxygen fraction, ventilator settings when applicable and sampling time help distinguish a changed respiratory state from a changed measurement condition. A later pulse oximetry reading is neither a simultaneous sample nor a measurement of carbon-dioxide tension.
Arterial blood gas analysis supplies evidence about gas transport and acid-base balance, but no individual number alone identifies the entire cause of an abnormal result. Measured co-oximetry and calculated oxygen saturation should also be distinguished when unusual hemoglobin species matter.[ref]
Pulse oximetry estimates arterial oxygen saturation noninvasively from wavelength-dependent optical signals that vary with the arterial pulse. A typical sensor combines red and infrared light-emitting diodes with a photodetector. The pulsatile component helps distinguish changing arterial blood contribution from relatively steady tissue and blood contributions; it is not a direct measurement of arterial oxygen partial pressure.
A primary instrument-design note implements 660 nm and 940 nm illumination, a shared photodetector and alternating channel acquisition. It separates pulsatile and steady components before estimating saturation.[ref]
Pulse Oximeter Fundamentals and Design by Santiago Lopez. Sections 2.2 and 3.1.2, printed pp. 3–5 and 7, optical channels and acquisition
These wavelengths and electronics describe that implementation rather than every possible sensor.Writing pulsatile and steady signal magnitudes as AC and DC, a common normalized optical quantity isFor original channel values AC, DC, AC and DC, this ratio is 0.5. Halving both red-channel magnitudes leaves the ratio unchanged. This illustrates intensity normalization; it does not determine a saturation without a validated relation between and saturation.
That relation is experimentally checked against an independent reference. The FDA's technical guidance describes comparing oximeter readings with simultaneous co-oximetry of arterial samples during controlled inspired-oxygen changes in volunteers, and reporting an accuracy statistic.[ref]
Pulse Oximeters: Premarket Notification Submissions by the FDA. Clinical Performance, SpO2 Accuracy: reference arterial sampling, inspired mixtures and paired readings
Such comparisons test the whole sensor–algorithm measurement chain, rather than only the arithmetic of a two-channel ratio.One summary is the root mean square differenceFor invented paired errors percentage points, percentage points even though mean error is zero. A small mean bias does not guarantee small individual errors.
Motion, weak pulsatile signals and additional absorbing hemoglobin species can invalidate assumptions behind a simple estimate. Pulse oximetry does not measure pH, carbon-dioxide tension or hemoglobin concentration. A stable displayed percentage therefore cannot establish every aspect of ventilation, oxygen content or gas exchange.
Palpation is examination by touch with the hands or fingers. It uses physical contact to assess features such as an organ's apparent size, position, consistency and tenderness. The observed feature and the resulting clinical diagnosis are separate: feeling a moving or resistant region does not by itself identify the complete underlying anatomy or disease.[ref]
The force applied during palpation is part of the measurement. In an original simplified indentation example, suppose a probe produces of displacement under a load. The secant stiffness for that observation isA second specimen requiring at the same displacement has twice this apparent stiffness. That ratio is not automatically a ratio of intrinsic elastic modulus values: contact geometry, specimen thickness, support and deformation rate can alter the force-displacement curve. Touch supplies a mechanical observation whose interpretation requires an appropriate model.
A clinical measurement study makes the distinction concrete. S. D. Eilen and colleagues compared precordial palpation with two-dimensional echocardiography in 41 patients. They compared the location and palpable diameter of the apical impulse with left ventricle end-diastolic volume. A lateral impulse location was sensitive but not specific for enlargement. Within the reported subgroup without ventricular hypertrophy, an impulse diameter above in the left-lateral position had reported diagnostic sensitivity and diagnostic specificity . Those are results for that study's condition and subgroup, rather than universal performance figures for touch.[ref]
Accuracy of precordial palpation for detecting increased left ventricular volume by S. D. Eilen and others. Abstract, Annals of Internal Medicine99 (1983), pp.628–630: cohort, location result and subgroup diameter result
A small probability example explains why both attributes matter. In a stipulated set with 20 enlarged and 80 non-enlarged hearts, a rule detecting 18 enlarged hearts but also flagging 24 non-enlarged hearts has diagnostic sensitivity and diagnostic specificity . Only of its positive results identify enlargement. These invented counts are not a reconstruction of the 41-patient study. They show why a palpable feature must be tested against an independent reference and interpreted with the population being examined.
Repeating a specified observation can assess reproducibility, while comparison with echocardiography assesses a different question: correspondence with the chosen anatomical reference. Holding body position and observation method consistent helps distinguish those sources of variation. A reliable description of what was felt is necessary evidence, but reproducibility alone does not establish the causal explanation.
Dysphagia means difficulty swallowing. It can involve preparation and transfer of material in the mouth, passage through the pharynx or movement down the oesophagus. These stages require coordinated muscle activity, sensation and neural control. Dysphagia names a functional difficulty rather than one unique disease or anatomical lesion. [ref]
Dysphagia by NIDCD. Fact sheet, What is dysphagia?, How do we swallow? and How does dysphagia occur?
Swallowing also protects the airway: food transport and temporary closure of the breathing passage must be coordinated. A delay in initiating the response and a mechanical obstruction can both disrupt swallowing through different mechanisms. Difficulty moving a bolus, pain during swallowing and entry into the airway are related observations but should not be treated as identical definitions.
A reference range is an interval derived from measurements in a specified reference population under specified analytical conditions. It gives context for a laboratory result; it is not automatically a boundary separating disease from health. Different methods, ages and reference populations can lead to different intervals. [ref]
How to Understand Your Lab Results by MedlinePlus. Reference ranges: laboratory differences, healthy people outside the interval and illness within it
For an illustrative central 95% interval, about 5% of measurements from the defining population lie outside by construction. If 20 independent tests each have a 5% outside probability, the probability of at least one outside result is . Independence is an assumption, but the calculation shows why many tests increase incidental flags. A clinical decision threshold can instead be chosen for a particular diagnostic or treatment purpose.
Population conditioning of ventricular reference ranges describes how the comparison interval for a ventricular measurement depends on the population and measurement conditions used to define it. A reference interval for a specified age, body size and imaging protocol is a different statistical object from an interval pooled across an arbitrary mixture of groups.
Let be a ventricular measurement and the recorded conditioning variables. A conditional central interval iswhere is a quantile. It describes a reference distribution under those conditions; it is not automatically a disease-decision boundary or a confidence interval for a patient's true value.
A primary cardiac-MRI study used 120 healthy participants, 60 men and 60 women aged 20–80, with steady-state free-precession cine imaging and three-dimensional right-ventricular modelling. Age, body surface area and sex predicted several measurements; some age associations remained after size normalization.[ref]
Reference right ventricular systolic and diastolic function normalized to age, gender and body surface area from steady-state free precession cardiovascular magnetic resonance by Alicia M. Maceira and others. Abstract, Methods and results and Conclusion
Dividing a volume by body surface area therefore need not remove every population association.An original example separates conditioning from pooling. Suppose hypothetical groups have volume distributions and in millilitres. Their central normal intervals are approximately – and –. A value is three standard deviations above the first group's mean but one below the second's. The groups are mathematical examples, not assigned clinical categories or published thresholds.
For a population mixture, . Its quantiles depend on the mixing proportions and generally are not averages of group quantiles. Changing the sampled proportions can change the pooled reference interval even if every within-group distribution stays fixed.
A transferable reference description therefore states participant selection, conditioning variables, acquisition method and segmentation conventions. Associations with recorded categories do not by themselves identify causal biological mechanisms. Interpretation additionally needs measurement uncertainty and the clinical question; membership outside a reference interval alone does not establish a diagnosis.
A core needle biopsy removes a small cylinder of biological tissue through a hollow needle for examination, commonly by microscopy. Retaining a piece of tissue permits assessment of cellular arrangement as well as individual cells. It differs from merely imaging the region or sampling dissolved substances in blood. The specimen supplies evidence from the sampled location; its interpretation also depends on sampling adequacy and the surrounding clinical question. [ref]
A liver function test measures selected substances in blood to investigate aspects of liver activity or injury. Common panels include albumin, bilirubin and enzymes associated with liver cells.
The components reflect different processes: protein production, handling of breakdown products and release of enzymes need not change together. Consequently the panel's name does not make every component a direct measurement of one overall liver function. The pattern and its clinical context contribute to clinical diagnosis; an abnormal value alone does not identify a unique disease.[ref]
Liver Function Tests by MedlinePlus. What are liver function tests?: component list and the distinction between impaired function, injury and diagnosis
A Wood's lamp supplies ultraviolet radiation for examining skin, making some differences in fluorescence or pigmentation easier to observe. Emitted visible light under illumination and ordinary surface appearance are different kinds of optical evidence. Some organisms or substances fluoresce while others do not, and surface materials can also contribute a signal. The observation therefore supplements clinical diagnosis rather than identifying every infection from color alone. [ref]
Wood lamp examination by MedlinePlus. Medical Encyclopedia: ultraviolet illumination, clinical uses and interfering materials
A heart murmur is an additional or prolonged sound associated with blood flow through the heart or nearby vessels, heard during auscultation. It differs from the usual brief heart sounds associated with valve closure. Some murmurs accompany structural or flow abnormalities, while others occur without significant structural disease. The sound is an observation contributing to clinical diagnosis, rather than a diagnosis uniquely identifying its cause. [ref]
A neurological sign is an observed finding about the function of the nervous system, such as an altered reflex, asymmetrical movement or a sensory deficit. It differs from a symptom, which is an experience reported by the person. A neurological examination combines several observations because one finding can have several explanations. The pattern and its context help distinguish a possible mechanism or location of dysfunction. [ref]
Neurological Exam by MedlinePlus. What happens during a neurological exam?: mental status, sensory, motor and reflex examination
Echocardiography uses ultrasonography to form moving images of the heart. Returning sound waves reveal the dimensions and motion of its chambers and heart valves, making structure and pumping visible during the same examination.
In the common transthoracic approach, an acoustic transducer transmits pulses through the chest and receives reflected signals. A computer reconstructs their spatial and temporal pattern into images. The resulting measurements contribute to clinical diagnosis alongside the clinical history and other observations; an image and its interpretation are distinct stages of the assessment.[ref]
Echocardiography by MedlinePlus. What is echocardiography?: moving images, structures assessed and the transthoracic transducer
Doppler echocardiography combines echocardiography with Doppler ultrasound to examine motion, particularly blood flow, in and around the heart. The image locates anatomical structures, while frequency shifts in returning ultrasound provide information about motion along the beam. It supplies a velocity measurement rather than a direct measurement of cardiac output.
For a moving scatterer with speed , beam-to-flow angle , transmitted frequency and sound speed , the leading approximation isThe two-way factor arises because the outgoing and returning wave both interact with the moving scatterer. For stipulated , , and , the shift is about . At the same flow gives half that shift. Interpreting the latter as perfectly aligned flow would underestimate the speed by a factor of two.
Pulsed-wave Doppler echocardiography uses timing to select a sampling region, whereas continuous-wave Doppler echocardiography receives signals continuously along the beam. The acquired velocity spectrum and the selected anatomical region must therefore be interpreted together. A moving tissue signal and a blood-flow signal are different observations even if both produce a Doppler effect.
A motivating primary validation by Halfdan Ihlen and colleagues compared Doppler-derived cardiac output with independent thermodilution and Fick measurements. The protocol included changes in flow during dobutamine infusion, testing correspondence over changing conditions rather than only one resting observation.[ref]
Determination of cardiac output by Doppler echocardiography by Halfdan Ihlen and others. Abstract: ten thermodilution comparisons and eleven Fick-method comparisons
Turning a velocity record into transported volume additionally requires an appropriate flow area and representative velocity distribution. The velocity-time integral makes that connection explicit. A large peak velocity alone neither determines the volume moved per beat nor identifies a unique clinical diagnosis.
Color Doppler overlays spatially localized estimates of motion on an ultrasound image. In blood-flow imaging, the estimated quantity is related to the Doppler ultrasound shift of echoes from moving red blood cells. The color scale encodes motion relative to the beam, not the blood's oxygen content. The displayed legend and sign convention must be read with the image.[ref]
Recommendations for Quantification of Doppler Echocardiography by Miguel A. Quiñones and others. General Principles, printed p. 167, multiple gates and color velocity estimates
An important implementation estimates the phase change between repeated echoes using autocorrelation. Chihiro Kasai and coauthors demonstrated an autocorrelator combined with pulsed acquisition, testing scanners with phantoms as well as examining hearts. This made many localized estimates available fast enough for a changing two-dimensional image; it did not make each colored pixel an independent direct measurement of transported blood volume.[ref]
Real-Time Two-Dimensional Blood Flow Imaging Using an Autocorrelation Technique by Chihiro Kasai and others. Abstract and Sections II–III, mean Doppler frequency, system and phantom experiments
For an original single-frequency example, let successive complex echo samples be . Thenwhere is the Doppler ultrasound frequency shift and the pulse repetition frequency. The measured phase is unchanged when increases by any integer multiple of . This is aliasing even for a noiseless signal.
With Hz and transmitted frequency MHz, assume speed of sound m/s and motion parallel to the beam. True velocity 0.80 m/s gives Hz. Its principal sampled value is approximately Hz, corresponding to displayed beam velocity m/s under the same conversion. A color sign change can therefore occur without physical reversal of fluid flow.
The example isolates sampling. Mixed moving scatterers, finite spatial resolution and signal processing add further limitations. A color image is useful for locating a jet or a changing flow pattern, while a stroke volume requires an appropriate spatial and temporal integration of velocity, not the apparent size or brightness of a colored patch.
Continuous-wave Doppler echocardiography measures the Doppler frequency distribution of continuously transmitted and received ultrasound through the heart. It can record high flow velocities without the pulse-repetition-frequency aliasing limit of pulsed-wave Doppler echocardiography, but it does not select one depth along the beam. Signals from different contributing locations can overlap.[ref]
Recommendations for Quantification of Doppler Echocardiography by Miguel A. Quiñones and others. General Principles, printed p.167; CW Doppler, p.169
For an aligned flow at speed , the leading Doppler ultrasound relation isWith stipulated transmitted frequency , sound speed and , the shift is approximately . A pulsed measurement with pulse repetition frequency would have a Doppler Nyquist frequency of only . Continuous-wave acquisition avoids that particular pulse-rate restriction. Its receiving electronics and digital sampling still have finite bandwidth; continuous transmission does not imply unlimited measurable frequency.
The price is Doppler range ambiguity. If a beam intersects two moving regions, a peak in the spectrum does not by itself label which depth produced it. The anatomical image, direction, timing and waveform context supply additional evidence. The outer spectral envelope describes the fastest detected motion along the beam, rather than a direct spatial average over one known vessel opening.[ref]
Recommendations for Quantification of Doppler Echocardiography by Miguel A. Quiñones and others. CW Doppler, p.169, outer envelope and anatomical localization
This matters when estimating stroke volume. Multiplying a continuous-wave peak-velocity integral by an arbitrarily selected area can combine measurements from different sites or different parts of a velocity distribution. Flow-profile mismatch in Doppler stroke-volume estimation explains the separate requirement that the chosen velocity represent the area used in the volume calculation.
Doppler range ambiguity means that a measured Doppler ultrasound signal does not uniquely identify the depth of the scatterers producing it. In continuous-wave Doppler echocardiography, simultaneous transmission and reception collect motion signals along the beam without a unique pulse travel time. A high-speed spectral component therefore does not, by itself, label an anatomical site.[ref]
Recommendations for Quantification of Doppler Echocardiography by Miguel A. Quiñones and others. General Principles, printed p. 167, and CW Doppler, p. 169
Repeated pulses can introduce a different range ambiguity. Let the pulse period be , with pulse repetition frequency . If reception is associated only with its delay within a pulse period, the possible round-trip travel times include . The corresponding depths arewhere is speed of sound. Identifying which transmitted pulse generated an echo requires additional information or a restriction on the possible depth.
For an original example, Hz gives microseconds. With m/s and observed within-period delay microseconds, possible depths are 7.7, 23.1 and 38.5 cm. Successive possibilities are separated by 15.4 cm. An anatomical restriction to depths below 15.4 cm would identify the first value; the echo timing alone would not.
Range ambiguity and aliasing of the Doppler ultrasound frequency are distinct. The first confuses position along the beam; the second confuses motion frequencies sampled at a given pulse rate. Increasing the pulse rate can improve the unaliased motion range while reducing unique depth coverage, producing the pulsed Doppler depth-velocity tradeoff. High-pulse-rate methods deliberately accept multiple possible sampling depths.[ref]
Recommendations for Quantification of Doppler Echocardiography by Miguel A. Quiñones and others. General Principles, pp. 167–168, high-PRF modification
Anatomical imaging and acquisition geometry supply constraints; a plausible waveform is not itself a unique range label.Pulsed-wave Doppler echocardiography uses timed ultrasound transmissions and returns to measure motion within a selected sampling region of the heart or nearby vessels. An echo's round-trip delay provides depth information, so a time window can select a location. The resulting Doppler spectrum describes a finite sample volume rather than an exact point.[ref]
Recommendations for Quantification of Doppler Echocardiography by Miguel A. Quiñones and others. General Principles, p.167; PW Doppler, pp.168–169
For sound speed and round-trip delay , the ideal depth is . Avoiding ambiguity between successive pulses in a simple single-depth system requires waiting at least before the next pulse. If is the pulse repetition frequency, this givesThe Doppler signal is sampled once per pulse, so unaliased shifts obey . For aligned flow and transmitted frequency ,This is the pulsed Doppler depth-velocity tradeoff in the stated idealization. With , and , the highest ideal pulse rate is and the corresponding speed limit is about . Doubling the depth halves both limits. Practical timing margins can reduce them further.
Aliasing is an ambiguity of the sampled signal, not proof that blood reverses direction. For example, sinusoidal Doppler shifts of and have identical complex samples at a pulse rate, because their frequencies differ by exactly one sampling rate. The example concerns the Doppler signal, not direct sampling of the megahertz acoustic carrier.
High-pulse-rate variants can trade unique range localization for a larger velocity range. Continuous-wave Doppler echocardiography instead transmits and receives continuously, accepting depth ambiguity. The choice of acquisition method therefore changes what information the measured spectrum contains.[ref]
Recommendations for Quantification of Doppler Echocardiography by Miguel A. Quiñones and others. General Principles and high-PRF discussion, pp.167–168
The pulsed Doppler depth-velocity tradeoff is the restriction linking uniquely localized depth and unaliased beam velocity in a simple repeated-pulse Doppler ultrasound acquisition. Deeper echoes take longer to return, leaving fewer distinct pulse observations per second. Fewer observations reduce the unaliased Doppler ultrasound frequency interval.
For maximum depth , speed of sound and pulse repetition frequency , the ideal nonoverlapping timing restriction is . The Nyquist frequency is . Combining this with givesThe strict inequality excludes the ambiguous Nyquist endpoint. For beam-parallel motion, . At a right angle there is no first-order Doppler sensitivity to the motion; the apparent divergence of the formula does not provide unlimited useful velocity measurement.
For an original calculation, let m/s and MHz. A 15 cm depth allows at most approximately 5133 pulses/s in this idealization, with axial Nyquist speed about 0.791 m/s. At 30 cm these bounds fall to approximately 2567 pulses/s and 0.395 m/s. Doubling the transmitted frequency to 5 MHz halves the axial velocity limits at either depth.
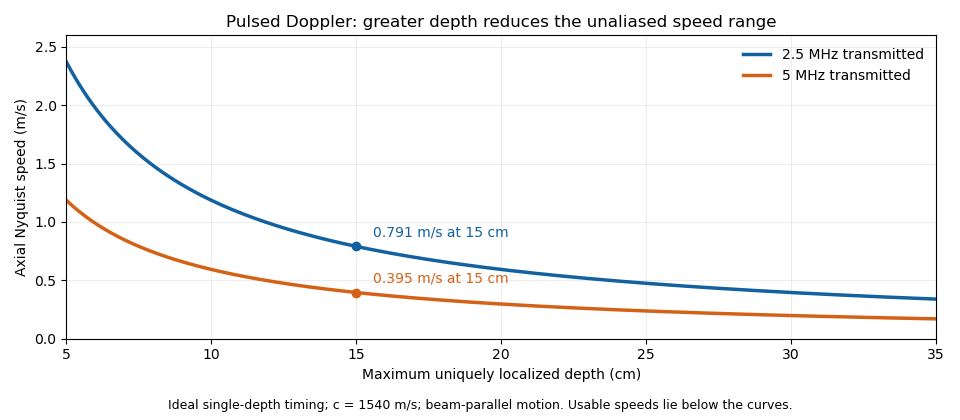
These are timing and sampling bounds, not a specification for a particular instrument. Pulse duration, scheduling and processing can lower the usable limit. Moving a spectral baseline changes the displayed signed interval but does not increase its total sampled-frequency width. Continuous-wave Doppler echocardiography avoids this pulse-rate restriction while sacrificing unique depth selection; high-pulse-rate acquisition instead accepts Doppler range ambiguity.[ref]
Recommendations for Quantification of Doppler Echocardiography by Miguel A. Quiñones and others. General Principles, pp. 167–168, PW/CW and high-PRF distinctions
The acquisition choice determines which ambiguity remains.The velocity-time integral is the area under a velocity-versus-time curve over a specified interval:It has units of length. In Doppler echocardiography, a systolic flow-velocity trace can be integrated to estimate the distance associated with that measured waveform. The interval, sampling site and method of tracing the spectrum are part of the measurement.
The exact volume transported through an opening isFor constant area and a representative area-mean normal velocity , this reduces to . Approximating the left ventricular outflow tract as circular then giveswhere is the measured diameter, SV is stroke volume, HR is heart rate and CO is cardiac output. The primary Doppler study relates integrated velocity and anatomical area to cardiac output and compares the result with independent methods.[ref]
Determination of cardiac output by Doppler echocardiography by Halfdan Ihlen and others. Theory and Abstract: velocity integration, aortic size and method comparison
For stipulated and VTI , the estimated stroke volume is . At 75 beats per minute, cardiac output is approximately . A triangular waveform with peak and duration has that same integral. A trapezoidal waveform with the same peak and duration, but 0.10-second rise and fall, has integral instead.
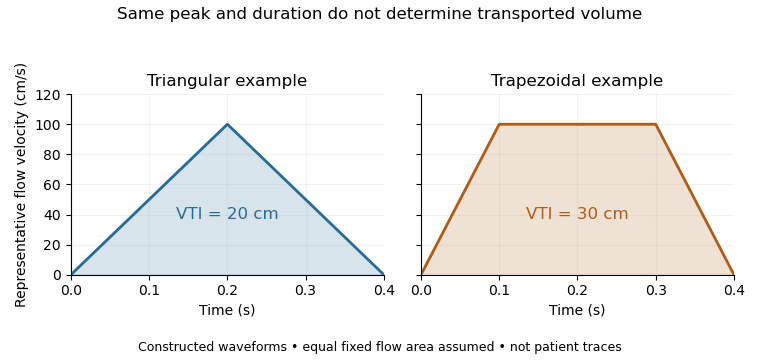
Equal peak flow velocities with different velocity-time integrals
. Details. The calculation depends quadratically on diameter: a 5% diameter overestimate produces a 10.25% area overestimate at fixed VTI. Flow-profile mismatch in Doppler stroke-volume estimation is a different error: a peak spectral envelope need not equal the area-mean velocity required by the volume integral. A VTI is also not automatically the path length travelled by one identifiable blood cell, since a fixed sampling region can observe different cells over time.
Flow-profile mismatch in Doppler stroke-volume estimation occurs when the velocity used in a stroke volume calculation does not represent the spatial average over the measured opening. The exact instantaneous volumetric flow rate isfor fixed area . Consequently . Replacing by a centerline velocity or fastest spectral envelope requires an additional profile assumption. The ASE report distinguishes the modal part of a pulsed Doppler spectrum from the outer continuous-wave envelope representing the fastest detected cells.[ref]
Recommendations for Quantification of Doppler Echocardiography by Miguel A. Quiñones and others. PW Doppler and CW Doppler, printed p.169
An original family of axisymmetric profiles makes the missing factor explicit. Within a circular opening of radius , supposeHere is the centerline velocity. Integrating concentric annuli givesThe Doppler profile correction factor is therefore for this stipulated family. A parabolic profile has ; a blunter profile has . Both have the same centerline velocity and vanish at the wall. These shapes are examples, not fitted cardiac profiles.
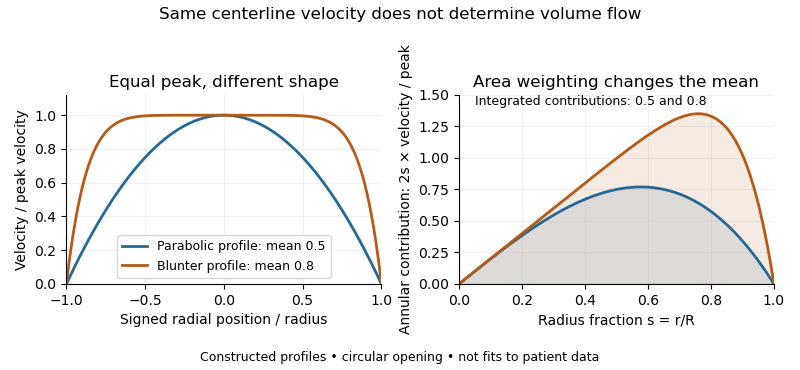


For and a centerline velocity-time integral of , uncorrected multiplication by gives . The two model profiles instead transport approximately and . Identical peak data can therefore support different transported volumes when the profile differs.
Real Doppler measurements also involve beam direction, sample-volume extent and signal processing. Their spectral envelope need not coincide with the literal centerline trace used in this example. The illustration isolates the averaging issue; it is not a universal factor-of-two correction for clinical measurements. The sampling site and anatomical area must be matched as well.[ref]
Recommendations for Quantification of Doppler Echocardiography by Miguel A. Quiñones and others. PW Doppler, p.168, matched velocity and area locations
A Doppler profile correction factor converts a specified sampled velocity into the area-mean normal velocity needed to calculate volumetric flow rate. For a fixed opening of cross-sectional area and nonzero sampled trace , defineThe definition depends on both the spatial flow profile and what the instrument's sampled trace represents. A centerline trace, spectral mode and fastest detected envelope need not have the same correction. The primary ASE report distinguishes these spectral quantities and requires matched locations for velocity and area measurements.[ref]
Recommendations for Quantification of Doppler Echocardiography by Miguel A. Quiñones and others. PW Doppler and CW Doppler, printed pp. 168–169
Even if each instantaneous correction is known, the appropriate correction for a whole velocity-time integral is generally not its ordinary time average. Provided the denominator is nonzero,This velocity-weighted Doppler profile correction gives greater influence to intervals carrying more of the sampled velocity-time integral.
In an original two-interval calculation, each interval lasts one second. Let sampled velocities be 10 and 30 cm/s and instantaneous corrections 0.5 and 1.0. The sampled velocity-time integral is 40 cm, while its corrected counterpart is cm. Thus , whereas the ordinary average correction is 0.75. For , the latter would predict 30 mL instead of the model's 35 mL.
When the sampled velocity is nonnegative, this is a weighted mean and lies between the instantaneous corrections. Reversing fluid flow can create cancellation in the denominator, so that conclusion need not hold. A factor measured in a steady tube also cannot be assigned to a changing cardiac profile without evidence. The calculation explains an averaging requirement; it supplies no universal clinical correction.
A velocity-weighted Doppler profile correction converts an integrated sampled velocity into an integrated area-mean velocity by weighting each instantaneous correction according to the sampled velocity at that time. For a fixed opening of cross-sectional area , suppose its area-mean normal velocity is . Thenprovided the denominator is nonzero. Applying the time average of to a velocity-time integral generally answers a different question.
The error has an exact covariance form. Define and time covariance . ThenConsequently an unweighted correction is exact if that covariance vanishes, even when the correction varies in time. Its failure is about how profile changes align with transport, not merely whether either trace varies.
In an original two-second example, equal one-second intervals have sampled velocities 10 and 40 cm/s and corrections 1.0 and 0.5. The unweighted mean correction is 0.75, but . With , actual modeled transport is 60 mL; unweighted correction predicts 75 mL, a 25% overestimate. Here time covariance is cm/s and mean sampled velocity is 25 cm/s, recovering .
If is nonnegative, normalized velocity weights are nonnegative and lies between the instantaneous corrections. For reversing fluid flow, the denominator can instead approach zero through cancellation. Forward and reverse transported volumes can then be more informative than a single unstable ratio. If opening area changes, the integral must also retain ; this fixed-area correction does not remove that additional dependence.
The primary Doppler report requires appropriate matching of sampled velocity and anatomical area and distinguishes modal spectral velocities from the fastest envelope.[ref]
Recommendations for Quantification of Doppler Echocardiography by Miguel A. Quiñones and others. PW Doppler and CW Doppler, printed pp. 168–169
The covariance calculation is an original integration identity, not a universal clinical profile correction.Endoscopy examines an internal space using an instrument that carries illumination and a viewing system into that space. A flexible instrument can transmit images from the digestive tract, while other forms examine different anatomical regions. Direct visualization and a biopsy answer different questions: a visible change describes appearance, whereas a tissue sample can support microscopy or molecular analysis. Some examinations combine both kinds of evidence. [ref]
A pregnancy test detects or measures human chorionic gonadotropin in urine or blood. The placenta produces this hormone after implantation, giving the measurement its biological connection to pregnancy.
A qualitative result applies a detection rule, while a quantitative blood test estimates the hormone level. The sampling time and the test's detection capability therefore affect what a negative result can establish. Detection of a biochemical signal is one observation within clinical diagnosis, rather than a complete description of the pregnancy's development.[ref]
Pregnancy Test by MedlinePlus. What is a pregnancy test?: hCG production, specimens and qualitative versus quantitative tests
A blood test measures a property of a blood sample. Different tests answer different questions: a blood count quantifies cellular components, whereas a liver function test measures selected substances associated with the liver.
A result requires a named measured quantity, units and an appropriate reference interval. Changes in cell counts and changes in a dissolved substance are different observations, even when both come from the same sample. Their contribution to clinical diagnosis depends on the question and accompanying findings.[ref][ref]
Liver Function Tests by MedlinePlus. What are liver function tests?: substances measured in a blood sample
A blood count quantifies one or more cell populations in a blood sample. Counts of red blood cells, white blood cells and platelets describe different populations, usually reported per unit volume rather than as a total number throughout the body.
A complete blood count combines several measurements, including cell counts and indices of cell size or composition. A differential count further separates types of white blood cells. These distinctions matter because two reported numbers may describe different components of the same specimen.[ref]
Complete Blood Count (CBC) by MedlinePlus. What is a Complete Blood Count?: counted populations, differential counts and cell indices
Clinical percussion produces vibrations by tapping the body surface and evaluates the resulting sound or movement. The response depends partly on the material and boundaries beneath the surface: air-rich, fluid-filled and solid regions can transmit different acoustic patterns. Percussion is therefore an indirect physical measurement used alongside other observations. A sound difference alone does not uniquely identify the underlying disease. [ref]
Auscultation listens to sounds generated within the body, commonly with a stethoscope. Cardiac and respiratory activity produce different acoustic patterns that can supply information about timing and flow. Unlike percussion, the examiner usually listens to sounds generated by the body rather than producing the initial sound by tapping. The observation and the inference about its cause are separate steps in clinical diagnosis. [ref]
A stethoscope couples sounds at the body surface to a listener or recording system for auscultation. In an acoustic instrument, the chestpiece and air-filled tubing transmit sound waves toward the ears; electronic designs instead use a sensor and amplification. The instrument changes access to an acoustic signal, but interpreting the source still requires timing, anatomical context and comparison with other findings. [ref]
Articles by others on the same topic
There are currently no matching articles.