
Calibrated radiant-flux measurement 2026-10-14
An optical power meter makes the definition operational: collect a specified beam on a calibrated photodiode, measure its electric current, and infer incident radiant flux using spectral responsivity. In the manufacturer-authored Model 1830-R Series Optical Power Meters User's Manual by Newport Corporation, §5.5.1 specifies a concrete sequence: connect the detector and its calibration module, select watt mode and the source wavelength, block the beam and press ZERO, then unblock it and read the display. The stored background includes dark current and ambient light present during zeroing. For narrowband radiation,The electric current difference divided by spectral responsivity has units . For a stipulated and difference , the inferred radiant flux is ; these numbers illustrate the inference and are not reported measurements. The entire beam must hit the active area, and §5.6 calls for correct wavelength, background subtraction, and operation below detector saturation. If an optical attenuator is fitted, §5.4 requires the calibrated detector–attenuator pair and the matching meter setting.
The calibration itself must connect electric current to independently known incident power. NIST's Spectroradiometric Detector Measurements: Ultraviolet, Visible, and Near-Infrared Detectors for Spectral Power by Thomas C. Larason and others describes this chain. A cryogenic radiometer, an electrical substitution radiometer, compares temperature changes from absorbed light with those from known Joule heating (§5.2). Transfer and working detectors carry that watt scale to a spectral comparator (§5.1). A source, monochromator, focusing optics, shutter, beam splitter, and monitor photodiode illuminate a standard and test detector in turn; calibrated current-to-voltage electronics and voltmeters provide the readout (§§3.2.2–3.2.4, 4.3.1). At each wavelength, subtract blocked-beam signals and normalize each detector signal by the simultaneously sampled monitor signal. Comparison with the standard yields the test detector's spectral responsivity. NIST uses two working standards and alignment normal to the beam (§6.1.1).
Controls distinguish a smaller collected radiant flux from a faulty conversion: block and unblock the beam to check the baseline; check that its footprint fits the active area; verify the calibrated optical attenuator configuration; and test proportional response within the specified operating range. Source drift faster than monitor sampling is not removed. NIST discusses finite spectral bandwidth, stray light, temperature, and spatial response variations (§§3.1.1, 6.2, 7.2). A broadband optical spectrum requires the weighted integral in spectral radiant flux, rather than dividing by an arbitrary single spectral responsivity. These limitations explain why the meter's displayed watts need a stated collection boundary, spectral assumptions, and calibration conditions.
Cryogenic radiometer Created 2026-10-14 Updated 2026-10-14
A cryogenic radiometer uses low-temperature operation to improve electrical substitution radiometry through particular material and thermal properties. Lower heat capacity of a copper receiver permits a substantial cavity without proportionately slow relaxation; cold shields reduce unwanted thermal radiation, and heater leads with superconductivity can suppress resistive lead heating. These features do not make radiometric absorptance exactly one or abolish optical-electrical heating non-equivalence.[ref]
Spectroradiometric Detector Measurements: Ultraviolet, Visible, and Near-Infrared Detectors for Spectral Power by Thomas C. Larason and others. §5.2, printed pp. 30–32: cryogenic advantages and remaining window/non-equivalence corrections
Cold surroundings matter as much as a cold receiver. In a simplified gray-surface model, net outward thermal radiation is , using emissivity , area , shield temperature and the Stefan-Boltzmann constant . Cold shields reduce the incoming term as well as the receiver's emission; cooling the receiver alone while leaving it exposed to warm surroundings does not remove incoming radiation. An entrance window still provides an optical and thermal path. Vacuum reduces gas-mediated heat transfer, while an intentional radiometer thermal link remains necessary. This model explains specific losses, rather than promising a universal improvement factor or perfect accuracy.
Electrical substitution heat balance 2026-10-14
An explicit lumped model makes the cancellation understandable. Treat the receiver as having uniform temperature , heat capacity , heater power deposited in the receiver, net parasitic input , and outward heat transfer to a reference at temperature . With incident radiant flux and radiometric absorptance , conservation of energy givesThe dark state has no admitted beam. Compare settled dark and light states, denoted and ; each has . Subtracting their balances giveswhere and . At identical and , with unchanged surroundings and parasitic heating, both correction differences vanish. Thus , and . Notice the signs: extra stray thermal radiation admitted with the beam also reduces heater power, so it must be subtracted from that reduction before attributing the result to the intended beam.
Measure the heater's own terminal voltage and electric current : for steady electrical heating, , where is its electrical resistance. A supply voltage that includes wire voltage drops counts Joule heating in the leads too; only the portion deposited in the receiver belongs in this balance. Changes in that deposited lead heat belong in . Optical-electrical heating non-equivalence adds a further instrument-specific correction when the uniform-temperature model is insufficient.[ref]
Spectroradiometric Detector Measurements: Ultraviolet, Visible, and Near-Infrared Detectors for Spectral Power by Thomas C. Larason and others. §5.2, printed p. 30: heater wires, window transmission and optical/electrical non-equivalence
Electrical substitution radiometer Created 2026-10-14 Updated 2026-10-14
An electrical substitution radiometer measures radiant flux by replacing absorbed optical power with calibrated Joule heating. At fixed temperature, feedback control holds the receiver equally warm with the beam blocked or admitted: after corrections, absorbed optical power equals the reduction in supplied electrical heating. Incident radiant flux additionally requires radiometric absorptance and entrance-path corrections. This connects radiometry to electrical standards.[ref]
Spectroradiometric Detector Measurements: Ultraviolet, Visible, and Near-Infrared Detectors for Spectral Power by Thomas C. Larason and others. §5.2, printed p. 30: electrical substitution and electrical standards
Picture a small absorbing cavity connected to a colder reference block by a radiometer thermal link. A heater supplies Joule heating, a thermometer senses the receiver, and feedback control adjusts the heater. When light supplies some of the heating, the controller supplies less. The readout is the change in heater power, rather than the beam's brightness or its number of photons. NIST's institutional description gives a concrete receiver with a conical interior, absorbing coating and weak Kapton support, operated with a receiver heater and thermometer.[ref]
Pico-Watt ACR by National Institute of Standards and Technology. Description, Design Parameters for Improved ACR Sensitivity; Key Design Features: conical receiver, coating, constant-temperature loop and thin-walled Kapton link
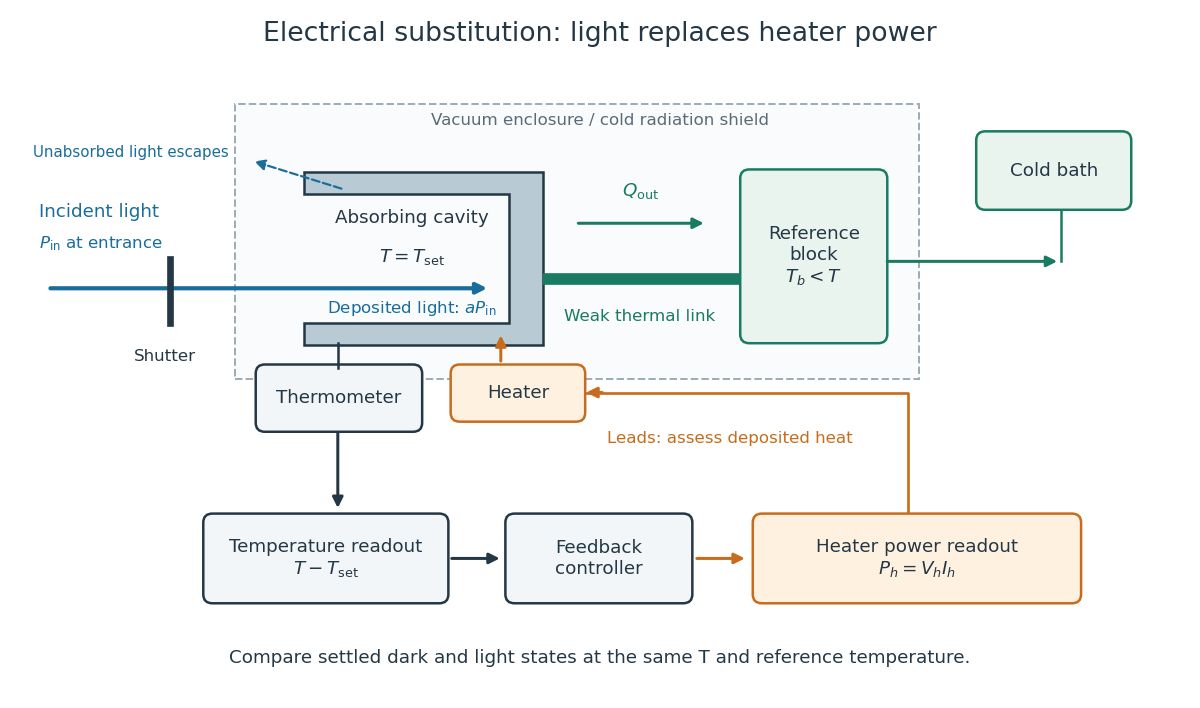
Cavity, radiometer thermal link and heater readout in an electrical substitution radiometer
. Original functional schematic, not a drawing of a particular laboratory instrument. The shutter defines dark and illuminated states; incident radiant flux is specified at the receiver entrance. The cavity absorbs a fraction , while the remainder escapes. The reference block and receiver have distinct controlled temperatures. The thermometer signal drives feedback control, and heater voltage and electric current provide the electrical power readout. Lead heating, stray radiation and spatial heating differences require separate checks. Details.
Ultraviolet Created 2026-10-05 Updated 2026-10-14
Ultraviolet is electromagnetic radiation with wavelengths shorter than the violet end of ordinarily visible light. The CIE convention uses –, subdivided into UV-A at –, UV-B at – and UV-C at –. These divisions name intervals; they do not mark universal changes in every material's response. The boundary with visible light is not sharp, and other fields use near-, far-, vacuum- and extreme-ultraviolet divisions. [ref]
https://cie.co.at/eilvterm/17-21-008. CIE, International Lighting Vocabulary (2020), ultraviolet radiation: ranges and boundary caveats
. For example, NASA's Solar Dynamics Observatory observes extreme-ultraviolet bands below ; the CIE interval is therefore not the full extent of astronomical ultraviolet usage. [ref]https://sdo.gsfc.nasa.gov/data/channels.php. NASA, Solar Dynamics Observatory HMI and AIA channels: the Atmospheric Imaging Assembly's ultraviolet and extreme-ultraviolet bands
.The CIE ultraviolet interval corresponds to frequencies about – and photon energies –, using vacuum wavelength and with Planck constant and speed of light . Shorter wavelength means larger energy per photon; larger irradiance means more incident power per area. These are different comparisons. At the same incident power, a ultraviolet beam has fewer photons per second than a infrared beam, even though each ultraviolet photon has more energy.
A common ultraviolet mechanism is photon absorption promoting an Electron from a ground state to an excited state of a chemical atom or molecule. By contrast, many infrared absorption bands involve stretching or bending chemical bonds. For either mechanism, both the energy difference and the coupling to the incident electromagnetic field matter. One concrete example is the absorption discussed for butadiene: an Electron moves between molecular orbitals, and the position of the absorption reveals their energy separation. Ultraviolet absorption can therefore probe molecular orbitals, while infrared spectroscopy probes many molecular motions. [ref]
https://openstax.org/books/organic-chemistry/pages/14-7-ultraviolet-spectroscopy. John McMurry, Organic Chemistry, §14.7: ultraviolet excitation and the 217 nm butadiene example
.Subsequent chemical reactions depend on the absorbing chemical substance and its environment; the label ultraviolet alone does not predict a reaction rate. At sufficiently short wavelength, a photon can cause photoionization if its energy exceeds the relevant ionization energy. There is no single wavelength that separates all ionizing from all nonionizing behavior for every chemical substance. Likewise, eventual heating after photon absorption is possible in both ultraviolet and infrared. The distinction is useful because different optical spectra expose different processes, not because the two ranges obey different laws of electromagnetism.
Ritter's 1801 observation used a chemical readout rather than a thermometer. In Caltech/IPAC's account, sunlight passed through a glass optical prism and silver chloride was placed in different parts of the optical spectrum. Darkening was weak toward red, stronger toward violet, and pronounced beyond the visible violet edge. The measured evidence was a change in the chemical substance's appearance at a spatial location with no visible color, establishing radiation beyond the eye's ordinary range. It was not a calibrated measurement of a universal ultraviolet optical spectrum. [ref]
https://coolcosmos.ipac.caltech.edu/page/lesson_ritter_experiment. Caltech/IPAC Cool Cosmos, The Ritter Experiment (2022): the historical silver-chloride observation
.A controlled modern interpretation of such a chemical test would compare equal exposure durations and matched fresh samples, keep an unexposed sample in darkness, monitor temperature, and distinguish scattered visible light from the intended short-wavelength beam with characterized filtering. These are proposed controls, not an assertion that Ritter performed them. Unequal sample preparation or heating can change a reaction rate. The optical prism, terrestrial atmosphere and sample response restrict which wavelengths the test detects. Darkening is a detector-weighted response, so its spatial maximum is not automatically the maximum of incoming radiant flux or of photon energy.
Thomas Larason and Jeanne Houston's NIST report documents a quantitative ultraviolet detector comparison. An argon source feeds a double-diffraction grating spectrometer; a shutter and mirrors deliver the selected band to a working-standard or test photodiode, successively at the same position. A beam splitter supplies a monitor photodiode. Amplifiers and voltmeters record detector and monitor simultaneously; shutter-closed readings provide dark baselines. The – scan, typically with bandpass, measures spectral responsivity. Monitor normalization suppresses source drift; known spectral lines calibrate wavelength. The report assesses temperature effects and unwanted light outside the band, weighted by detector response. The latter need not cancel between different spectral responsivities. [ref].
This determines electrical response without visual perception. Bandpass and spatial nonuniformity limit the calibration; aging and changed temperature can affect later use. The scan includes visible light and ultraviolet; no response below follows from it.
For a narrow beam, the idealized substitution calculation isHere is spectral responsivity; and are dark-subtracted detector and monitor electric currents. This follows by writing for each detector and using the monitor to track changes in radiant flux. It assumes linear response, unchanged beam splitting and collection geometry, and a sufficiently narrow band. For an illustrative standard with , ratios and give . These invented arithmetic inputs illustrate the method; they are not NIST measurements.
An independent photon-counting model connects spectral responsivity to quantum efficiency. If is the number of collected Electrons per incident photon, there is no internal multiplication, and is the elementary charge, thenAt illustrative constant and , this gives about at and at . The ultraviolet readout is smaller in this model because there are fewer incident photons, not because their individual energies are smaller. Real quantum efficiency depends on wavelength, windows, absorption and carrier collection; a detector's band gap and construction determine its usable range. Constant across these two wavelengths is an analytical comparison, not a claimed specification of a real photodiode.
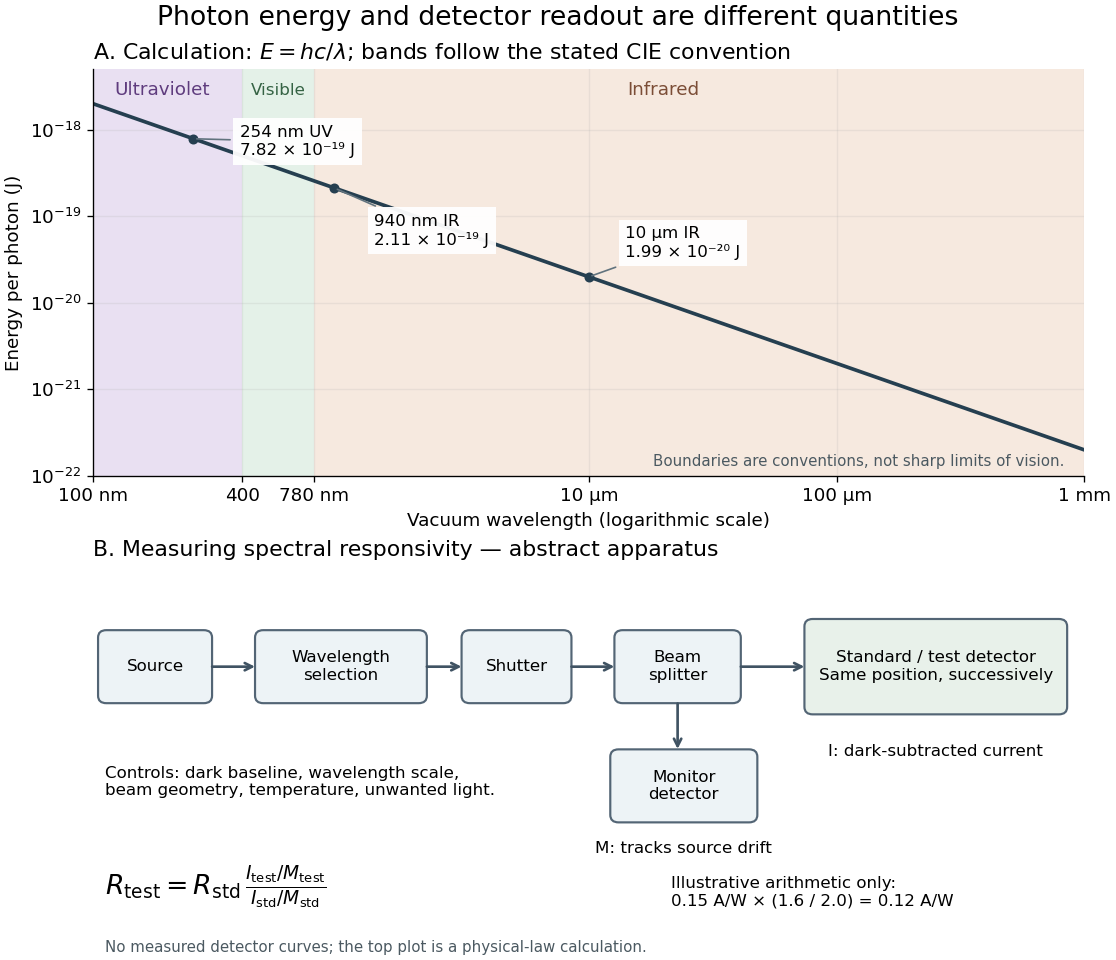
Photon energy across conventional ultraviolet and infrared ranges, with a schematic detector-substitution experiment
. Details. 
The curve is the calculated relation , and the shaded ranges use the stated CIE conventions. The lower diagram abstracts the detector comparison rather than reproducing an instrument drawing. Together with the infrared heat-balance illustration, it shows why a calibrated detector response, rather than what looks bright to an observer, is the bridge between invisible radiation and a quantitative measurement.