Topics (384k) Articles (398k) Users (410) Discussions (242) Comments (383) Files (13k) New article

If in lowest terms, then makes even. Substituting then makes even, contradicting that the integers are coprime. More quantitatively, for every nonzero integer , and factoring the difference of squares gives . To verify the constant, for the other factor is less than four; outside this interval the approximation error is at least .
In this structural use, the coordination number counts nearest neighbouring constituents. State which neighbours are counted and which ionic crystal structure is being described; it is not an ion's electric charge number.
The rock salt structure of ordinary sodium chloride has a coordination number of six for each kind of ion: six nearest neighbours of the opposite sign surround each ion along three perpendicular directions. Its conventional cubic unit cell contains four formula units; sharing corner, face, and edge sites between adjacent cells must be included in that count. Sixfold local coordination is compatible with overall stoichiometry.[ref]
The checkerboard plane in the diagram is a slice through this three-dimensional arrangement. It leaves out the two nearest neighbours above and below the plane. Repeating a complete even-by-even patch gives equal numbers of signs; the displayed odd-by-odd crop has a boundary imbalance and is not a complete neutral ionic crystal or a unit cell. Other salts need not have the rock salt structure or the same coordination number.
An ATP-sensitive potassium channel couples membrane potassium conductance to cellular nucleotide state. A familiar pancreatic complex combines Kir6.2 pore subunits with SUR1 regulatory subunits. Increased intracellular ATP tends to inhibit channel opening; in a pancreatic beta cell, reduced potassium conductance can promote membrane depolarization and subsequent insulin secretion. Nucleotide regulation therefore links glucose metabolism to electrical activity, with regulatory-subunit and nucleotide-context dependence. [ref]
UniProtKB by the UniProt Consortium. Q14654, Function, Catalytic activity and Subunit structure
For one-dimensional inverse scattering, the Gelfand-Levitan-Marchenko equationrecovers the transformation kernel from scattering data encoded by . In the convention used for the Korteweg-De Vries equation above, the potential is
Put , and . For the dressing operator , differentiating gives and , where and . Uniqueness of the linear integral equation therefore supplies a Lax pair. Its commutator identity is , which gives the KdV equation when the eigenfunction is not identically zero. Differentiation under the integral and the uniqueness assumption are essential hypotheses.
Scattering data describe connections between normalized solutions of an auxiliary spectral equation, together with any discrete spectral points and their norming data. In an inverse scattering transform, the nonlinear potential is reconstructed from these data; boundary spectral connection matrices must additionally obey a global relation.
The X-ray transform records integrals of a function or tensor evaluation over a specified family of curves. The curve family, parametrization and any weights are part of the definition. Straight lines, geodesics and magnetic flows give different versions; their injectivity and unavoidable potential kernels depend on that geometry.
An inverse problem is an ill-posed problem if it fails any requirement of a well-posed problem: existence for every admissible datum, uniqueness, or continuity of the reconstructed object as the data change. These requirements depend on the chosen spaces and norms, not just the equation. Clason's regularization notes formulate this distinction explicitly.[ref]
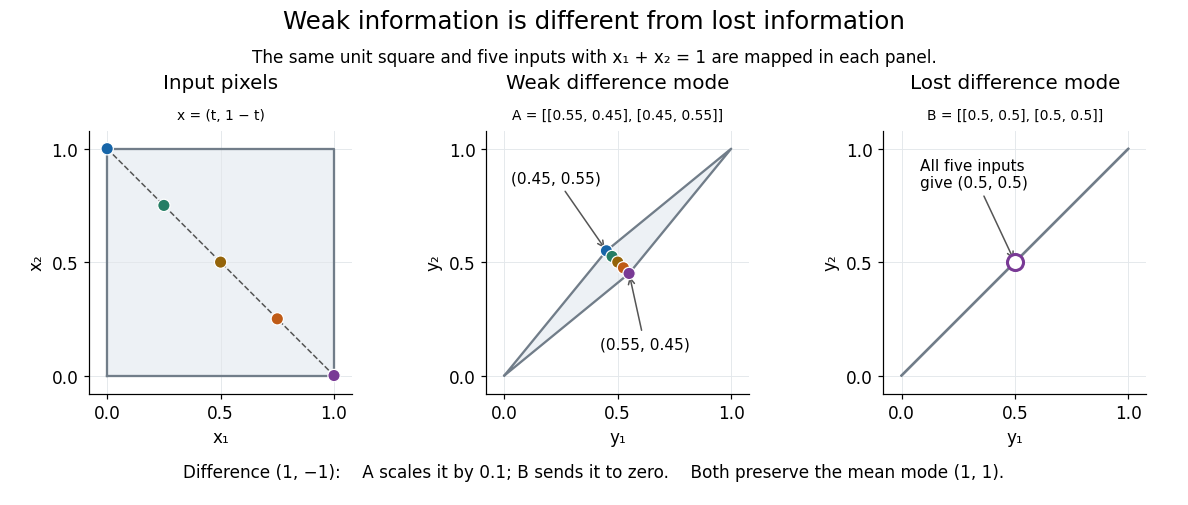
Complete averaging illustrates lost information:The difference mode belongs to the null space because . Even restricting both pixels to leaves infinitely many indistinguishable inputs. This is failure of uniqueness. Data such as also have no exact preimage under , illustrating failure of existence when arbitrary two-component observations are admissible.
The two-pixel matrix in the inverse problem example has a weakly observed difference mode, not a null space mode. Its inverse is continuous: this finite-dimensional problem is a well-posed problem with noise-sensitive conditioning. Small positive singular values alone do not imply mathematical ill-posedness. In infinite-dimensional problems, positive singular values approaching zero can make inversion unbounded: unit solution modes then produce data tending to zero. This destroys continuity even without a null space. Regularization of an inverse problem must distinguish missing information from information recoverable only at the cost of amplifying measurement noise.
Tomography reconstructs an interior distribution from measurements along multiple lines or paths through it. A linear unattenuated model is the Radon transform; absorption changes it to an attenuated Radon transform.
Image deblurring reconstructs a sharper image from observations described by a blur model. In the linear model, a matrix or linear operator mixes values of the unknown image; measurement noise perturbs the observed result. The inverse problem must therefore recover attenuated distinctions while controlling amplification of measurement noise, as the two-pixel example illustrates.
For and , a differentiable graph is invariant precisely when . This is the chain rule along a trajectory on the graph. The equation determines coefficients in a local power-series approximation of a stable manifold or unstable manifold; checking tangent directions alone does not ensure invariance.
G2 phase follows completed nuclear DNA replication and precedes mitosis. The ordinary diploid state is . [ref]
During S phase, nuclear DNA replication produces paired sister chromatids. DNA content rises from to , while the chromosome count remains .
During G1 phase, growth and preparation precede DNA replication. The ordinary diploid nuclear state is .
The Lyman-alpha forest is the multitude of foreground Lyman-alpha absorption features in a distant quasar's spectrum, at wavelengths shorter than its own redshifted Lyman-alpha emission. The quasar supplies a bright background; intervening neutral hydrogen atoms remove photons near their local Lyman-alpha line resonance. Many dips can therefore come from one atomic transition encountered at different redshifts, rather than from many different chemical elements. Some features are instead transitions of other ions, so a dip alone does not identify Lyman-alpha absorption. This makes faint foreground gas detectable through the light it removes, even when its own emission would be difficult to see. [ref]
https://ned.ipac.caltech.edu/level5/Sept01/Rauch/Rauch1.html. Rauch (1998), The Lyman Alpha Forest in the Spectra of QSOs, section 1
.Ignoring peculiar velocity for the moment, an absorber at cosmological redshift puts its Lyman-alpha line atThe rest wavelength is in the ultraviolet; at it appears at in the optical spectrum. In a toy sightline to a quasar at , absorbers at appear at , all shortward of the quasar's Lyman-alpha emission position . The absorbing atoms see the selected photons at their own resonance; the observed dip's redshift belongs to the foreground gas. Peculiar velocity adds a Doppler shift, so the inferred is not a pure distance coordinate. The rest wavelength and resonance interpretation are given in Rauch (1998), section 1.
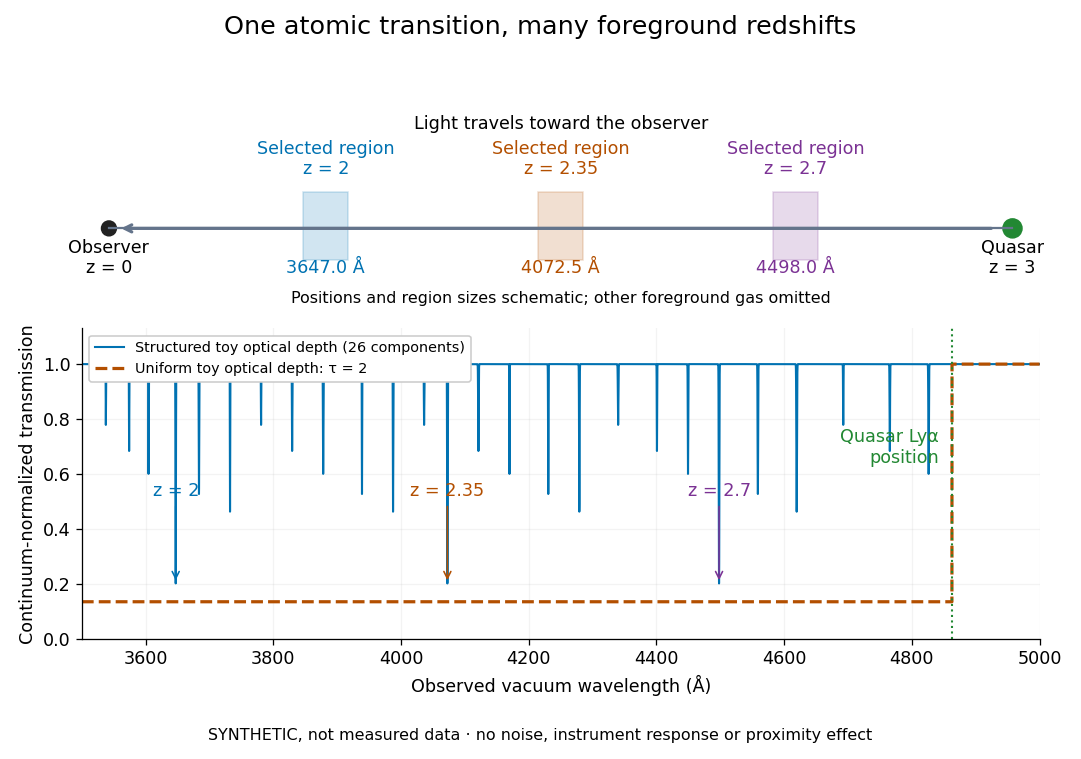
The diagram uses invented optical depths and 26 Doppler cores; three selected foreground regions are marked. Their drawn positions and sizes are schematic. The dashed comparison imposes a uniform optical depth , giving transmission throughout the chosen foreground band. It is an idealized smooth-absorption model, not a measured spectrum or a prediction of the actual intergalactic medium.
The smooth comparison explains the Gunn-Peterson effect: neutral hydrogen distributed throughout an expanding intergalactic medium can absorb continuously over a wavelength interval, because different parts of the path resonate with different observed wavelengths. The resolved Lyman-alpha forest instead has strong transmission fluctuations and distinguishable absorption lines. These need not represent isolated compact clouds: diffuse sheets and filaments in the cosmic web can generate peaks in optical depth along one line of sight. A continuously varying gas distribution can look like a collection of lines. [ref]
https://ned.ipac.caltech.edu/level5/Sept01/Rauch/Rauch1.html. Rauch (1998), section 1: smooth absorption
. [ref]https://ned.ipac.caltech.edu/level5/Sept01/Rauch/Rauch5_1.html. Rauch (1998), section 5.1: synthetic sightlines and extended structures
.An early observation makes the identification concrete. Lynds's 1971 paper analyzed six spectrograms of the quasar 4C 05.34, with emission redshift , taken in spring 1970 using an image-tube spectrograph on Kitt Peak's 84-inch telescope. Five covered – with approximately resolution; the most informative covered about – at resolution. Its reproduced spectrogram shows the strong Lyman-alpha emission flanked mostly on the short-wavelength side by numerous absorption lines. Lynds tabulated their wavelengths and estimated strengths, identified five absorption redshift systems, and proposed that many remaining unidentified lines were the same Lyman-alpha line at additional redshifts. He explicitly warned about blending, an incomplete census of weak lines, and wavelength errors around –. The result established a striking spectral pattern; the paper's proposed interpretation did not measure a separate physical cloud for every dip. [ref]
https://adsabs.harvard.edu/pdf/1971ApJ...164L..73L. Lynds (1971), The Absorption-Line Spectrum of 4C 05.34, Figure 1, Table 1 and discussion
.A contrasting observation demonstrates smooth, very strong absorption. Becker and collaborators (2001) used the Echelle Spectrograph and Imager on Keck II to observe the quasar SDSSp J103027.10+052455.0 at . Sky lines gave an instrumental full width at half maximum of about near , or spectral resolving power . After sky subtraction and flux calibration, the mean continuum-normalized transmission over – was , consistent with zero; this corresponds to absorption redshifts approximately –. They identified a Gunn-Peterson trough. Crucially, resonant Lyman-alpha absorption is so sensitive that even a small neutral fraction can make transmission undetectable: the trough alone does not establish a mostly neutral intergalactic medium or uniquely date reionization. [ref]
https://arxiv.org/pdf/astro-ph/0108097. Becker et al. (2001), sections 2–4: instrument response, transmitted flux and interpretation
.What a spectrum constrains is a radiative transfer problem. For an ideal foreground screen with negligible emission into the observed beam, the intrinsic continuum-normalized transmission isHere is spectral radiative flux, is its unabsorbed continuum, is optical depth, is neutral hydrogen number density, and is neutral hydrogen column density along proper path length . A Voigt profile model constrains redshift, column density and a velocity width together. A nearly black line has lost much of its sensitivity to further increases in optical depth; blending and an uncertain continuum can also admit different fitted components. Finite spectral resolving power and noise limit which widths and weak features can be measured. [ref]
https://ned.ipac.caltech.edu/level5/Sept01/Rauch/Rauch2.html. Rauch (1998), section 2: resolution, noise and profile analysis
. [ref]https://arxiv.org/pdf/astro-ph/0101005. Kim, Cristiani and D'Odorico (2001), section 3: fitted parameters and nonunique profile fits
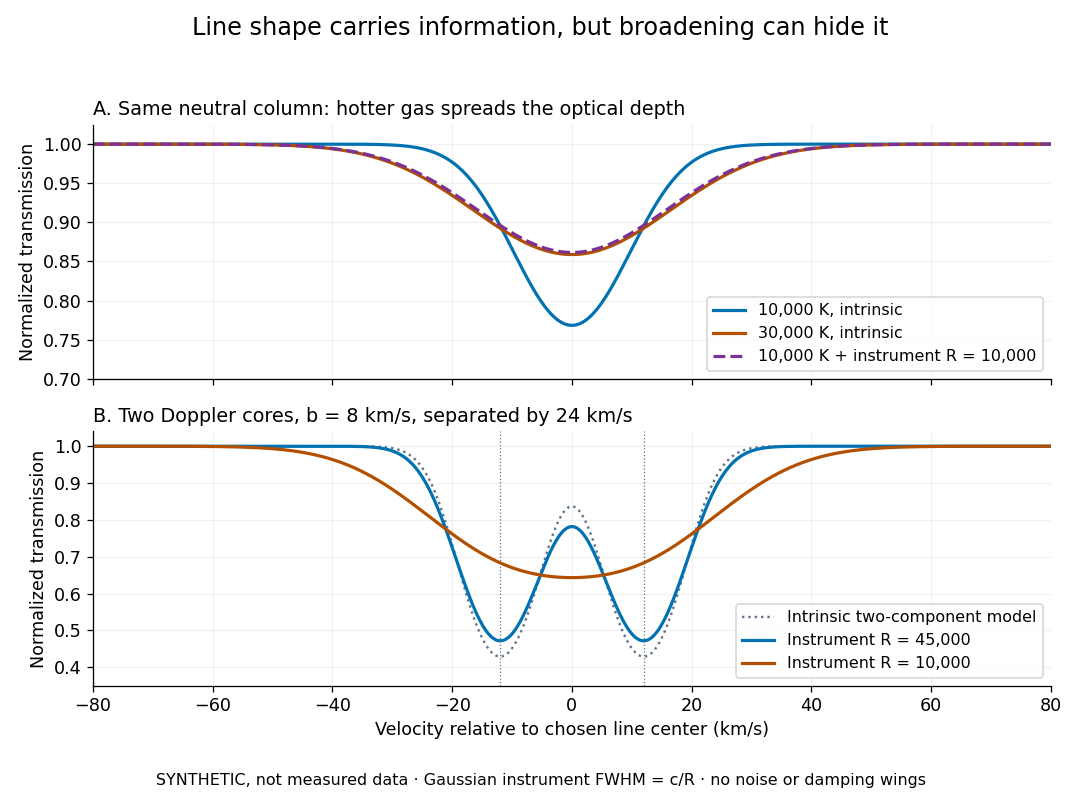
.For a purely thermal Doppler core, use the velocity convention . The Maxwell-Boltzmann velocity distribution then giveswhere is the Boltzmann constant, is temperature and is a hydrogen atom's mass. This is times the Gaussian distribution's standard deviation. Higher temperature spreads the same column density over more velocities. An instrument also broadens a line: locally, for a nearly flat continuum, the recorded transmission is approximately the convolution of with the normalized instrumental response, not the exponential of a convolved optical depth. A Gaussian response with full width at half maximum has standard deviation , where is the speed of light and the spectral resolving power.
Synthetic absorption profiles: thermal broadening, instrumental smoothing and unresolved blends
. Details. The upper model fixes the integral , hence the neutral hydrogen column density for this transition, while changing temperature. A cooler line blurred by an instrument resembles a warmer intrinsic line. The lower model has two equal Doppler cores separated by : reducing spectral resolving power merges them into one apparent feature. Both panels use invented profiles, Gaussian instrumental responses, and no noise or damping wings. They illustrate an inverse problem, rather than measurements of temperature or a universal relation between a dip and a cloud.
Better observations provide the inputs to that inverse problem. Kim, Cristiani and D'Odorico (2001) analyzed three quasars with the VLT's UVES spectrograph. For HE2217–2818, Table 1 records and of exposure in the – setup in October 1999. Isolated thorium-argon lamp lines measured ; the data were resampled into bins, with signal-to-noise ratios about – per pixel over –. They fitted a local polynomial continuum, fitted Voigt profiles, and compared statistics of the transmitted flux. Their analysis excluded the region near the quasar to avoid the quasar proximity effect and used the interval between its Lyman-beta and Lyman-alpha emission to reduce confusion with other Lyman-series absorption. Features below became confused with noise, setting their adopted lower column density limit. Figure 1 shows the measured spectrum, fitted profiles and residuals. This was a calibrated absorption measurement, with explicit selection limits. [ref]
https://arxiv.org/pdf/astro-ph/0101005. Kim, Cristiani and D'Odorico (2001), UVES observations, sections 2–3, Table 1 and Figure 1
.Even after instrumental correction, a width need not be purely thermal Doppler broadening. Hubble flow across extended gas, peculiar velocity structure and unresolved blends can contribute. If an isolated line's intrinsic width obeys with an independent Gaussian nonthermal contribution , then ; gives a computed upper bound about . A complex blend need not satisfy this single-component model. Noise can also bias the fitted widths of weak lines. This is why the thermal cutoff of Lyman-alpha line widths, calibrated against gas models, is more informative than assigning a temperature to every dip. [ref]
https://ned.ipac.caltech.edu/level5/Sept01/Rauch/Rauch3_3.html. Rauch (1998), section 3.3: width measurements, noise bias and bulk motions
.Finally, neutral hydrogen column density is not total gas mass density. In a pure hydrogen approximation, with gas optically thin to ionizing radiation and nearly fully ionized in photoionization equilibrium, the Lyman-alpha forest photoionization scaling giveswhere counts all hydrogen nuclei, is the photoionization rate, is the radiative recombination coefficient and is the neutral fraction. At fixed temperature and , doubling quadruples ; doubling halves it. These computed examples explain both the sensitivity to density contrast and the ambiguity: stronger absorption can mean denser gas, weaker ionizing radiation, a different temperature, or more path length. The Jeans-length ionization correction for the Lyman-alpha forest adds a size model rather than an independently measured depth. Optically thick Lyman limit systems and damped Lyman-alpha systems require different treatment. [ref]
https://ned.ipac.caltech.edu/level5/Sept01/Rauch/Rauch5.html. Rauch (1998), section 5: neutral fraction and ionization correction
. [ref]https://arxiv.org/pdf/astro-ph/0104272. Schaye (2001), section 2 and Appendix equations A6–A7: ionization balance and the Jeans-length model
.The beauty of the Lyman-alpha forest is that a spectrum converts otherwise faint foreground gas into a sequence of markers through cosmic time. With a model of radiative transfer, velocities, ionizing radiation and the temperature-density relation of photoionized intergalactic gas, its transmission statistics probe the cosmic web and gas thermal history. A single line of sight remains one narrow sample, not a unique three-dimensional density map. [ref].
The cosmic ionizing background is the diffuse radiation field capable of photoionization of intergalactic gas. Its specific intensity depends on source luminosity functions, ionizing photon escape fractions, cosmological redshifting, and radiative transfer through absorbers. Quasars and star formation supply major contributions with different spectral shapes and evolution.
Diffuse gas in photoionization equilibrium is often approximately described by the displayed temperature-density contrast relation. Photoheating and expansion cooling produce its thermal history. It is an empirical model for low-density gas, not the adiabatic equation of state of every intergalactic phase. Lyman-alpha forest line widths constrain both the temperature at a reference density and the slope through their lower envelope.
The Weierstrass transform is Gaussian convolution, . It smooths appropriate functions and is the heat semigroup at unit time. The Brownian transition semigroup uses variance- Gaussian kernels and therefore supplies the scaled time family.
Pinned article: Introduction to the OurBigBook Project
Welcome to the OurBigBook Project! Our goal is to create the perfect publishing platform for STEM subjects, and get university-level students to write the best free STEM tutorials ever.
Everyone is welcome to create an account and play with the site: ourbigbook.com/go/register. We belive that students themselves can write amazing tutorials, but teachers are welcome too. You can write about anything you want, it doesn't have to be STEM or even educational. Silly test content is very welcome and you won't be penalized in any way. Just keep it legal!
Intro to OurBigBook
. Source. We have two killer features:
- topics: topics group articles by different users with the same title, e.g. here is the topic for the "Fundamental Theorem of Calculus" ourbigbook.com/go/topic/fundamental-theorem-of-calculusArticles of different users are sorted by upvote within each article page. This feature is a bit like:
- a Wikipedia where each user can have their own version of each article
- a Q&A website like Stack Overflow, where multiple people can give their views on a given topic, and the best ones are sorted by upvote. Except you don't need to wait for someone to ask first, and any topic goes, no matter how narrow or broad
This feature makes it possible for readers to find better explanations of any topic created by other writers. And it allows writers to create an explanation in a place that readers might actually find it.
Figure 1. Screenshot of the "Derivative" topic page. View it live at: ourbigbook.com/go/topic/derivativeVideo 2. OurBigBook Web topics demo. Source. - local editing: you can store all your personal knowledge base content locally in a plaintext markup format that can be edited locally and published either:This way you can be sure that even if OurBigBook.com were to go down one day (which we have no plans to do as it is quite cheap to host!), your content will still be perfectly readable as a static site.
- to OurBigBook.com to get awesome multi-user features like topics and likes
- as HTML files to a static website, which you can host yourself for free on many external providers like GitHub Pages, and remain in full control

Figure 2. You can publish local OurBigBook lightweight markup files to either OurBigBook.com or as a static website.
Figure 3. Visual Studio Code extension installation.
Figure 5. . You can also edit articles on the Web editor without installing anything locally. Video 3. Edit locally and publish demo. Source. This shows editing OurBigBook Markup and publishing it using the Visual Studio Code extension. 
- Infinitely deep tables of contents:




All our software is open source and hosted at: github.com/ourbigbook/ourbigbook
Further documentation can be found at: docs.ourbigbook.com
Feel free to reach our to us for any help or suggestions: docs.ourbigbook.com/#contact