
Additivity of the Lie exponential map 2026-10-14
The Exponential map of a Lie group is a group homomorphism from the additive Lie algebra exactly when its identity component of a Lie group is abelian. If it is additive, its image is an abelian subgroup containing an identity neighborhood by the local exponential chart; connectedness makes that image the entire identity component. Conversely, in an abelian identity component the product is a one-parameter subgroup with derivative , giving the identity by uniqueness. The disconnected Lie group shows that the full group need not be abelian.
Doubling time Created 2026-10-14 Updated 2026-11-05
The interval required to double a quantity under constant-rate exponential growth. Solving with the natural logarithm gives . At per time unit, it is approximately time units; every subsequent doubling takes the same interval.
Scaled deviance 2026-10-14
For an exponential dispersion family with a common dispersion parameter , scaled deviance compares a fitted model with the saturated statistical model at the same dispersion:For a normal distribution with variance , unscaled deviance is the residual sum of squares and scaled deviance is that sum divided by . For the binomial distribution, and the two coincide. Unknown Gaussian dispersion requires variance estimation; raw deviance differences should not be treated as chi-squared statistics without the scale.
For an impulsive leaky porous gravity current, write and , where . At a fixed lateral location, when . The maximum invaded thickness is the envelope , . The source solution is singular at the initial line release; finite source size and aquifer depth limit its near-source validity.
Maximum of two exponentials as a scaled sum Created 2026-10-14 Updated 2026-11-05
For independent exponential random variables with the same rate , the convolution density of is for . The cumulative distribution function of is , whose derivative is the same density. This is equality of probability distributions, not an almost-sure equality of the two expressions formed from the same sample.
Slow exponential plus an exponential sample mean Created 2026-10-14 Updated 2026-10-20
Let be a fixed sum of independent exponential random variables with smallest rate , and let be the sum of independent rate- exponential random variables, independent of , with fixed and . At large-deviation speed , has rate function for ; the sample mean has rate function for . The product large-deviation principle and contraction principle for large deviations giveIndeed the derivative of the quantity minimized with respect to is . Its minimizer is . Beyond that transition, a single slow exponential random variable carries the extra excursion; the rate function becomes affine.
Exponential dispersion family of order one 2026-10-14
An order-one exponential dispersion family has a scalar natural parameter and canonical sufficient statistic ; its density or mass function has the displayed form on parameter-independent support. Differentiating its normalization gives and . Known observation weights replace by . Its variance function is , and its canonical link function is .
For an affine autoregressive process , suppose its initial zero-coupon bond prices are positive and finite. A deterministic shift of the rate changes the bond price to . To fit any positive curve with , put , , and . Adding the deterministic drift to the rate recursion realizes precisely this shift, and telescoping gives the desired curve. No stationary autoregression assumption is needed.
Indifference price 2026-10-14
A utility indifference price for a claim is the cash amount at which optimally buying the claim leaves the investor with the same maximal expected utility as trading without it.
Complete-market terminal utility optimizer 2026-10-14
For an increasing strictly concave utility function satisfying the Inada conditions, put and let be the positive terminal state-price density. In a finite complete market, select so that equals initial wealth. The displayed payoff is optimal under that budget: the supporting-line inequality for utility has marginal slope , and its expected linear error vanishes on the budget constraint. Market completeness supplies its replicating strategy.
Unbounded linear terminal-wealth utility 2026-10-14
If a positive terminal state-price density has essential infimum zero, let and . Whenever , these claims cost and satisfy . In a Brownian complete market with constant nonzero market price of risk, has a lognormal distribution and all these events have positive probability. Thus bounded market coefficients and an increasing concave utility do not alone ensure a finite attained optimum: the linear utility already fails. Usual inverse-marginal-utility formulas require further utility and integrability hypotheses.
Hitting a hub from two four-cycles Created 2026-10-14 Updated 2026-11-05
Take two four-cycles, connect corresponding vertices, and connect each inner vertex to an absorbing hub. For the ordinary random walk on a graph, symmetry reduces mean remaining times to outer and inner types, satisfying and . Thus , . For the non-backtracking random walk, directed-edge types outer-outer, outer-inner, inner-outer and inner-inner give remaining means . Starting at an outer vertex, the first-step distribution yields total mean .
Constant-drift hitting-time identity Created 2026-10-14 Updated 2026-11-05
For a finite Markov chain, let be the first hitting time of , assume almost surely, on and on its complement, with . The stopped martingale has mean . Boundedness of and bounded convergence theorem give ; monotone convergence then gives the stated finite expected hitting time. No drift condition is required after entry into .
Estimating a quantum expectation value 2026-10-14
Prepare a fresh copy of the same quantum state for each trial and measure the same observable. If preparations and readouts are independent, the outcomes are independent and identically distributed random variables with the Born rule probability distribution. Their sample mean is an unbiased estimator of the expectation value:The law of large numbers explains convergence of the sample mean, while the standard error describes its finite-sample spread. It takes four times as many independent trials to halve that standard error. This reduces estimation error; it does not reduce the quantum uncertainty of a single prepared copy.
For the spin expectation value, let and be the two outcome counts, with . ThenThe binomial distribution gives the exact sampling model. For , the standard error is : approximately for and for . A run can fluctuate away from the predicted mean even as its typical spread decreases.
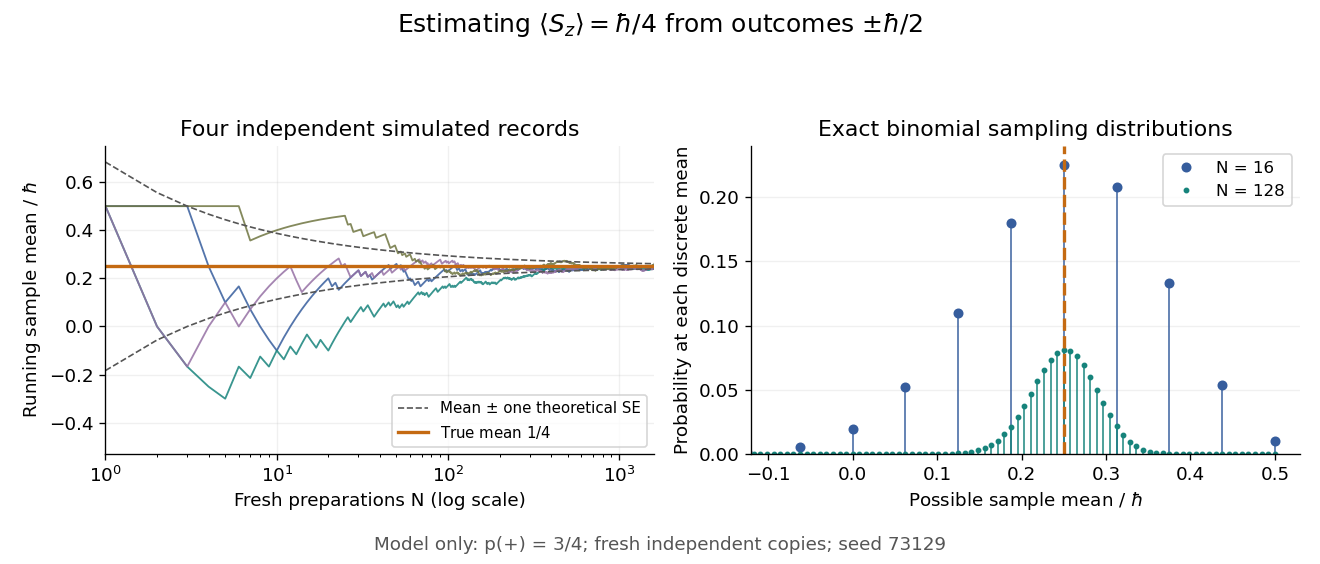

Repeatedly measuring one surviving system is a different protocol. Under the ideal Lüders rule, outcome leaves when . With no intervening change of observable or dynamics moving the state out of that eigenspace, the next projective measurement returns with certainty. Such a record is correlated and does not sample the original Born rule distribution independently. The quantum nondemolition measurement discussion describes this repeatability; fresh quantum state preparations supply the ensemble needed for the estimator above.
Spin expectation value 2026-10-14
For spin one-half, choose the normalized spin eigenstates with . The spin one-half along an axis pure state in the plane isIts norm is one because the two eigenstates are orthogonal and . Applying the Born rule to a projective measurement givesConsequently the expectation value, second moment, and variance areAt , the outcome probabilities are and , the mean is , and the variance is . Every individual outcome remains . At , the mean is zero and the variance is maximal, . At either pole, one outcome has probability one and the variance vanishes.
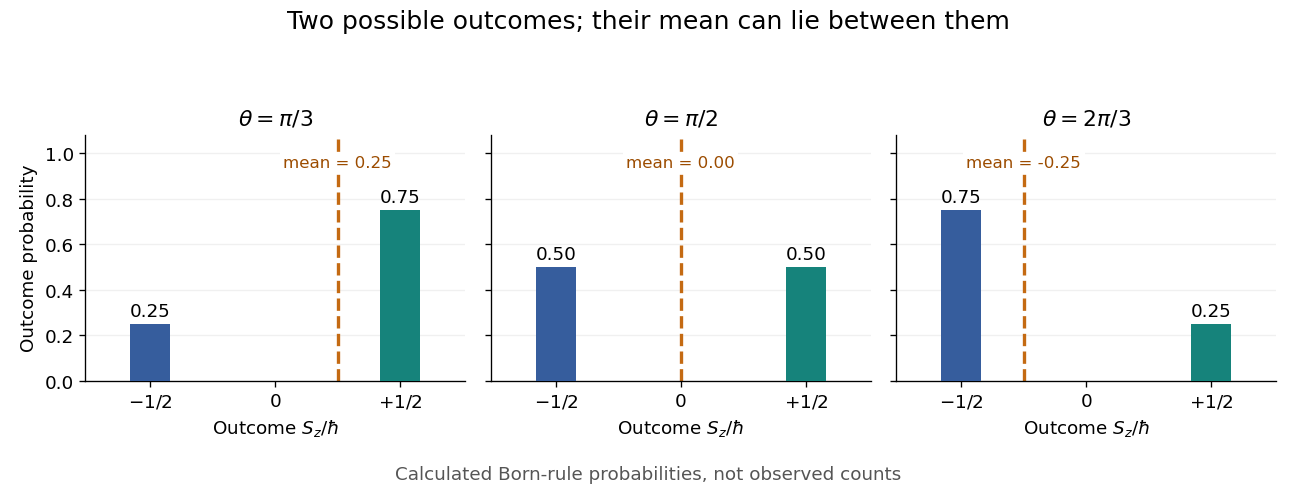
Spin expectation value between the two possible outcomes
. Original calculated Born rule distributions at three preparation angles. Bar heights are outcome probabilities; the dashed orange line marks the expectation value, whose horizontal position is usually not an allowed outcome. Spin values are expressed in units of the reduced Planck constant. No bars represent experimental observations. Source. Details.
The diagonal mixed state has the same probabilities, expectation value, and variance as . It is nevertheless a different quantum state for : the displayed pure state has , while has . A single component's mean does not reveal all relative quantum phases or establish purity of a density operator.
For independent normal coordinates, an unobserved first coordinate has conditional law equal to its current marginal normal distribution, even when the second coordinate of that observation is known. Thus its E-step first moment is and second moment is . With three observed first coordinates and one missing value, the mean update is and the variance update is . The conditional variance term is essential: filling in only the conditional mean is not the expectation-maximization algorithm.
EM for merged multinomial cells 2026-10-14
For a multinomial distribution with two unobserved cells merged into one observed count, the conditional allocation is a binomial distribution with probabilities proportional to the two cell probabilities. The expectation-maximization algorithm replaces the missing counts by their conditional expectations in the parameter-dependent part of the complete-data log-likelihood. The expectation of a log-factorial normalization generally differs from its value at the expected count, but this difference is independent of the candidate parameter and does not affect the maximization step.
Ordered-rate exponential M-step 2026-10-14
For observations from each of two labeled exponential distributions, an E-step may produce positive completed time totals . Its expected complete-data log-likelihood is . This is strictly concave. On the closed ordering constraint , its maximum is when ; otherwise it lies at . To see the boundary case, first maximize along the equality line. At that maximum, moving into either feasible rate-separating direction has directional derivative , so concavity proves global optimality. For the open constraint , this boundary value is a supremum rather than an attained M-step.
// Target: probability-and-statistics.bigb
Known-variance Gaussian mixture EM example 2026-10-14
Choose six illustrative values , fixed mixture weights , known standard deviation , and initial means . These are constructed data for a Gaussian mixture distribution, not measurements. With the standard normal distribution probability density function, the fitted log-likelihood isAt the initial means, the component density ratio is . The first E-step therefore gives
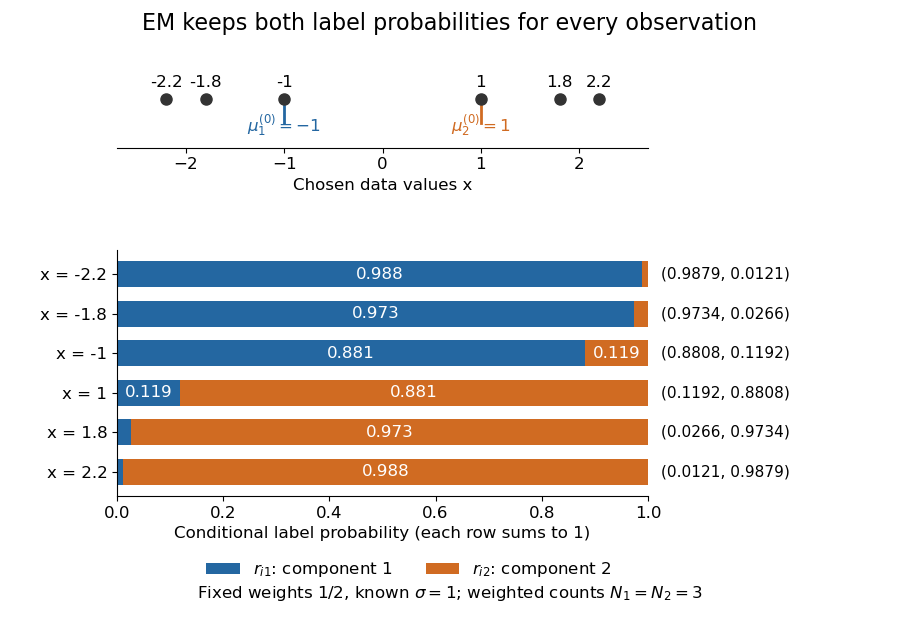

The paired values and have complementary mixture responsibilities, so exactly. The first M-step givesThe hyperbolic tangent expression follows by pairing the contributions at and . Assigning every negative value wholly to the first mixture component and every positive value wholly to the second would instead give means . Those hard assignments discard the overlap: the expectation-maximization algorithm is not the same update as K-means clustering.
The observed-data log-likelihood rises from initially to after one update and after two. Further updates approach means , with log-likelihood approximately . These values describe this initialization; EM likelihood monotonicity supplies no certificate of a global maximum.
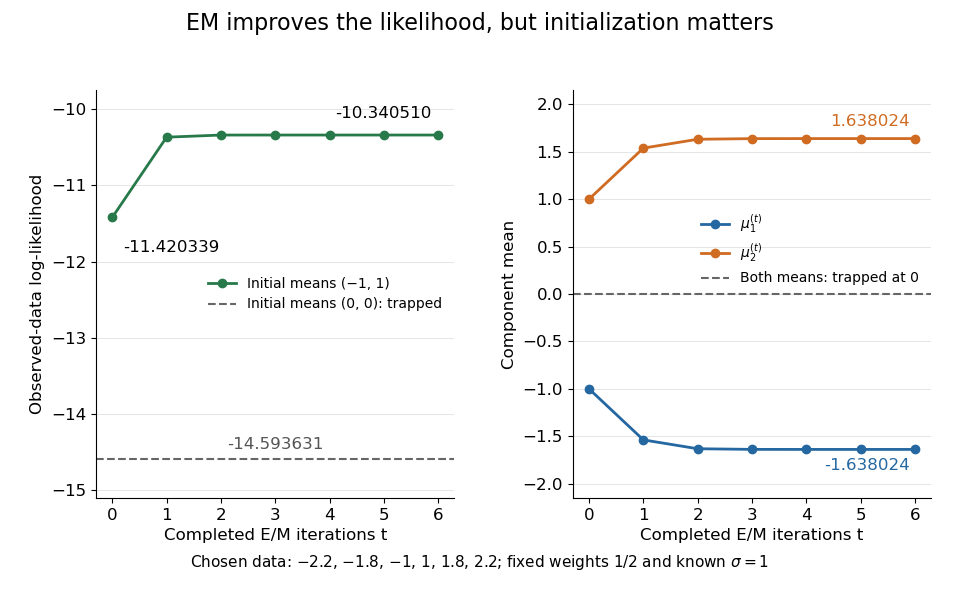
Likelihood ascent and mean updates for the chosen data, compared with an identical-means initialization
. Iteration zero is the initial fit; each subsequent point follows one E-step and one M-step. Starting at minus one and one increases the likelihood. Starting both means at zero leaves them at zero with a lower constant likelihood. All runs keep variance one and weights one half. Details.
For stable numerical evaluation, put and . The log-sum-exp function givesSubtracting keeps at least one exponential equal to one, avoiding the all-zero sum that direct evaluation of tiny component densities can produce.
EM maximization step 2026-10-14
Maximize over the permitted statistical parameters, with the E-step conditional distribution held fixed.[ref]
Maximum Likelihood from Incomplete Data via the EM Algorithm by Arthur Pentland Dempster and others. Section 2, printed p. 6: general maximization step
A finite mixture model hasFor normal distributions with known common variance and fixed positive mixture weights, only the means are fitted. Dropping terms independent of these candidate means givesThe derivative in is , and its second derivative is . Thus a positive weighted count gives a unique maximizing weighted mean. This is a maximization of the surrogate ; the observed-data log-likelihood need not be concave. Recompute the mixture responsibilities after updating the means. The broader EM for Gaussian mixtures with a common variance also estimates mixture weights and the shared variance. There are unlisted articles, also show them or only show them.