Source: Oxford's released examination PDF, pages 203–206, dated 24 June 2021. The cover is on page 203; questions 1, 2 and 3 are on pages 204, 205 and 206 respectively. All three questions and all 19 smallest answer parts are solved below, including the third question although only the best two counted towards the examination mark. The original PDF confirms the inconsistent return-field name in 3(c)(ii), addressed there.
Write . The two multivariate normal distribution probability density functions have ratioHere is the Euclidean norm. Consequently the smallest rejection sampling envelope constant, and its acceptance probability, areThe supremum is attained at ; hence no smaller constant can dominate the ratio. Draw and an independent from the uniform distribution on . Accept whenotherwise repeat with fresh independent random variables. One can generate using a random vector with independent standard normal distribution coordinates.
For any measurable set , the joint acceptance probability is . Dividing by proves that the returned random vector has probability density function . The number of proposals has a geometric distribution on the positive integers, with expected value . When , every proposal is accepted.
The moment-generating function of a standard normal distribution gives . Using independence of the coordinates,The accepted draws are independent and identically distributed random variables, so their sample mean is an unbiased estimator and has varianceThis counts accepted draws, requiring proposals in expectation.
An importance weight has expected value . From the ratio in (a),The supplied normal distribution transform applies with quadratic coefficient , giving each factor . ThusFor , the base exceeds one because : importance weight variance increases exponentially with dimension. For , the importance weight is identically one and its variance is zero. This calculation concerns the importance weight, rather than the weighted integrand.
For the new integrand, and , independently of dimension. Chebyshev's inequality therefore yieldsA sufficient positive integer sample count isThe ceiling function ensures that the bound is at most , so the strict-error event in the question has probability at least . The required number of accepted draws is independent of ; their expected proposal count is .
At equal sample count, rejection sampling eventually has smaller variance for fixed ; at equal expected proposal cost, importance sampling eventually wins. The distinction matters because a sample of the rejection sampling estimator means an accepted draw.
For the importance sampling estimator, all coordinates contribute to the importance weight although only one enters the integrand. The same normal distribution transform as in (c), now with linear coefficient for coordinate one, givesBoth estimators are unbiased estimators of , andFor fixed , the first variance grows exponentially while the second stays constant. This is the benefit of returning exact target draws in rejection sampling. However, obtaining those draws costs proposals each on average.
To compare computational work, multiply each variance by its expected proposal count. For importance sampling that count is ; for rejection sampling it is . The ratio of the resulting cost-normalized variances isbecause . Thus importance sampling eventually gives better precision for the same expected number of proposals, assuming comparable work per proposal. This is an asymptotic cost comparison, not a guarantee that a fixed small computing budget produces any accepted draws. Both methods still deteriorate exponentially in this comparison. For they coincide and every proposal is accepted.
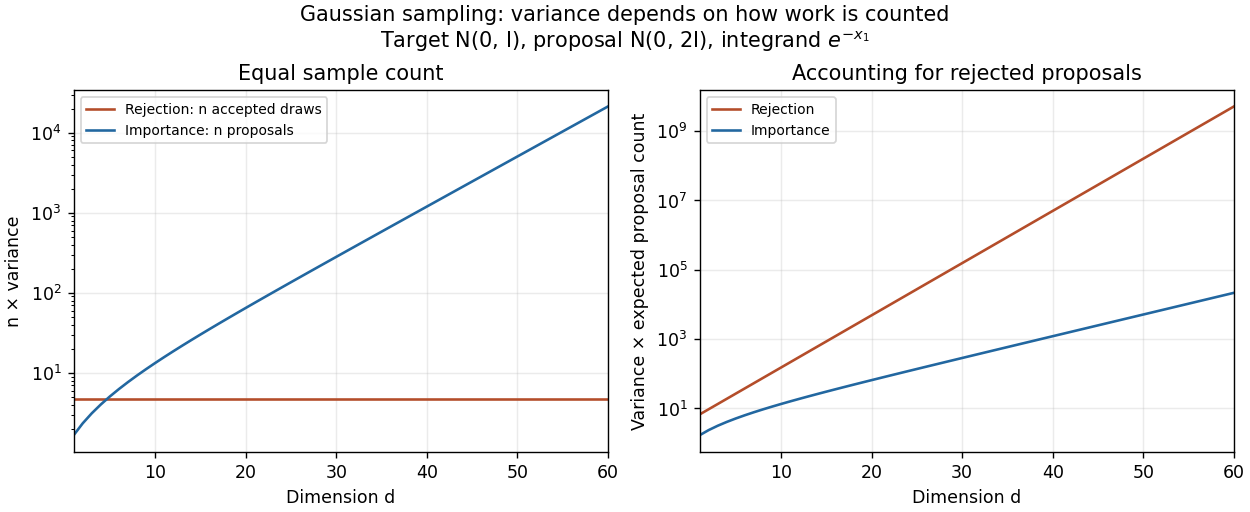
Sample-count and expected-proposal-cost comparisons for the one-coordinate integrand at sigma squared equal to two
. Details. 
A practical improvement is to exploit the integrand's one-coordinate structure directly: average for standard normal distribution draws , without generating unused coordinates. The optimal change of proposal distribution in (iii) improves further.
The integrand is positive, so the minimum-variance importance distribution is its target-weighted probability density function, normalized by :By completing the square,Thus is the multivariate normal distribution , where is the first standard basis vector. Its importance weight and weighted integrand areA variance cannot be negative, and this proposal makes every summand constant, proving optimality directly. It is admissible under the arbitrary-proposal condition even though its mean vector is not zero. Although optimal proposals usually involve an unknown normalizing integral, here both that integral and the resulting normal distribution are explicit.
For the exponential distribution with rate , the cumulative distribution function is for , and zero for . Its quantile function isFor inverse transform sampling, draw from the uniform distribution on and return . Equivalently return , since has the same uniform distribution. Indeed, for , .
Integrating the conditional distribution against the exponential distribution probability density function gives, for integer ,Here the gamma function identity evaluates the integral. Henceon . Put and . The geometric series gives . Its generalized inverse, the quantile function, isThis is the smallest nonnegative integer for which ; dividing by reverses the inequality. Draw from the uniform distribution on and use this formula. The commonly used expression has the same probability distribution, but differs from the exact generalized inverse when is precisely a jump value of the cumulative distribution function. Such values have probability zero for an ideal continuous uniform draw.
Write . The target Poisson distribution and proposal geometric distribution have probability mass functions and . Their ratio isThe successive ratio shows that a maximizing integer is , with a tie at when is an integer. Thus the tight envelope isFor any fixed , draw using (ii)'s inversion formula with this new parameter, and draw an independent from the uniform distribution on . Accept whenotherwise restart. The acceptance probability is and the expected number of proposals is .
To minimize that expected count, set . The exact answer isHere is a proof that includes the changes of maximizing integer. Each is a convex function of , since its second derivative is . Their pointwise maximum is also a convex function. When is fixed its derivative isIf , take , where changes from on the left to on the right. The left derivative is nonpositive because ; the right derivative is nonnegative because . This is a minimum. If , take . There and the active branch has except for the endpoint tie; its derivative vanishes. Convexity again proves the global minimum. The formulas agree at the boundary.
For a fully specified optimal algorithm, compute and once, then use the preceding acceptance test with and . At an integer tie either maximizing integer gives the same test. In code, factorials can be evaluated through the logarithm of the gamma function:and acceptance is . This avoids overflowing factorials.
The optimum minimizes expected trials, the usual idealization of time when each proposal and test has constant cost. Actual runtime also depends on the implementation of discrete inversion and factorial evaluation. Simply minimizing an upper bound for would not necessarily give the exact optimum above; see optimal geometric envelope for a Poisson distribution.
Because , the conditional acceptance probability is , even when the printed threshold exceeds one. Repeating rejected trials gives the clipped acceptance reweighting identity:For , , including . The denominator is , soFor every proposal is accepted, so reweighting by would be incorrect. At both formulas agree. Termination has probability one since the acceptance probability is in the first case and one in the second.
Define . Given , the direct-return branch has probability , while the fallback branch distributes its remaining mass uniformly over . The law of total probability therefore gives, for integer ,The summation includes : a failed direct-return test can still return through the discrete uniform distribution draw. There is no rejection loop and no additional normalization. Summing the displayed probability mass function over gives . At , for example, at every ; it does not become one. This is an instance of the accept-or-fallback mixture identity.
Let . Sinceintegration from zero to gives . Letting and imposing unit total probability givesThe probability density function is positive for because . Consequently the cumulative distribution function is increasing, starts at zero and tends to one. This verifies that the derived normalizing constant defines a probability distribution. The family is the exponential-logarithmic distribution with the complementary mixing parameter .
Solving gives . Hence the quantile function isFor such , , making the logarithm's argument lie in and the output positive. Its endpoint limits are and . Substitution into (i)'s cumulative distribution function recovers .
The following R function performs inverse transform sampling with vectorized numerical computation. It checks finite real scalar parameters, including a nonnegative integer sample count, and gives
beta its requested default.r_sample_f <- function(n, p, beta = 1) {
scalar <- function(v) {
is.numeric(v) && !is.complex(v) && length(v) == 1L &&
is.finite(v)
}
if (!scalar(n) || n < 0 || n != floor(n))
stop("n must be a nonnegative integer")
if (!scalar(p) || p <= 0 || p >= 1)
stop("p must lie strictly between 0 and 1")
if (!scalar(beta) || beta <= 0)
stop("beta must be positive")
if (n == 0) return(numeric(0))
v <- runif(n)
(log1p(-p) - log(-expm1(v * log(p)))) / beta
}Here is again a uniform distribution draw, so the expression is the quantile function from (ii). The function
expm1(t) evaluates accurately when is small, avoiding cancellation in ; log1p(-p) evaluates . For default bounds, runif excludes both endpoints, so this implementation does not deliberately generate the infinite endpoint of the quantile function. It returns a numeric vector of length n, including an empty vector when n = 0. [ref]https://stat.ethz.ch/R-manual/R-devel/library/stats/html/Uniform.html. Official R documentation: default runif draws exclude both endpoints
[ref]https://stat.ethz.ch/R-manual/R-devel/library/base/html/Log.html. Official R documentation: log1p and expm1 accurately evaluate small differences
A numerical power series evaluation needs a stopping rule. For and integer , the absolute remainder after terms satisfies the polylogarithm series remainder boundIndeed for , and the remaining powers sum as a geometric series. This also covers negative . The code sums terms in vectors of at most 4096 entries, checking the bound after each block; there is no loop over individual terms.
polylog <- function(a, z, tol = 1e-10, max_terms = 1000000) {
  scalar <- function(v) {
    is.numeric(v) && !is.complex(v) && length(v) == 1L &&
      is.finite(v)
  }
  if (!scalar(a) || a < 0 || a != floor(a))
    stop("a must be a nonnegative integer")
  if (!scalar(z) || abs(z) >= 1)
    stop("z must be real with abs(z) < 1")
  if (!scalar(tol) || tol <= 0 || tol >= 1)
    stop("tol must lie strictly between 0 and 1")
  if (!scalar(max_terms) || max_terms < 1 ||
      max_terms != floor(max_terms))
    stop("max_terms must be a positive integer")
  if (z == 0) return(0)
  r <- abs(z)
  N <- 0
  ans <- 0
  repeat {
    if (N >= max_terms)
      stop("requested truncation tolerance not reached")
    B <- min(4096, max_terms - N)
    k <- seq.int(N + 1, N + B)
    ans <- ans + sum(z^k * exp(-a * log(k)))
    N <- N + B
    log_bound <- (N + 1) * log(r) - a * log(N + 1) - log1p(-r)
    if (log_bound <= log(tol)) return(ans)
  }
}
This accepts every positive integer order in the question, and also order zero if is the convention adopted. The bound controls absolute truncation error; floating-point rounding is a separate source of error. Close to , convergence can be slow. If the resource limit is reached, the function reports failure instead of silently claiming the requested accuracy. Useful exact checks are and .
Let and , evaluated from the given polylogarithm formulas. Generate a large sample of independent and identically distributed random variables with
r_sample_f, and compute its sample mean and sample variance using mean and var. The central limit theorem gives the first standardized check:For the second check, the correct asymptotic variance of the sample variance involves the fourth central moment :The denominator is not unless the probability distribution has the requisite fourth central moment, as does the normal distribution. Here the probability density function decays exponentially, so all required moments are finite.To compute , expand the denominator of the probability density function as a geometric series and integrate each nonnegative term. The gamma function integral gives the raw momentsThus and . The following R code implements both checks for chosen interior parameters and large
n:p <- 0.4
beta <- 1.3
n <- 100000
raw_m <- vapply(1:4, function(j) {
-factorial(j) * polylog(j + 1, 1 - p) / (beta^j * log(p))
}, numeric(1))
m <- raw_m[1]
v <- raw_m[2] - m^2
mu4 <- raw_m[4] - 4 * m * raw_m[3] +
6 * m^2 * raw_m[2] - 3 * m^4
x <- r_sample_f(n, p, beta)
c(mean_check = sqrt(n) * (mean(x) - m) / sqrt(v),
variance_check = sqrt(n) * (var(x) - v) / sqrt(mu4 - v^2))For each check separately, an absolute value below is consistent with its approximate confidence interval. Repeat with many independent samples: the two standardized statistics should each resemble a standard normal distribution, with about outside that range. Also vary , and
n; a systematic discrepancy that grows with suggests a bias. The two checks from the same sample are generally dependent, so passing both is not itself a joint statement, nor can a finite test prove that a generator is correct.The second central limit theorem follows from the central limit theorem for the sample variance: differs by a quantity tending to zero in probability from .
Taking the logarithm of the normalized probability density function, then summing over the independent observations, gives the log-likelihoodBoth and are parameters being inferred, so their contributions to the normalizing constant must be retained. The following R implementation validates the arguments and returns one number:
ll_f <- function(p, beta, x) {
  scalar <- function(v) {
    is.numeric(v) && !is.complex(v) && length(v) == 1L &&
      is.finite(v)
  }
  if (!scalar(p) || p <= 0 || p >= 1)
    stop("p must lie strictly between 0 and 1")
  if (!scalar(beta) || beta <= 0)
    stop("beta must be positive")
  if (!is.numeric(x) || is.complex(x) || !is.null(dim(x)) ||
      any(!is.finite(x)) || any(x <= 0))
    stop("x must be a vector of finite positive numbers")
  if (length(x) == 0L) return(0)
  t <- log1p(-p) - beta * x
  length(x) * (log(beta) - log(-log(p))) +
    sum(t - log(-expm1(t)))
}
Here and
-expm1(t) computes accurately near zero. The empty-data likelihood function is one, so its log-likelihood is zero. Invalid parameter values produce errors in this evaluator; the next algorithm rejects candidates outside the parameter support before calling it.Assume and a current state with , . The unnormalized posterior density isThus the log-posterior, up to an additive constant, is the log-likelihood plus the beta distribution and exponential distribution log prior densities. The exponential distribution rate is , since is its mean. [ref]
https://stat.ethz.ch/R-manual/R-devel/library/stats/html/Beta.html. Official R documentation: dbeta arguments and logarithmic density output
[ref]https://stat.ethz.ch/R-manual/R-devel/library/stats/html/Exponential.html. Official R documentation: dexp rate parameter and mean equal to inverse rate
Choose a symmetric joint random-walk Metropolis algorithm proposal: and , for independent standard normal distribution draws. Its scale depends only on fixed hyperparameters, so forward and reverse proposal probability density functions agree. Reject immediately outside ; otherwise accept with Metropolis–Hastings acceptance probabilityThe following function makes exactly one proposal, with rejection retaining both old parameters:
MHstep <- function(x, p, beta, a, b, mu) {
  p_new <- rnorm(1, mean = p, sd = 0.1)
  beta_new <- rnorm(1, mean = beta, sd = mu / 2)
  if (p_new <= 0 || p_new >= 1 || beta_new <= 0)
    return(list(p = p, theta = beta))
  logpost <- function(pp, bb) {
    ll_f(pp, bb, x) + dbeta(pp, a, b, log = TRUE) +
      dexp(bb, rate = 1 / mu, log = TRUE)
  }
  logA <- logpost(p_new, beta_new) - logpost(p, beta)
  if (log(runif(1)) <= min(0, logA)) {
    p <- p_new
    beta <- beta_new
  }
  list(p = p, theta = beta)
}
The returned field
theta contains the updated value of beta. The original PDF really asks for p and theta, although no parameter is defined in this question. This choice preserves its literal interface while making the intended second parameter explicit. A caller therefore advances with state <- MHstep(x, p, beta, a, b, mu), p <- state$p, and beta <- state$theta.The proposal is an unrestricted symmetric normal distribution followed by rejection outside the support. Repeatedly drawing until a valid proposal appears would instead truncate and renormalize the proposal, requiring a proposal-density correction. The code uses immediate rejection and needs no such correction. The displayed scales are valid fixed choices; practical efficiency can be improved using a separate tuning phase.
Use several complementary Markov chain Monte Carlo convergence diagnostics, monitoring both and rather than judging the chain solely by its length:
- Trace plots of each parameter and the log-posterior against iteration, including early iterations and later windows. Look for initial drift, long flat stretches, abrupt switches and sustained changes in spread. Several independent chains started at dispersed points should explore the same region after burn-in.
- Plots of cumulative sample means and selected sample quantiles against iteration. Compare chains and successive long blocks; persistent movement indicates that the estimated posterior moments or tails have not stabilized.
- Autocorrelation function plots for both parameters after tentative burn-in. Slow decay reveals strong serial dependence and a small effective sample size of a Markov chain, even when iterations have been generated.
- Overlaid histograms or kernel density estimation curves from successive retained blocks and from different chains. Their agreement provides evidence of stable marginal posterior distributions.
- A scatter plot of retained pairs, colored by time block if helpful. Strong dependence or separate clusters can expose slow joint exploration that marginal plots conceal.
A million iterations and stable-looking plots do not prove convergence. Agreement across dispersed chains, exploration of all visible modes and adequate effective sample size of a Markov chain provide stronger evidence. Estimate the Monte Carlo standard error using the chain's autocorrelation; the independent random variables formula from 3(b)(ii) does not apply directly to these dependent draws.
Articles by others on the same topic
There are currently no matching articles.