
Birkhoff recurrence theorem 2026-10-14
Every continuous self-map of a nonempty compact metric space has a recurrent point. Choose a minimal subsystem. The forward orbit of every point in it is dense, and the same is true of every tail of that orbit; consequently each neighborhood is revisited at arbitrarily large times. A nonempty subsystem is all that is guaranteed: the identity map on a singleton has no larger subsystem.
Transverse electric mode of a rectangular waveguide Created 2026-10-14 Updated 2026-10-18
A transverse electric mode of a rectangular waveguide has while its axial magnetic field is generally nonzero. For time dependence and axial dependence , set . The Maxwell equations reconstruct the transverse components from :The axial complex amplitude satisfies a transverse Helmholtz equation, . Zero tangential electric field at each perfect conductor wall becomes a Neumann boundary condition on . Separation of variables givesThe index counts half-periods across , and across . Either index can vanish, allowing ; both cannot vanish. Indeed a spatially constant axial oscillating magnetic field would give nonzero changing magnetic flux through the cross-section, whereas the line integral of tangential electric field around its metal boundary is zero. The integral form of Faraday's law excludes this candidate. Dividing the reconstruction formulas by would be invalid and cannot produce the separate transverse electromagnetic mode.
For , choose . The formulas recover exactly the , and in rectangular electromagnetic waveguide. In particular, the transverse magnetic field accompanies and ensures zero divergence; an oscillating longitudinal magnetic field on its own is not the guided solution.
Waveguide cutoff frequency Created 2026-10-14 Updated 2026-10-18
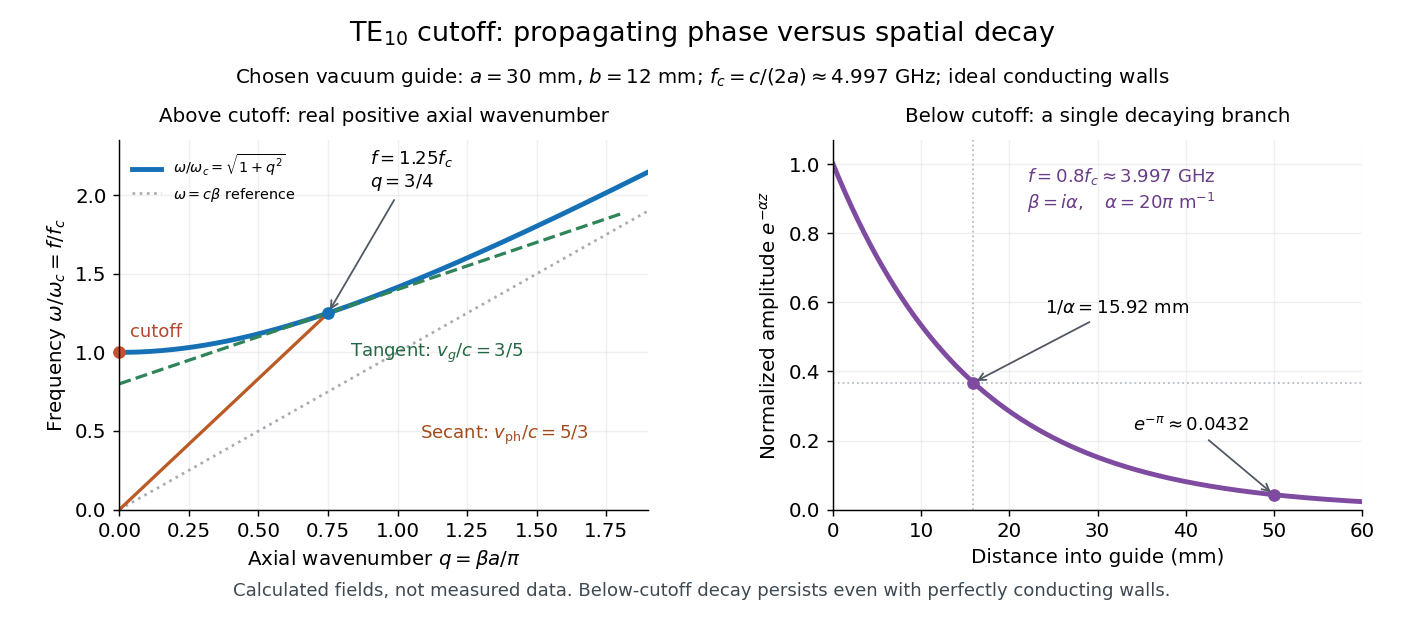
The waveguide cutoff frequency separates oscillatory axial propagation from exponential decay for a particular normal mode. For the vacuum-filled rectangular electromagnetic waveguide, the dispersion relation isFor a transverse electric mode of a rectangular waveguide, are nonnegative integers but not both zero. For a mode with and nonzero , both indices must be positive. The lowest cutoff for is consequently , or ordinary frequency .
A square cross-section instead gives equal and cutoffs. The absence of a transverse electromagnetic mode is specific to this hollow pipe, rather than all electromagnetic waveguides.[ref]
Rectangular Waveguide Modes. Haus and Melcher, Electromagnetic Fields and Energy, §13.4, equations (26)–(27) and Fig. 13.4.3: allowed indices, dominant mode and square-guide degeneracy
For , choose real for propagation toward . For , a field decaying into a semi-infinite guide hasA finite section can contain both growing and decaying axial solutions set by its two ends; the single decaying solution is not a complete finite-section transmission calculation. At exact cutoff , the two axial solutions become a constant and a linear function of : there is no finite axial wavelength for a traveling sinusoid.
In the chosen guide at , the branch has . Its amplitude decay length is ; after , its normalized wave amplitude is . This is geometric evanescence even with ideal walls, not Joule heating. A single decaying branch has zero cycle-averaged axial Poynting vector: substituting makes a quarter-cycle out of phase with . Coupling across a finite section requires the complete boundary-value solution.

Small baryon abundance delays hydrogen recombination Created 2026-10-14 Updated 2026-11-05
For hydrogen ionization fraction of order one, the hydrogen-only Saha equation gives . The baryon-to-photon ratio and photon number density imply . Therefore and the displayed logarithmic balance follows. A small supplies many ionizing photons per baryon, so neutral hydrogen forms at a temperature much smaller than its Hydrogen binding energy. The numerical temperature depends on the ionization-fraction convention and on whether equilibrium remains valid.
Reversible receptor phosphorylation model 2026-10-14
Protein kinase activity adds modification, while protein tyrosine phosphatase activity can remove it. An original one-site model shows why a receptor phosphorylation assay cannot determine either process from a single modified fraction. Let be the fraction of a fixed receptor population carrying one selected phosphotyrosine residue. Stipulate constant effective first-order rate constants , with ATP availability absorbed into , and no receptor synthesis, degradation or trafficking:Here is the steady state fraction and the time constant. The ordinary differential equation has the exponential function solutionThe balance equation and a single relaxation step give this result; it is an illustrative model, rather than a fit or a claim about every RTK.
With stipulated rate constants , and . Doubling both rate constants leaves but changes to . The balanced phosphate turnover per site,doubles from to . Identical steady state modification therefore permits different catalytic fluxes. Removing the addition term instead gives ; this illustrates why a perturbation that stops protein kinase activity can expose removal dynamics, subject to the model's unchanged-removal assumption. A maintained steady state with ongoing ATP consumption is not chemical equilibrium.
Receptor phosphorylation assay 2026-10-14
A receptor phosphorylation assay asks whether, and how much, a specified receptor is modified by phosphorylation under defined conditions. It is distinct from a binding assay for receptor binding occupancy, a test of protein kinase activity on a supplied substrate, and a test of downstream signal transduction. Those measurements answer related but different questions.
For a Western blot implementation, compare matched samples with ligand omitted or added, detect a specified phosphorylated epitope, and separately detect total receptor abundance. Preserve the sampled state by stopping further enzyme reactions during sample preparation; otherwise protein kinase or protein phosphatase activity after sampling can change the result. A general anti-phosphotyrosine residue antibody recognizes many modified proteins; a site-selective antibody gives a narrower readout, but still needs Western blot antibody specificity controls.
Reason through the controls before interpreting the difference. Loss of the proposed signal after receptor-specific gene deletion supports protein identity. Treatment with a protein phosphatase, alongside preservation of the total-receptor signal, tests phosphate-dependent recognition. Western blot loading controls and Western blot transfer controls address sample recovery; a usable detection range addresses Western blot response saturation. Lower signal after perturbing protein kinase activity supports dependence on that perturbation, but alternative targets and altered receptor abundance can complicate the inference. These are proposed assay comparisons, not outcomes attributed to the historical membrane experiment.
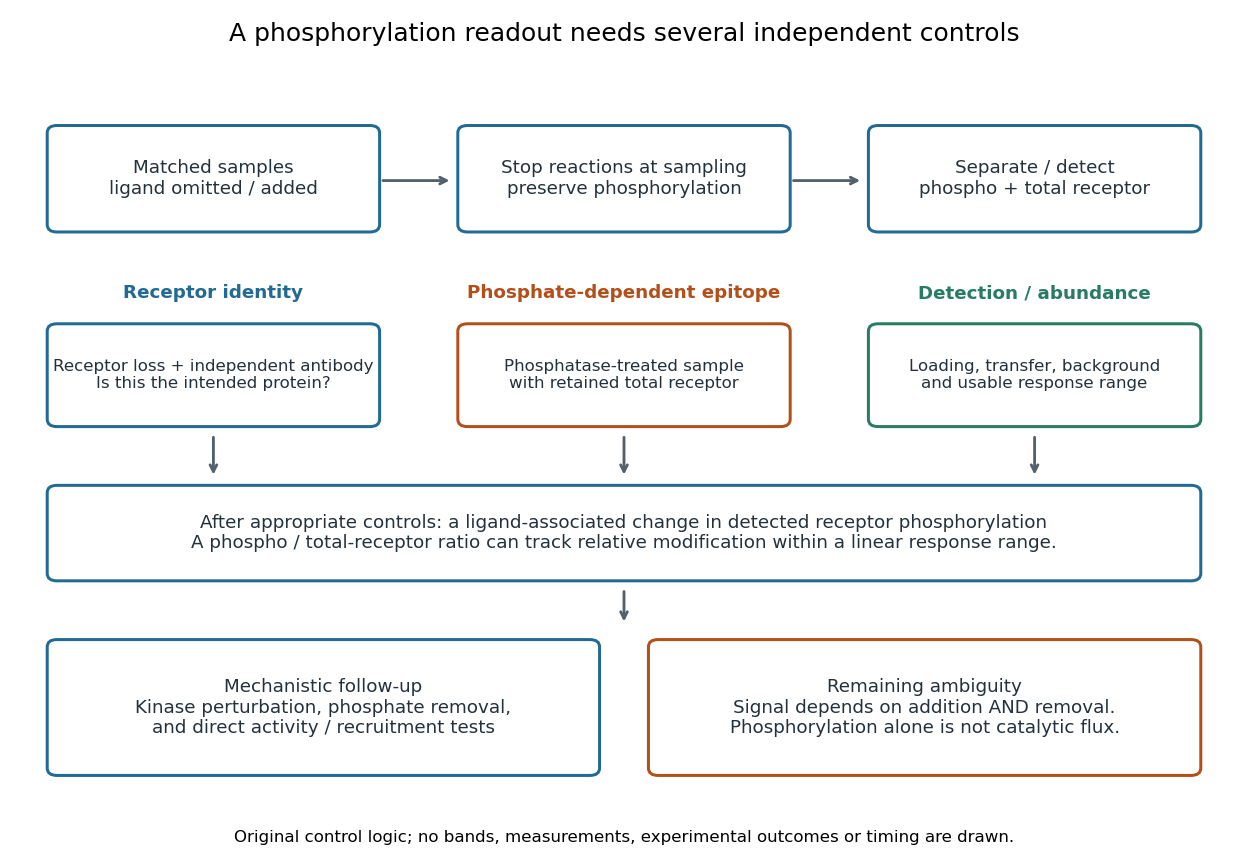

An original idealized measurement model explains the normalization. Let be the retained number of receptor molecules, the fraction carrying the selected modified epitope, and fixed detection gains. After subtracting their respective backgrounds, suppose the phosphorylated and total-receptor signals lie in a linear response range:Dividing by total receptor cancels under these assumptions. It differs from total-protein Western blot normalization, whose denominator includes many other proteins. For invented values , samples with and give and , but both give . Twice the phospho signal here means twice the retained receptor amount, with no change in fractional modification. Unequal recovery, changed epitope accessibility, nonzero uncorrected background or Western blot response saturation invalidates the cancellation. Unknown relative gains prevent reading an absolute modified fraction directly from the ratio.
Insulin receptor 2026-10-14
The mature insulin receptor already contains two extracellular chains and two membrane-spanning chains, joined through protein disulfide bonds, before insulin binds. Insulin induces rearrangement of this assembly. Partner-mediated phosphorylation of the inhibitory activation loop permits increased protein kinase activity. Ligand-induced creation of a previously absent dimer is therefore an unsuitable universal explanation.[ref]
Cell signaling by receptor-tyrosine kinases by Mark A Lemmon and Joseph Schlessinger. “Mechanisms of Receptor Activation” and “TKD autoinhibition by the activation loop: insulin and FGF receptors”, Figure 2E
Epidermal growth factor receptor Created 2026-10-14 Updated 2026-10-20
In an illustrative EGFR activation route, EGF stabilizes an associated pair of receptor chains. Asymmetric contact between their protein kinase protein domains activates one catalytic partner without requiring its activation-loop phosphorylation. Subsequent phosphorylation of cytoplasmic tails creates recruitment sites. Preassociated inactive EGFR populations can also occur: the cartoon's separated starting chains are not a universal initial condition.[ref]
Cell signaling by receptor-tyrosine kinases by Mark A Lemmon and Joseph Schlessinger. Lemmon and Schlessinger, “Mechanisms of Receptor Activation” and “Allosteric activation of TKDs”, Figure 2F
Visual contrast 2026-10-14
For the toy models here, visual contrast means brightness relative to a positive uniform background : . Positive values mean brighter than background, negative values darker, and zero unchanged. This convention separates spatial structure from the background level. A sinusoid with keeps nonnegative. Different experimental conventions for visual contrast require their own definitions; the toy values below do not specify a historical stimulus intensity.
ON and OFF receptive-field subregions Created 2026-10-14 Updated 2026-11-05
ON and OFF receptive-field subregions distinguish locations by response polarity. In the classic mapping experiment, a bright spot in an ON region increased firing during illumination; illumination in an OFF region suppressed maintained firing and/or evoked a discharge when the light disappeared. If maintained firing was very low, suppression could be hard to see. The recorded decrease alone did not distinguish direct inhibition at a synapse from reduced excitation. [ref]
https://xbio-live.s3.amazonaws.com/narratives/57358/Hubel%20and%20Wiesel%201959_Guided%20paper.pdf. Hubel and Wiesel (1959), pp. 576–577: response polarity and inferential limits
These are functional regions in visual space, not compartments of a cell body. Quartic interaction Created 2026-10-14 Updated 2026-11-05
Phi-fourth theory has a scalar interaction . In four dimensions its coupling is classically marginal, and its one-loop four-point function receives bubble corrections in the three Mandelstam channels.
Massless scalar field 2026-10-14
A free real scalar field with zero mass has the displayed wave equation in Minkowski spacetime. In curved spacetime its dynamics also depend on curvature coupling: a minimally coupled massless scalar field and a conformally coupled scalar field need not have the same cosmological modes.
Cover the circle by two arcs whose intersection has two components and take the product with the projective plane. The Mayer–Vietoris sequence has maps on the two copies of the homology of the plane. Its kernels and cokernels, together with , give the displayed groups; all higher groups vanish. The product is a closed nonorientable three-manifold, but is homotopy equivalent to a noncompact oriented four-manifold.
Choose a complex structure on , with . Its induced map on has no fixed point: for a real nonzero vector would give . The maps , for , give a homotopy from the identity to , because they are invertible throughout. Thus this fixed-point-free map is homotopic to the identity.
For , a nonsurjective self-map of Real projective space has zero mod-two degree of a map between closed manifolds. In the mod-two cohomology ring of real projective space, the nonzero degree-one class has . If pullback fixed , it would fix , contradicting zero degree. Thus the map is trivial on the fundamental group and lifts to . A point missed by the original map has both its inverse images missed by the lift. The lift therefore takes values in a punctured sphere, which is contractible, and is null-homotopic. Composing its contraction with the covering projection proves the conclusion.
Real projective 3-space 2026-10-14
The quotient of the three-sphere by its antipodal map is a closed oriented three-manifold. Equivalently it is the lens space obtained by integer surgery of coefficient two on the unknot. Its fundamental group is cyclic of order two, from the sphere double covering. This makes it a basic example for Jones polynomial surgery invariants.
// Target: knot-theory.bigb
Orientability of real projective space 2026-10-14
The outward-normal-first volume form on the unit sphere pulls back under the antipodal map by . For , the sphere is connected, and its orientation descends to the twofold quotient exactly when this deck transformation preserves it. Thus Real projective space is orientable precisely in odd positive dimensions; the zero-dimensional case is one point and is also orientable.
Coding of real sequences by ternary digits Created 2026-10-14 Updated 2026-11-05
Map each real into , choose its canonical binary expansion, and flatten the resulting countable array of bits using a bijection . Interpret these bits as ternary digits zero and one. At a first differing position, the leading difference exceeds the sum of all possible tail differences, so this is an injection from real sequences to a bounded real interval. The bijection lists successive finite diagonals.
Interval (mathematics) 2026-10-14
Energy profile (chemistry) 2026-10-14
An energy profile plots an explicitly specified energy against a reaction coordinate. Identify whether the vertical axis is potential energy, enthalpy, or Gibbs free energy; these descriptions are related but not interchangeable. A potential-energy profile describes a path through configurations, while a free-energy description also accounts for the relevant thermodynamic conditions.
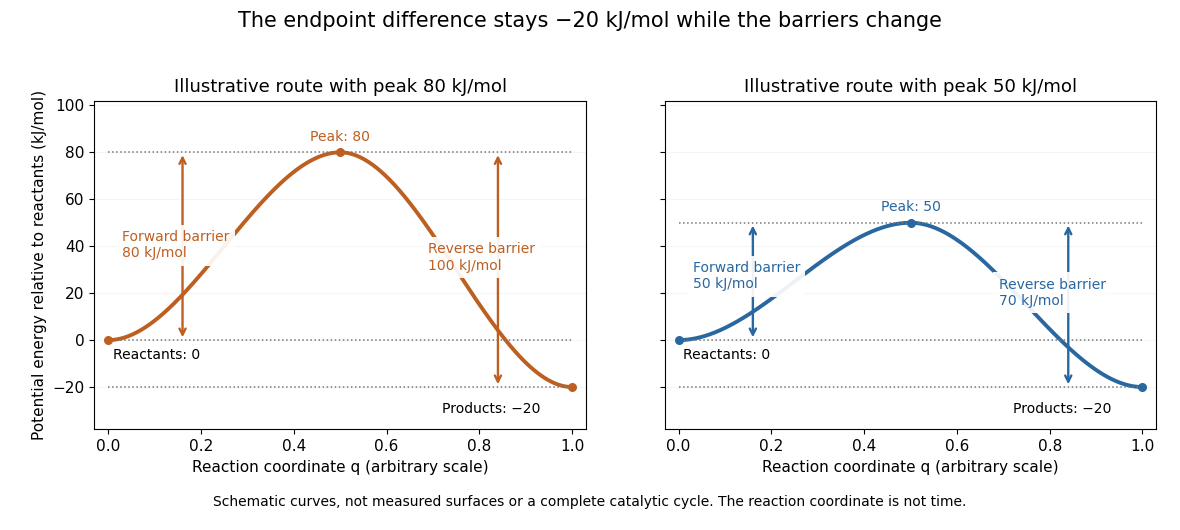
Two schematic potential-energy profiles share endpoints but have different barriers
. The reactant level is , the product level is , and the two maxima are and . These chosen curves illustrate endpoint differences and barrier heights; they are not measured surfaces, trajectories in time, or a complete catalytic cycle. Details.
For the two chosen profiles, the reaction energy barriers from the reactants are and . From the reaction products, the same maxima are and higher. Both paths have endpoint difference . The barrier is measured from the relevant starting endpoint, not from an arbitrary zero of potential energy.
The appeal of the diagram is that it separates two useful questions: which endpoint is lower, and which path is easier to traverse? Catalysis changes the route through transition states while retaining the endpoint thermodynamics of the same overall chemical reaction. A real catalytic route may have several steps and reaction intermediates; the two simple curves do not specify such a reaction mechanism. The plotted potential-energy difference alone is not an equilibrium constant or a calculated rate constant. See Chemistry 2e, 12.7: alternative reaction routes and catalysis.
There are unlisted articles, also show them or only show them.