The respiratory system supplies the pathways and exchange surfaces for movement of respiratory gases. In humans, the trachea and branching airways conduct air to alveoli, while the respiratory diaphragm and other respiratory muscles change thoracic volume. Ventilation moves air; exchange with blood additionally requires an appropriate surface and circulation.
Respiratory-system compliance is the change in volume per change in elastic pressure across the passive lung and chest wall together. For a local static relation,Lung compliance alone instead uses transpulmonary pressure, . The whole-system and lung-only quantities are different even when they refer to the same volume change.
At that shared volume, the elastic pressure increments add. With component compliances and ,The reciprocals are component stiffnesses; respiratory-system elastance is . For positive component compliances, the combined value is smaller than either component. OpenStax describes opposing lung and wall recoil and their pressure references.[ref]
Anatomy and Physiology 2e by J. Gordon Betts and others. §22.3, pleural pressure and thoracic wall compliance
An original example uses and . The combined compliance is about 0.0667 in the same units. An added 0.50 L requires 2.5 cm water of lung elastic pressure and 5 cm water of wall pressure, totaling 7.5 cm water. Attributing that total entirely to the lung would underestimate lung-only compliance threefold.
In a passive ventilated-breath measurement, a zero-flow plateau airway pressure can be compared with the appropriately measured end-expiratory pressure. Under the stated equilibrium and no-effort assumptions, an interval estimate isFor stipulated L, and cm water, this is again about 0.0667. The baseline must account for the relevant positive end-expiratory pressure; a pressure measured during nonzero flow also contains a resistive contribution. The primary pilot study explicitly compares pressure-based respiratory-system estimates under passive ventilation.[ref]
Static and Dynamic Measurements of Compliance and Driving Pressure: A Pilot Study by Pierre Tawfik and others. Introduction, Methods A–D; Study Procedures
State whether the number is a local slope or an interval ratio, which pressure references were used, and whether muscle activity and flow were excluded. Separating lung and wall contributions requires internal pressure information beyond the whole-system volume response.
Respiratory-system elastance is the local increase in passive elastic pressure per increase in respiratory volume. It is the reciprocal of local respiratory-system compliance:Its units are pressure per volume, such as or . A larger elastance means that the same small volume increment needs a larger elastic pressure increment.
The lung and chest wall share a volume increment while their pressure increments add. Thus their elastances add,whereas their compliances do not. For stipulated and , the elastances are 5 and 10, totaling 15 in reciprocal units. Combined compliance is . The underlying pressure partition is distinct from attributing all measured stiffness to the lung.[ref]
Pulmonary Function Testing by Warren M. Gold and Laura L. Koth. Lung Elasticity, pressure references and compliance
Elastic work in a pressure-volume model gives another meaning to stiffness. Around a passive zero-recoil equilibrium, let added volume be and pressure with constant elastance. The reversible work needed to move from zero to isFor an original SI example, and give final pressure 500 Pa and elastic work 0.125 J. Doubling elastance at the same volume doubles this work; doubling volume at fixed elastance quadruples it. Resistive losses and active muscle work are outside this ideal elastic calculation.
If the pressure-volume curve is nonlinear, local elastance can differ from the interval ratio . Its reciprocal corresponds to the local compliance at that state, not an average across an arbitrary range. A primary ventilator study compared different pressure-volume methods under passive conditions, making this measurement definition operational.[ref]
Static and Dynamic Measurements of Compliance and Driving Pressure: A Pilot Study by Pierre Tawfik and others. Figure 1, methods A–D
Report volume range, passive conditions and whether the value is a derivative or a secant.Elastic work in a pressure-volume model is the work required to move along the reversible elastic pressure response as volume changes. With added volume measured from an equilibrium state and recoil pressure measured relative to that state,It is the area under the elastic pressure versus volume curve, not the final pressure multiplied by the final added volume. Constant respiratory-system elastance gives and .
Nonlinearity matters even when the final pressure agrees. In an original SI example letAt , the linear and cubic terms contribute 400 and 100 Pa, respectively. Integrating givesA straight line from the origin to the same endpoint would instead give 0.125 J. Equal endpoint pressure and volume do not specify the entire loading work.
The local respiratory-system elastance is , whereas the endpoint secant is . The integral uses the whole elastic curve. A constant baseline pressure would add to boundary work computed from the absolute driving pressure; that term is absent from the baseline-relative elastic energy defined here.
Actual inflation and deflation can follow different paths. In a passive cyclic model, the enclosed hysteresis area represents net mechanical energy dissipated per cycle rather than reversible energy stored at one endpoint. Resistive pressure and muscle activity must therefore be distinguished from elastic recoil. The primary pulmonary-function chapter explains why static and dynamic lung compliance use different measurement conditions.[ref]
Pulmonary Function Testing by Warren M. Gold and Laura L. Koth. Lung Elasticity, Static and Dynamic Compliance: pressure-volume measurements and zero-flow conditions
The constructed curve above illustrates integration; it is not an observed patient curve.Spirometry measures the volume of air moved into or out of the respiratory system as a function of time. A spirometer records displaced gas directly or derives volume by integrating volumetric flow rate. The resulting trace describes gas movement at the mouth; it does not independently determine alveolar pressure, pleural pressure or lung compliance.[ref]
Standardization of Spirometry 2019 Update by Brian L. Graham and others. Introduction and Equipment: volume and flow measurements
Two important outputs of a forced expiration following maximal inspiration are forced vital capacity, the total volume expelled in that maneuver, and forced expiratory volume in one second, the volume expelled during its first second. Their ratio compares early emptying with the eventual expelled volume.[ref]
Standardization of Spirometry 2019 Update by Brian L. Graham and others. FVC Maneuver and definitions of FVC and FEV1
Equal final volumes can accompany substantially different emptying rates.An original mathematical example sets expelled volumewhere the numerical time and time constant are in seconds. Both and give an asymptotic expelled volume of 4 L. Their first-second volumes are instead L and L. The corresponding ratios to the limiting volume are approximately 0.632 and 0.393. These smooth toy curves explain the measurements; they are not measured traces or diagnostic reference limits.
Spirometry measures volume differences. The gas left after maximal expiration is residual lung volume, which has not crossed the instrument. Consequently a volume trace alone does not determine total lung capacity: different absolute starting volumes can produce the same expelled-volume trace. This is the absolute-volume ambiguity in spirometry.
Timing, effort, leaks and early termination can alter what a trace represents. Distinguish an instrumentally repeatable signal from a maneuver that answers the intended physiological question. The primary technical statement treats equipment quality assurance and maneuver acceptability separately.[ref]
Standardization of Spirometry 2019 Update by Brian L. Graham and others. Device Quality Assurance and FVC Maneuver acceptability sections
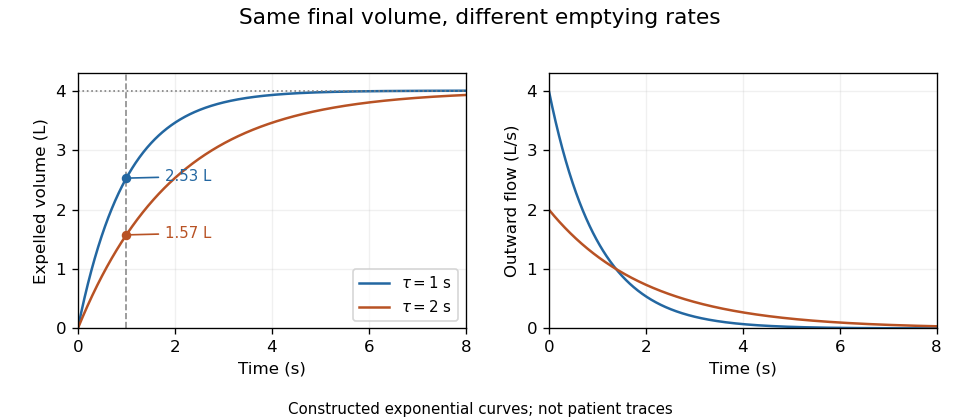
Original exponential spirometry models with equal final expelled volume and different time constants; the first-second volumes and flow histories differ
. Details. 
A peak flow meter is an instrument that measures peak expiratory flow, the greatest outward volumetric flow rate reached during a specified forced expiration. A portable instrument can retain that maximum without recording the whole volume versus time history. A spirometer that records a suitable flow trace can also determine the maximum, but the two outputs contain different information.
Basil Martin Wright and C. B. McKerrow's 1959 primary paper described a portable instrument for maximum forced expiratory flow measurement.[ref]
Maximum Forced Expiratory Flow Rate as a Measure of Ventilatory Capacity by Basil Martin Wright and C. B. McKerrow. BMJ 2(5159), pp. 1041–1046, primary instrument report
The Wood Library-Museum preserves an Airmed example: its collection record places the device in the practical transition from bulky laboratory measurements to portable measurements.[ref]Wright Peak Flowmeter at the Wood Library-Museum of Anesthesiology. Object description and catalogue, accession 1998-02-25-1
A peak alone cannot determine expelled volume. For two original triangular flow pulses, stipulate the same maximum but base durations 0.5 and 1.0 s. Their peaks both correspond to 480 L/min, while integrating their traces gives and 4 L. The second pulse expels twice as much air without a greater peak.
Finite instrument response introduces a separate issue. As an illustrative first-order low-pass filter model, suppose the indicated volumetric flow rate obeysFor a rectangular flow pulse of height lasting , the indicated peak is . Durations and produce only about 63.2% and 95.0% of the input peak. This is a response model, not an assertion that the historical instrument has that exact mechanism or time constant.
A useful measurement therefore specifies the maneuver, units and instrument response as well as the displayed maximum. A retained peak does not establish forced vital capacity, forced expiratory volume in one second or lung compliance. Those require different information; spirometry standards distinguish equipment performance from maneuver quality.[ref]
Standardization of Spirometry 2019 Update by Brian L. Graham and others. Equipment and FVC Maneuver sections
Peak expiratory flow is the greatest outward volumetric flow rate reached during a specified forced expiration. In an ideal continuous record,It has units of volume per time, commonly litres per second or litres per minute, whereas FEV1 and FVC are integrated volumes. The 2019 technical statement defines the peak from a maximal forced expiratory maneuver and specifies its reporting units.[ref]
Standardization of Spirometry 2019 Update by Brian L. Graham and others. Reported Values and Table 9
An original pair of triangular volumetric flow rate histories separates the quantities. Let numerical time be in seconds. One curve is L/s over ; the other is L/s over , followed by zero. Both expel 1 L in total and in the first second. Their peaks are nevertheless 2 and 4 L/s, or 120 and 240 L/min. Equal expired volume does not identify the highest volumetric flow rate.
The instrument history reflects the value of measuring that maximum directly. In 1959, Basil Martin Wright and C. B. McKerrow published a description of a portable instrument for maximum forced expiratory volumetric flow rate.[ref]
Maximum Forced Expiratory Flow Rate as a Measure of Ventilatory Capacity by Basil Martin Wright and C. B. McKerrow. BMJ 2, 1041–1046; PMID 13846051, published bylines B. M. Wright and C. B. McKerrow
The Wood Library-Museum's original-object catalogue identifies its Wright peak flow meter, records the author as B. M. Wright (Basil Martin), and describes the instrument's portability.[ref]Wright Peak Flowmeter at the Wood Library-Museum of Anesthesiology. Catalogue record, accession 1998-02-25-1, author identification and object description
A peak flow meter and a full spirometer record different amounts of information. A retained peak does not reconstruct the preceding waveform or total volume. Conversely, numerical differentiation and finite sensor response can affect a peak inferred from a recorded volume trace. Adequate temporal response, effort and the starting lung volume belong to the measurement definition. The primary standard connects early volumetric flow rate and the peak with maneuver effort and requires complementary waveform displays.[ref]
Standardization of Spirometry 2019 Update by Brian L. Graham and others. Equipment, Display; start of forced expiration
The triangular examples are mathematical constructions, not reference values or a diagnostic rule. Comparing peak measurements requires comparable units, maneuvers and instrument response rather than treating a maximum as a complete description of lung function.
The FEV1 to FVC ratio is the dimensionless fraction obtained by dividing forced expiratory volume in one second by forced vital capacity:Under an ideal complete-expiration model with nonnegative outward flow, the first-second expelled volume cannot exceed the total, so . The ratio describes early emptying relative to the measured total; it is not itself a volume or an instantaneous volumetric flow rate.[ref]
Standardization of Spirometry 2019 Update by Brian L. Graham and others. FVC Maneuver and definitions of timed and total expired volumes
An original comparison makes the information loss clear. FEV1 of 3 L with FVC of 4 L gives the same ratio, 0.75, as 1.5 L with 2 L. Equal ratios do not imply equal absolute lung size, equal total expired volume or equal complete flow histories. Expressing 0.75 as 75% changes the display, not the quantity.
Common-gain cancellation and flow-offset bias in expiratory ratios distinguishes two instrument errors. If both measured volumes are multiplied by the same positive gain , their ratio is unchanged. A constant flow offset instead accumulates for different durations. With true first-second volume , total volume , first-second duration and complete observation duration ,The cancellation of a common gain does not cancel the duration-dependent offset.
For stipulated L, L, s and s, the true ratio is 0.60. A common gain of 1.05 still gives 0.60. With unit gain and , however, the measured ratio becomes . These are constructed measurement errors, not observed patient data.
Early termination bias in forced vital capacity acts differently again: losing late expired volume can lower the denominator while leaving a valid first second intact, increasing the ratio. This is why a ratio needs valid constituent measurements. The technical statement treats FEV1 and FVC acceptability separately.[ref]
Standardization of Spirometry 2019 Update by Brian L. Graham and others. Table 7, FEV1 and FVC acceptability/usability
A clinical interpretation additionally requires the appropriate reference framework; the arithmetic alone does not identify a disease mechanism.Common-gain cancellation and flow-offset bias in expiratory ratios distinguishes an error that rescales both volumes equally from one that accumulates differently over time. Let true FEV1 be , true FVC be , and their ratio be . A shared positive volume gain cancels exactly: . The result requires the same gain for both quantities, not merely the same instrument name.
A constant error in measured volumetric flow rate has another effect. If the first-second interval lasts and the full recording lasts , integration givesThe ratio alone identifies neither nor separately; only their relative combination enters this model. Nor does the positive duration-dependent error necessarily raise the ratio.
The exact difference isFor small , its sensitivity coefficient at zero offset is . If average early volumetric flow rate exceeds average whole-record volumetric flow rate , a positive volumetric flow rate offset lowers the ratio. If the averages agree, that offset leaves the ratio unchanged in this model.
An original example uses L, L, s and s. The true ratio is 0.60. At , the zero-offset sensitivity is . An offset gives a first-order shift of ; the exact ratio is . A common 5% gain error without the offset would leave 0.60 unchanged.
Independent numerator and denominator gains would instead multiply by . Clipping, early termination and different timing conventions are additional measurement effects, so gain cancellation is not a general guarantee of ratio accuracy. The GUM requires the full measurement model and shared-input effects to be retained.[ref]
Guide to the expression of uncertainty in measurement by JCGM. §§5.1–5.2, measurement sensitivity and correlated inputs
The spirometry statement separately checks the acceptability of the constituent volumes.[ref]Standardization of Spirometry 2019 Update by Brian L. Graham and others. Table 7, FEV1 and FVC criteria
Absolute-volume ambiguity in spirometry is the undetermined volume offset left when spirometry measures only air entering or leaving the mouth. If is outward volumetric flow rate, expelled volume is , while absolute lung volume isThe same measured trace is compatible with every admissible initial volume . Differentiation removes the constant: neither integrating flow nor improving its numerical precision recovers that missing offset.
An original example has 4 L expelled between maximal inspiration and maximal expiration. An initial volume of 6 L leaves 2 L, while an initial volume of 8 L leaves 4 L. Both give the same forced vital capacity and can have exactly the same flow-time curve. They differ in total lung capacity and residual lung volume, which the expelled-volume trace alone does not identify. The pulmonary-function text distinguishes spirometric volume changes from absolute lung-volume measurements.[ref]
Pulmonary Function Testing by Warren M. Gold and Laura L. Koth. Lung Volumes: gas dilution and plethysmographic methods
Helium dilution measurement of lung volume adds independent information. In an ideal closed circuit, an external reservoir has known volume and initial helium fraction , while the communicating lung gas initially contains no helium. After complete mixing to fraction , conservation givesFor stipulated L, and , the communicating lung volume at connection is 4.5 L. This original calculation assumes no leaks, complete mixing, consistent gas conditions and appropriate accounting for the apparatus volume. The primary textbook describes the closed-circuit mixing apparatus and helium concentration measurement.[ref]
Pulmonary Function Testing by Warren M. Gold and Laura L. Koth. Closed-circuit helium dilution, Figure 25-10
Communicating gas volume versus trapped gas volume limits this inference: gas that does not communicate with the tracer during the measurement is not counted by the ideal mixing balance. Adding a tracer or another independent measurement breaks one ambiguity only under its own experimental assumptions. A well-resolved spirometric trace and a validated absolute-volume measurement answer complementary questions.
Communicating gas volume versus trapped gas volume distinguishes gas that exchanges with a measurement circuit during a specified experiment from gas that is physically present but not reached by that experiment. The distinction depends on the pathway, mixing time and protocol. A region with no exchange during a test contributes no tracer dilution even though its gas occupies space in the lung.
An original ideal closed-circuit model separates these volumes. An external reservoir of volume initially contains helium fraction . Communicating lung gas has volume and initially no helium; an additional volume is isolated throughout the test. After complete mixing of the accessible part,The actual lung gas volume in this model is . The final tracer concentration does not identify because that volume does not enter the conservation equation.
Take stipulated L, , L and L. The equilibrium concentration is , and the dilution calculation correctly returns 3 L of communicating gas. The total gas volume is nevertheless 5 L. If all 5 L instead communicate and equilibrate, the final fraction becomes . These are constructed gas balances, not measurements from patients.
Helium dilution measurement of lung volume implements the accessible-volume idea using a known gas mixture and concentration measurement. The primary textbook describes the closed circuit and contrasts dilution methods with body plethysmography.[ref]
Pulmonary Function Testing by Warren M. Gold and Laura L. Koth. Lung Volumes; closed-circuit helium dilution, Figure 25-10; body plethysmography
Plethysmographic inference uses pressure-volume behavior, so it has a different measurement model and its own assumptions.Protocol-dependent accessibility of lung gas also covers slow exchange. A poorly ventilated region may contribute little during a short measurement yet exchange appreciably over a longer interval. Calling its gas permanently trapped solely because one tracer trace has not equilibrated would exceed the observation. Conversely, an apparently stable accessible compartment need not demonstrate access to every region.
Comparison between methods is therefore useful only with their pressure, mixing and equilibration conditions specified. A difference can reveal different sampled gas compartments, but leaks, technical errors and violated model assumptions must also be considered before assigning the difference to one anatomical cause.
Protocol-dependent accessibility of lung gas means that the volume reached by a tracer gas depends on how long and how the tracer gas is allowed to mix. Gas that communicates slowly can be partly represented during one observation window and more fully represented during another. This differs from assuming that one fixed volume is permanently isolated.
An original compartmental model makes the dependence quantitative. A reservoir of volume initially contains helium fraction and rapidly mixes with a fast lung region . Their combined volume is , with initial fraction . A slow region of volume initially contains no tracer gas and exchanges equal gas volumes in each direction at rate . Assuming constant volumes and well-mixed compartments,Total tracer gas is conserved, while the concentration difference decays withApplying an equilibrium dilution formula before equilibration gives an apparent lung volume . It starts at and tends toward in this ideal model.
For stipulated L, L, L, and s, the recorded concentration is . After 10 s, the apparent volume is about 4.13 L; after full equilibration it is 5 L. The change occurs without adding lung gas: the tracer gas is reaching more of the existing volume. These are constructed mixing calculations, not a clinical waiting-time recommendation.
The primary respiratory text describes a closed-circuit helium apparatus with continuous concentration measurement using a thermal-conductivity meter, together with gas-volume corrections. It also states that poor communication and short dilution time can limit the represented gas volume.[ref]
Pulmonary Function Testing by Warren M. Gold and Laura L. Koth. Closed Circuit Methods, Figure 25-10, and discussion of poorly communicating gas
Leaks, changing gas conditions and unequal starting volumes can produce additional differences. A protocol-defined apparent volume therefore needs its mixing and measurement conditions attached to the result.Forced expiratory volume in one second, abbreviated FEV1, is the gas volume expelled during the first second of a forced expiration timed according to the specified start-of-test convention. It is a volume, normally reported in litres, rather than a volumetric flow rate. FEV1 measures early emptying, while FVC describes the total volume expelled in the maneuver.[ref]
Standardization of Spirometry 2019 Update by Brian L. Graham and others. FVC Maneuver, definitions of FEV1 and FVC
For an ideal start with no timing offset,An original exponential model therefore gives . At stipulated L and s, the first-second volume is about 1.57 L. The integral's units are litres even though the integrand is expressed in litres per second.
Flow-history ambiguity of a timed expiratory volume explains why FEV1 is not a complete flow trace. Over the first second, constant flow and the decreasing flow , with numerical in seconds, both integrate to 2 L. Their initial flows differ, and their instantaneous flows agree only at 0.5 s. These constructed histories show that equal FEV1 need not imply equal peak flow or equal waveform.
Real timing does not simply begin whenever a recorder is switched on. The 2019 statement uses back-extrapolation to define Time 0 and includes the volume expired before that time in both FEV1 and FVC.[ref]
Standardization of Spirometry 2019 Update by Brian L. Graham and others. Start of Test, Figure 1 and back-extrapolated volume definition
State the convention rather than silently replacing it with an arbitrary one-second window.The FEV1 to FVC ratio divides early emptying by total expelled volume. It is dimensionless and depends on both measurements. A reproducible FEV1 alone does not establish complete expiration, absolute lung size or the pressure-flow relation; these require additional observations or a different measurement model.
Flow-history ambiguity of a timed expiratory volume arises because integrating volumetric flow rate retains the total gas moved but discards its detailed time ordering. If a timed measurement is , then every admissible perturbation satisfyingproduces the same from . Nonnegative flow restricts the possibilities, but generally does not leave a unique waveform. This is an integral null-space ambiguity in expiratory measurements.
An original example preserves both FEV1 and FVC. Let a constant baseline flow continue for 4 s. Modify only the first second, with s, byand set afterward. The modified flow stays between 0.5 and 1.5 L/s during the first second. Its cumulative difference from the baseline isAt one second the difference returns to zero. Both traces therefore have FEV1 of 1 L, FVC of 4 L and FEV1 to FVC ratio of 0.25. Their peak expiratory flows differ: 1 versus 1.5 L/s. At half a second, the modified trace has expelled approximately 0.159 L more than the baseline, before the later flow difference cancels it.
These artificial waveforms isolate information loss; they are not physiological reference curves. A timed volume is not interchangeable with a peak value or an entire flow-volume history. The 2019 technical statement requires inspection of both volume-time and flow-volume displays because the displays expose different features of a maneuver.[ref]
Adding more timed integrals can constrain the waveform more strongly, but finitely many such summaries still leave many possible continuous histories unless a restrictive model is imposed. Report which waveform features were actually measured rather than inferring all of them from one scalar volume.
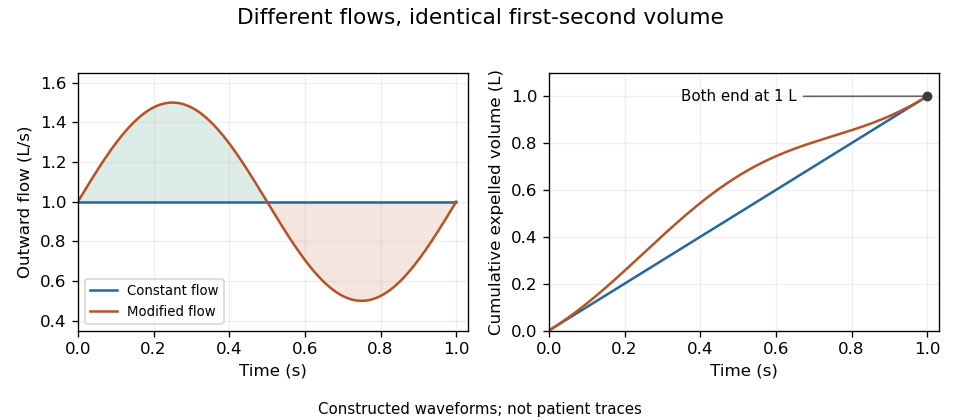
Original flow histories with identical first-second expired volume; equal integrals conceal different volumetric flow rates
. Details. 
Integral null-space ambiguity in expiratory measurements is the existence of different volumetric flow rate functions producing the same finite collection of cumulative expired volumes. Let belong to an appropriate function space and let the measurement map beThis is a linear map. Every perturbation in its null space leaves all the measurements unchanged: .
The null space is large even when observations occur at several times. Put . On any interval , choose a sine wave completing an integer number of cycles and set it to zero outside that interval. Its integral across that interval is zero, so every recorded cumulative volume is unchanged. Different cycle counts give infinitely many such functions. Sufficiently small amplitudes preserve positive volumetric flow rate wherever the baseline stays bounded away from zero.
An original example records volumes at 0.5, 1 and 2 s from a baseline volumetric flow rate of 1 L/s. Add L/s only over the first 0.5 s. All three recorded volumes remain 0.5, 1 and 2 L, but the instantaneous volumetric flow rate ranges from 0.6 to 1.4 L/s during that interval. The added shape is invisible to these cumulative measurements.
A finite-dimensional model changes what can be identified. If is restricted to known basis functions, the observations become , where . Unique coefficients require matrix rank . For the stipulated linear-flow model , two observations have rows and determinantDistinct positive times therefore identify in that model. Volumes 1.5 L at 1 s and 4 L at 2 s yield L/s and .
That model-based uniqueness is not recovery of an arbitrary waveform. The primary spirometry statement's complementary volume-time and flow-volume displays preserve information beyond a few timed volumes.[ref]
Standardization of Spirometry 2019 Update by Brian L. Graham and others. Equipment, Display
State the allowed model class before treating a small set of summaries as a complete measurement.Forced vital capacity, abbreviated FVC, is the total gas volume expelled in a forced expiration following maximal inspiration, under the stated maneuver and acceptance criteria. It is a difference between lung volumes, not the total lung capacity: residual lung volume remains after expiration. The 2019 technical statement defines the maneuver and separately evaluates whether its start and end support the reported quantities.[ref]
Standardization of Spirometry 2019 Update by Brian L. Graham and others. FVC Maneuver and acceptability criteria
An original compartment illustration starts with 6 L of lung gas and ends with 2 L. The expelled volume is 4 L. Starting with 8 L and ending with 4 L gives the same FVC, despite different absolute volumes. Thus absolute-volume ambiguity in spirometry applies even to a perfectly measured, fully completed expiration.
Duration also affects what is collected. For a constructed exponential emptying curve,At L, s and s, about 3.80 L has been expelled and about 0.20 L of this model's eventual expelled volume remains. This is an explanation of finite-time capture, not a universal breathing time requirement or a patient model.
Early termination bias in forced vital capacity can also change a ratio. Suppose a complete hypothetical maneuver has FEV1 of 2.4 L and FVC of 4.0 L, giving a FEV1 to FVC ratio of 0.60. If a recording ends later than the first second but captures only 3.0 L, treating that incomplete total as FVC would yield 0.80 with the same numerator. An apparently larger ratio can therefore result from losing late expired volume, rather than from an improvement in early emptying.
The technical statement distinguishes FEV1 and FVC acceptability because errors can affect the two quantities differently.[ref]
Standardization of Spirometry 2019 Update by Brian L. Graham and others. Table 7, acceptability and usability criteria for FEV1 and FVC
Reported volume, repeatability and maneuver completeness are distinct pieces of evidence. Agreement between repeated incomplete traces does not independently establish that their common endpoint is valid.Early termination bias in forced vital capacity occurs when a recording misses late expired gas but its incomplete total is treated as FVC. If the first second was validly measured, FEV1 can remain unchanged while the denominator of the FEV1 to FVC ratio becomes too small. This can make the ratio appear larger without any change in early emptying.
An original algebraic model writes true total expired volume as , measured first-second volume as , and lost tail volume as , with . ThenFor positive , the relative ratio inflation is . Losing 10% of the total volume raises the ratio by about 11.1%; losing 25% raises it by one third. For stipulated L and L, losing 1 L changes the ratio from 0.60 to 0.80.
Tail-volume loss and ratio inflation in truncated expiration can also be studied as a function of time. In a constructed exponential model , a stop at s loses fraction . Keeping the ratio inflation below a chosen positive fraction requiresAt stipulated s and , this model needs about 9.23 s. This is a mathematical illustration of tail capture, not a prescribed clinical expiration duration. Different time constants give different uncollected tails at the same clock time.
The primary technical statement assesses end of forced expiration and distinguishes FEV1 from FVC acceptability rather than treating one fixed duration as universally sufficient.[ref]
Standardization of Spirometry 2019 Update by Brian L. Graham and others. End of forced expiration; Table 7 and Figure 2
If the stop also invalidates the first second, the assumption that is unchanged no longer holds, and the ratio's error cannot be inferred from denominator loss alone.Repeatability does not remove this bias. Repeated equally incomplete traces can agree closely while missing the same late gas. Timing quality, maneuver completeness and reproducibility are separate observations.
Tail-volume loss and ratio inflation in truncated expiration connects unrecorded late gas to a biased FEV1 to FVC ratio. Suppose a valid first-second volume is retained, the recorded total is , and additional uncollected volume is . The complete ratio is , while using as FVC gives .
If independent information bounds , thenFor an original example with L, L and L, the complete ratio lies between 0.60 and 0.80 under this bound. This is a deterministic interval conditional on the tail bound, not automatically a statistical confidence interval.
Bounding uncollected expiratory volume from terminal flow adds a model. Let volumetric flow rate after the stop time be . The missing volume isIf , this gives . For stipulated terminal volumetric flow rate and s, the bound is 0.20 L. With the same and , the ratio is then between 0.75 and 0.80.
The bound extends to a positive sum of exponential tails: if each component has terminal volumetric flow rate and time constant at most , then . Without a justified upper time scale, however, very small terminal volumetric flow rate can coexist with a large slowly emptying volume. A visually flat trace alone does not supply that missing assumption.
The relative inflation from using the truncated ratio is especially simple:for positive . In the bounded 0.20 L example it is at most . The result assumes termination after a valid first second; an invalid numerator needs another error model.
The primary spirometry standard evaluates end of forced expiration and distinguishes it from the validity of FEV1.[ref]
Standardization of Spirometry 2019 Update by Brian L. Graham and others. End of forced expiration; Table 7
The calculations explain sensitivity to lost tail volume rather than replace the standard's actual maneuver criteria.Bounding uncollected expiratory volume from terminal flow uses an explicit restriction on future volumetric flow rate to limit the air missed when a recorded expiration stops. A small final volumetric flow rate alone gives no such guarantee: an arbitrarily long, slowly decaying tail can have substantial remaining volume.
Let be the nonnegative future volumetric flow rate, with at the recording endpoint. Suppose an independently justified bound on its decay holds throughout the tail:Differentiating shows that it cannot increase. HenceThis is an upper bound from a specified differential inequality, not a fitted exponential silently treated as established physiology.
For original values and s, the missed volume is at most 0.12 L. If the collected volume is L and the correctly captured first-second volume is L, thenIf the terminal instrument reading has a deterministic error bound , use in the same argument. An uncertainty statement about the final reading does not itself establish the future decay assumption.
The assumption is essential. Exponential tails with the same terminal volumetric flow rate have missed volumes , unbounded as increases. This explains why the endpoint of a trace cannot by itself certify complete expiration. The primary spirometry statement separately specifies end-of-forced-expiration and measurement acceptability criteria.[ref]
Standardization of Spirometry 2019 Update by Brian L. Graham and others. FVC Maneuver, End of Forced Expiration, and Table 7
The inequality is an illustrative model bound, not an additional clinical stopping rule.A spirometer is an instrument for measuring gas volume changes associated with breathing. Its output supports spirometry. A displacement design follows the movement of a gas-containing chamber; a flow-measuring design records volumetric flow rate and integrates it. In a pneumotachograph, a measured pressure difference across a flow-resistive element supplies the signal used to estimate volumetric flow rate.
For an ideal piston with cross-sectional area and displacement , the transferred volume is . For a flow-measuring instrument,These are different measurement chains for the same volume change. The 2019 primary technical statement explicitly discusses volume and flow instruments and their quality assurance.[ref]
Standardization of Spirometry 2019 Update by Brian L. Graham and others. Equipment and Device Quality Assurance
An original error model makes integration drift visible. If a flow sensor reports , with constant gain and zero offset , its integrated result isAn offset of contributes 0.020 L during one second but 0.20 L during ten seconds. It can therefore change a long-expiration total more than an early timed volume, even though the flow offset is constant. A gain error instead scales both in proportion when no offset is present.
Spirometer calibration verification uses a known gas transfer to test the assembled measurement chain. The 2019 statement specifies at least daily verification with a 3-L syringe at several flows and a measured-volume accuracy requirement of ±3%.[ref]
Standardization of Spirometry 2019 Update by Brian L. Graham and others. Calibration and Quality Control: 3-L syringe, multiple flow rates and accuracy requirement
For a stipulated ideal 3.000 L transfer, a report of 3.090 L differs by 3%; identical total volumes at different transfer speeds can also expose a flow-dependent response.Measurement calibration, leak checks and correct timing address different errors. Agreement with a syringe transfer establishes a specific instrument response; it does not by itself show that a person's breathing maneuver was complete or physiologically comparable to another attempt.
Spirometer calibration verification checks whether a spirometer measures a known input within specified limits. It differs from measurement calibration, which establishes the relation between input and indication, and from an adjustment that changes that relation. A satisfactory verification applies to the tested equipment, assembly and conditions; it does not validate a person's expiration maneuver.
The primary 2019 technical statement specifies daily verification with a 3-L syringe cycled over multiple flows. Its stated measured-volume accuracy requirement is ±3%, and a filter used for testing is also used during verification.[ref]
Standardization of Spirometry 2019 Update by Brian L. Graham and others. Calibration and Quality Control, 3-L syringe and multiple-flow verification
The known volume is useful precisely because it can be delivered at different speeds.An original gain-and-offset model explains this design. If measured flow is , integrating one transfer of known volume over duration givesFor the same at two durations,A single transfer cannot distinguish gain from zero offset in this model; two different durations can.
Take stipulated 3.000 L transfers lasting 1 s and 6 s, reported as 3.020 and 3.120 L. The inferred offset is , while . The slow transfer is 4% high, exceeding the cited 3% limit. If both transfers instead read 3.060 L, this model gives and : a 2% gain error. These are constructed instrument responses, not a calibration record for an actual device.
Identifying flow-sensor gain and offset with timed transfers relies on the model assumptions. Nonlinear response, leaks or an inaccurately known syringe volume can produce other patterns. Reference-volume uncertainty belongs in the uncertainty budget, and repeated transfers share it rather than independently re-estimating it. A test at several flows is therefore more informative than repeating one convenient delivery speed.
Identifying flow-sensor gain and offset with timed transfers uses a known gas volume delivered over different durations to distinguish multiplicative response from accumulated zero error. In the model , a transfer of volume lasting producesThe observations form a linear regression with design matrix rows . If , gain and offset are identifiable only when the durations are not all equal. Repeating one duration measures the same combination of and more precisely, without separating them.
For two noise-free transfers,Stipulated 3 L transfers lasting 1 and 6 s, measured as 3.020 and 3.120 L, give and . The different durations expose an offset that one transfer could misinterpret as a gain error.
Timing spread and gain-offset estimator covariance quantifies the design. Suppose observations have independent equal volume-error variance , and define . Ordinary least squares givesUnder the stipulated model, wider timing separation improves offset precision. For the two durations above and L, the offset's standard uncertainty is about and the gain's about 0.00406.
The reference syringe volume was treated as known in those formulas. If it is uncertain, repeated sensor tests share that reference uncertainty. Indeed the observations identify only the product when both factors are unknown. Additional repetitions cannot establish an absolute gain without an independently characterized volume. The GUM treats fit uncertainties and common-reference correlations as distinct contributions.[ref]
Guide to the expression of uncertainty in measurement by JCGM. §4.2.5, fitted parameters; §5.2.4, common reference data
The primary spirometry statement's multiple-flow syringe checks test the practical response over different delivery rates.[ref]
Standardization of Spirometry 2019 Update by Brian L. Graham and others. Calibration and Quality Control, 3-L syringe over multiple flows
Actual leaks, flow-dependent nonlinearities and uncertain timing require a richer model than a constant gain and offset.Timing spread and gain-offset estimator covariance describes how delivery durations affect both precision and correlation when a known volume calibrates an integrated volumetric flow rate sensor. In the model , assume and durations are known and independent volume errors have common variance . Define .
The least squares slope estimates offset , while the intercept divided by estimates gain . Their covariance isThe negative covariance reflects a tradeoff: a larger fitted offset can be compensated by a smaller gain while preserving responses near the middle of the observed durations.
For an original design with L, durations 1 and 6 s, and L, the standard uncertainties are approximately 0.00283 L/s for offset and 0.00406 for gain. Their correlation is about . Moving the second duration to 2 s, with everything else stipulated unchanged, makes the offset uncertainty five times larger. Wider duration spread supplies more leverage for separating slope from intercept within this model.
Prediction shows why the covariance matters. For a new duration , the fitted mean response is , withAt the midpoint 3.5 s in the example, its standard uncertainty is L. Incorrectly dropping the gain-offset covariance would give about 0.0157 L. This is uncertainty of the fitted mean; an independent future observation adds its own error variance.
Centering time at makes the fitted midpoint response and slope uncorrelated under the stated equal-variance model. Transforming back to physical gain restores the covariance, so a change of coordinates does not remove shared uncertainty. The GUM explicitly retains such covariance terms in propagation.[ref]
Guide to the expression of uncertainty in measurement by JCGM. §5.2.2, equation 13, correlated-input propagation
Reference-volume uncertainty, uncertain timing and nonlinear volumetric flow rate response require additional terms beyond this original regression calculation.Airway resistance quantifies the pressure difference needed to drive a specified volumetric flow rate through the conducting airways. For a steady linear relation with flow positive toward the alveoli,The units are pressure divided by volume per time, for example . A stipulated pressure drop of 1 cm water at gives in those units. The pressure references matter: mouth-to-alveolar pressure concerns the flow path, whereas transpulmonary pressure also describes elastic loading of the lung.
An instructive idealization is the Hagen-Poiseuille equation. For a rigid cylindrical tube carrying steady laminar flow of a fluid with dynamic viscosity ,Reducing its radius to 80% while holding length and dynamic viscosity fixed multiplies resistance by . Real airways form a branching, deformable network and need not carry fully developed laminar flow. The tube equation explains a sensitivity, not a universal law for every lung measurement.
Network structure also matters. For identical linear branches in parallel, pressure drop is shared and their volumetric flow rates add, giving . Many narrow distal branches can therefore have a very different combined resistance from one isolated narrow tube. Radius alone is insufficient without the arrangement and number of pathways.
Secant versus differential airway resistance distinguishes two values when the relation is nonlinear. For an original model , the finite ratio is , while its local slope is away from zero. Report the operating flow and which definition is used.
A 1959 primary study combined mouth pressure with an intra-esophageal balloon and a differential pressure transducer to investigate resistance and compliance.[ref]
Airway Resistance and Lung Compliance by Ole Storstein and others. Methods: balloon pressure, mouthpiece connection and Sanborn transducer
The mouth-to-esophageal difference is not a pure airway pressure drop: its elastic component must be separated. Simultaneous pressure, volume and flow information is what makes this mechanical distinction experimentally accessible.Secant versus differential airway resistance distinguishes a finite pressure-to-flow ratio from the local slope of a pressure-flow relation. If is volumetric flow rate and the corresponding airway pressure difference, defineThe secant joins the origin to the operating point. The differential value describes a sufficiently small change about that operating point. Both have units of pressure divided by flow, but they agree at every flow only for a linear relation through the origin.
An original nonlinear model is , with . For nonzero flow,Choose coefficients and when pressure is expressed in centimetres of water and flow in litres per second. At , pressure is 2 cm water, so the secant resistance is 4 and differential resistance is 6 in . At , pressure is 2.64 cm water. The tangent predicts an increase cm water; the exact increase is 0.64. Their difference is the quadratic remainder .
At negative flow the pressure reverses sign in this odd model, but both resistance measures remain positive. At zero flow the ratio needs its limiting definition, which here equals . These are properties of the stipulated curve, not measured airway coefficients.
Operating-point time constants with nonlinear airway resistance use the differential value. Linearizing a flow equation around a fixed operating point gives . If that flow charges a local elastic compartment of lung compliance , the small-perturbation time constant is , rather than an arbitrary finite secant ratio multiplied by .
An experiment must identify the pressure drop belonging to the airways. Mouth-to-pleural pressure also contains elastic loading, so its slope is not automatically airway resistance. The pulmonary-function text treats airway resistance and lung compliance separately, and the 1959 study's differential pressure and balloon apparatus illustrates the need for multiple mechanical measurements.[ref]
Pulmonary Function Testing by Warren M. Gold and Laura L. Koth. Airway Resistance and Static and Dynamic Compliance
[ref]Airway Resistance and Lung Compliance by Ole Storstein and others. Methods, mouthpiece pressure and intra-esophageal balloon
Operating-point time constants with nonlinear airway resistance describe small deviations about a specified flow and volume trajectory. The finite ratio of pressure to flow does not generally give the resistance governing those deviations. Instead, local response uses the derivative of the pressure-flow curve at the operating flow.
In an original one-compartment model, let elastic lung compliance be locally constant and let resistive pressure be . With volume measured relative to an elastic reference,A baseline trajectory has flow . Linearizing for small perturbations givesWhen the local coefficients are constant, the time constant is . It is the differential airway resistance times compliance, rather than the secant ratio .
For the stipulated curve , with numerical pressure in centimetres of water and flow in litres per second, while . With , the local time constant is 1.2 s, not 0.8 s. A small added pressure step has volume responseAfter 0.8 s it has reached about 48.7% of its final increment; using the secant-based time constant would incorrectly predict 63.2%. The numbers describe the local model, not measured airway coefficients.
Baseline-trajectory dependence of local respiratory time constants is essential. An isolated filling compartment cannot maintain nonzero flow at a truly stationary volume. The example therefore refers to a driven baseline trajectory, or another arrangement with balancing flow. For an undriven stationary compartment, the baseline flow is zero. A large transient that substantially changes also changes , so one constant time scale need not describe its whole course.
A primary ventilator study compared mechanics measurements across inspiratory and expiratory methods and varied flow-related settings.[ref]
Static and Dynamic Measurements of Compliance and Driving Pressure: A Pilot Study by Pierre Tawfik and others. Introduction, methods C and D; Study Procedures
Report the operating state, perturbation size and pressure references with any inferred time constant. A single finite pressure-flow ratio does not establish a universal relaxation property.Baseline-trajectory dependence of local respiratory time constants means that the linearized response can change as volumetric flow rate and elastic state change during a breath. A time constant measured at one operating point need not describe the entire trajectory, even when the underlying constitutive laws stay fixed.
In an original one-compartment model, let pressure satisfy . Around a specified baseline , a small perturbation obeysThe frozen-coefficient local time constant is when both coefficients are positive. For zero perturbing drive, the actual response is insteadThis follows by an integrating factor for the linear differential equation. The accumulated relaxation rate, rather than one selected endpoint value, controls the decay.
Choose a stipulated driven baseline volumetric flow rate L/s with s. Let elastic compliance be 0.20 L per cm water and resistive pressure be in the corresponding numerical units. Then and . The local time constant decreases from 1.2 s toward 0.4 s as the baseline volumetric flow rate falls.
Writing numerical time , the homogeneous perturbation has the exact relative amplitudeAt one second it is about 0.322. Freezing the initial time constant would instead give ; freezing the limiting value would give . These are distinct approximations to a changing-coefficient problem, not measured patient responses.
The baseline here is explicitly driven: its external pressure must sustain the chosen trajectory. It is not claimed to be the natural unforced expiration law of the nonlinear compartment. The primary respiratory pilot study compares methods that depend on volumetric flow rate, pressure and expiratory time scales, and discusses why expiration need not have one exponential time constant.[ref]
Static and Dynamic Measurements of Compliance and Driving Pressure: A Pilot Study by Pierre Tawfik and others. Methods C and D; Study Procedures; Discussion
A local fitted value belongs to its operating trajectory and observation interval.Respiratory rate is the number of breathing cycles per unit time. It is one component of pulmonary ventilation, alongside the volume moved in each breath. Equal respiratory rates can therefore accompany different total airflow, and equal total airflow need not produce equal effective alveolar ventilation.
The pleura is a serous membrane with a visceral layer covering a lung and a parietal layer lining the adjacent thoracic wall. The intervening pleural cavity normally contains a thin fluid film. Sliding at this interface permits breathing movements while preserving mechanical coupling between the lung and thorax.[ref]
Bronchi, Bronchial Tree, and Lungs by the National Cancer Institute. Pleural layers and fluid
A respiratory muscle changes the geometry or pressure of the breathing apparatus. The respiratory diaphragm enlarges the thorax during inspiration; intercostal muscles and, under suitable conditions, accessory muscles contribute. Quiet expiration can be largely passive, whereas forceful expiration recruits additional muscular activity.
Articles by others on the same topic
There are currently no matching articles.