The changing illuminated fraction of Venus seen from the Earth. A full sequence including gibbous phases excludes the classical near-side Ptolemaic arrangement but is compatible with both a heliocentric model and a Tychonic system.
An astronomical selection function specifies the probability that an object or its measured data enter a catalogue. It can depend on sky position, flux, colour, angular extent, time sampling and follow-up success. A generative calculation combines the parent population, instrument response, measurement noise and inclusion rule. A selection cut on latent properties must be propagated through the measurement likelihood rather than substituted for a cut on observed quantities.
For population parameters and an inclusion region in measured-data space, a selected datum has density . The normalization integrates the noisy measurement model and population over the actual selection region. Inference must also specify what is conditioned on: deterministic selection information already contained in the conditioned data must not be counted twice.
survey completeness is the fraction of a specified true source population recovered by a survey, conditional on properties such as flux, size and sky position. Injecting simulated sources into realistic data and applying the actual detection pipeline measures recovery probability. Completeness differs from purity: recovered objects can include false detections or incorrectly identified sources.
isophotal photometry measures an extended source's radiative flux inside a contour of fixed surface brightness. It misses light outside that contour. The fraction lost depends on the intrinsic brightness profile, convolution with the point spread function, sky background estimation and the chosen threshold. A per-pixel threshold is not a fundamental limit on fitting or averaging many faint pixels together.
X-ray astronomy infers the properties of celestial sources from their X-rays. It requires instruments above the strongly absorbing layers of Earth's terrestrial atmosphere. Riccardo Giacconi's 2002 Nobel lecture connects the early rocket detections to later grazing-incidence X-ray optics, which collect photons over a large entrance area onto a small detector.[ref]
The Dawn of X-Ray Astronomy by Riccardo Giacconi. The Dawn of X-Ray Astronomy, introduction and section 4, pp. 123–124
The measurement is an inverse problem: a count rate mixes incident photon arrival rate, detector response, and background. A point-like astronomical source produces a direction-dependent excess as the instrument scans; diffuse X-ray background contributes over many directions. Neither a count excess nor a narrow feature by itself determines the emission mechanism. The useful progression is from detecting an excess, to locating it, to measuring its spectrum and light curve.
In 1962, Riccardo Giacconi and colleagues flew three Geiger counters to search for lunar X-ray fluorescence. Different mica thicknesses tested penetration; lampblack blocked ultraviolet. Each counter sat in an anticoincidence detector using a scintillation counter to reject cosmic rays. There was no mechanical collimator. Rotation scanned the sky; optical sensors supplied orientation.[ref]
Evidence for x Rays From Sources Outside the Solar System by Riccardo Giacconi and others. pp. 439–440, apparatus and readout
Counts were sorted by azimuth; a faulty counter and tumbling descent data were excluded. A directional peak lay above a diffuse component. Window, altitude and angular responses tested X-rays against charged particles; the Moon's nondetection checked optical leakage. The authors argued for an origin outside the Solar system, while residual cosmic ray background was not directly measured and source size, position and spectrum remained assumption-dependent.[ref]
Evidence for x Rays From Sources Outside the Solar System by Riccardo Giacconi and others. pp. 440–443, Figs. 1–4 and concluding limitations
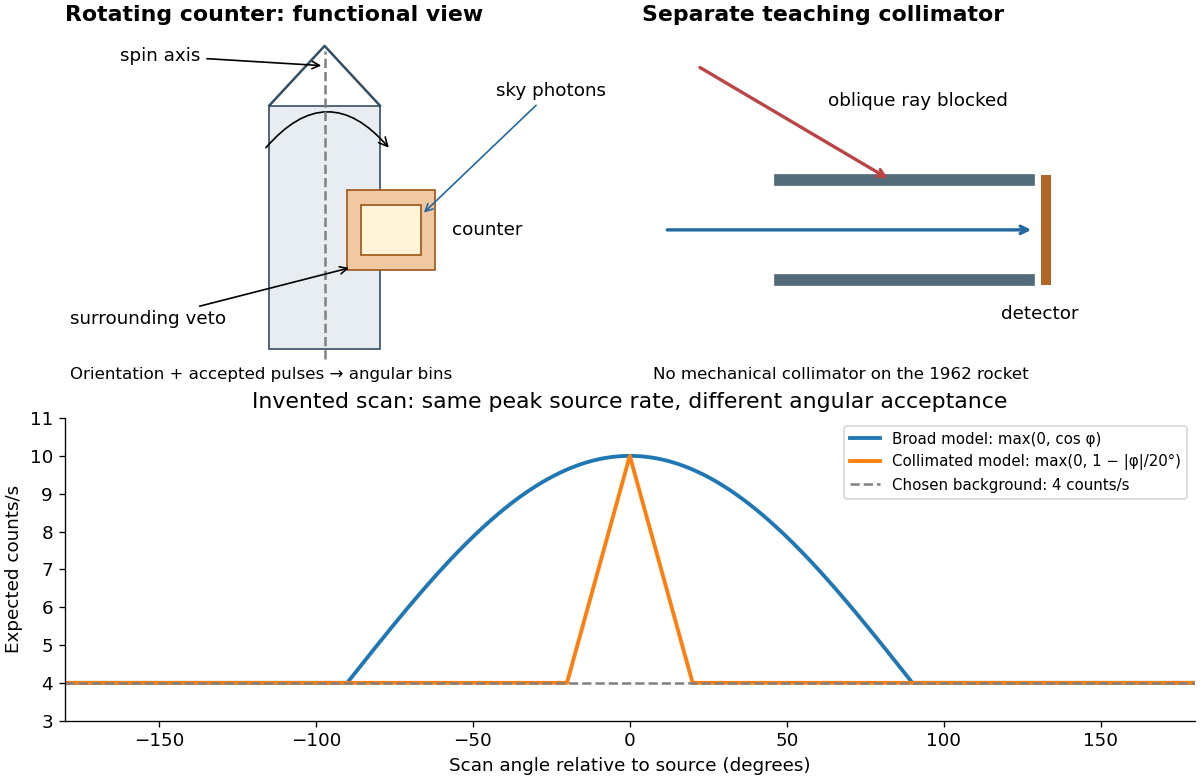

A simple original forward problem makes the distinction precise. Let be the scan azimuth, let be a dimensionless directional response with maximum one, let be a source's band-integrated photon arrival rate per unit area, let be its on-axis X-ray effective area, and let be a constant accepted background rate. The expected rate isFor a broad illustrative response , the full width at half maximum is : at . For a one-dimensional ideal collimator model , the full width at half maximum is . Choosing narrows the response sixfold without focusing any additional photons. These are teaching response functions, not reconstructions of the rocket's window transmission or geometry. A narrower scan peak can reflect the instrument response even when the source is unresolved.
Scorpius X-1 is the celestial X-ray source associated with the 1962 discovery, subsequently located more precisely. The discovery scan did not supply a resolved image of this X-ray binary.[ref]
Tracing a Bright Path by NASA HEASARC. Tracing a Bright Path: discovery scan and identification
Diffuse X-ray background is X-ray emission spread over the instrument's observed sky rather than assigned to a single resolved source. Diffuse appearance at finite angular resolution does not prove emission by a continuous medium: many unresolved point-like astronomical sources can also give a smooth signal. Instrumental background is a separate contribution, even though both enter measured counts.
X-ray effective area is the area that converts an incident photon arrival rate per unit area into an accepted count rate. For a fixed direction and a sufficiently narrow energy interval, writeHere is projected geometric area, is transmittance through windows or optics, is quantum efficiency, is the probability that a detected source event passes event selection, and is live observing time. is an expected value, not a guarantee of an integer count. Multiplication follows by counting incident photons over area and time, then applying the successive conditional acceptance probabilities. Live time already excludes intervals when the instrument cannot record events; multiplying by a live-time fraction again would count the same loss twice.
For an invented narrow-band example, choose , , , and . Then . A source with observed for gives . here counts photons; converting it into observed radiative flux requires their energies. If all have energy , the corresponding radiative flux is .
A broad spectrum instead requireswhere is the differential photon arrival rate per area and energy. A single band-averaged X-ray effective area depends on the assumed spectrum. This is why a count rate alone cannot give an assumption-free radiative flux.
Background subtraction must account for uncertainty in the background measurement itself. In an original idealized experiment, an on-source exposure contains source and background, while an independent off-source exposure contains background alone. Assume stationary rates and identical background acceptance per unit live time. With , let independent counts obey Poisson distributions:Then linearity of expectation and addition of variances for independent random variables giveThe result concerns accepted source counts , after all efficiencies. For large counts the normal approximation gives the descriptive signal-to-noise ratio in photon countingThis plug-in ratio is not an exact null-hypothesis significance. Small counts require the discrete Poisson model; searching many sky directions also changes a detection claim's p-value.
Choose and , with observed counts and . Thus , , and the estimated standard deviation is counts. The inferred uses the preceding and includes counting uncertainty only. The descriptive ratio is . Treating the scaled off-source background as exact would omit 200 counts squared from the estimated variance.
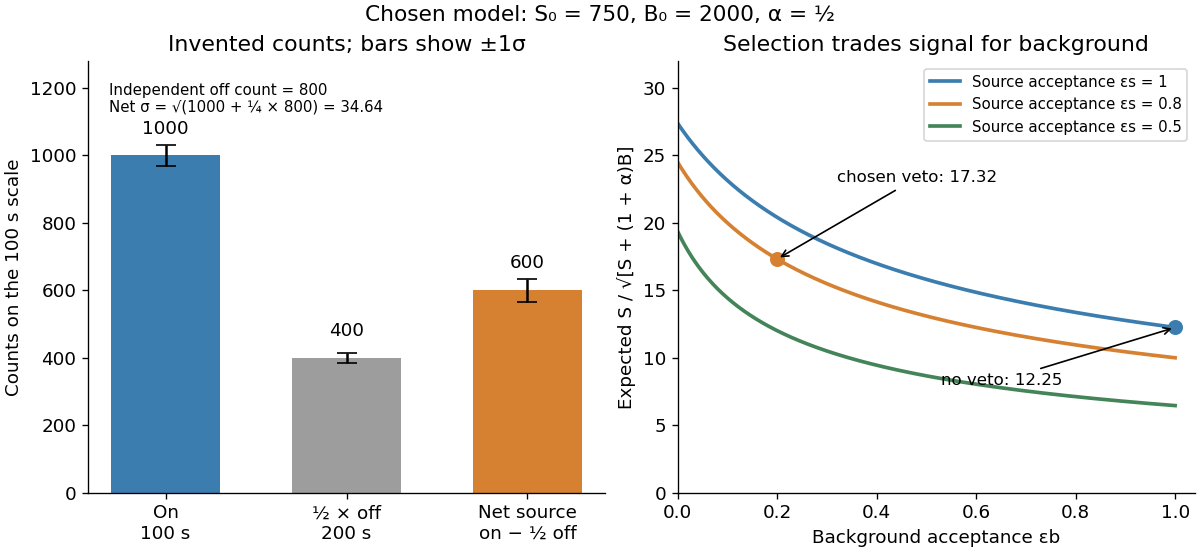
Invented on-off counts and the effect of background rejection
. All numbers are chosen teaching values, not historical measurements. Independent off-source counts contribute uncertainty. The rejection curves hold the source acceptance fixed within each labelled case. Details.
For a selection-design comparison, suppose before a veto the expected source contribution is , the on-source background is , and . Let source acceptance be and background acceptance be . Then , , and , whereas omitting the veto gives . Rejection helps because the background is reduced enough to compensate for lost source events. A different veto can make matters worse; source efficiency and background rejection are separate probabilities. This comparison is an independent teaching example, not the efficiency calibration used above.
If both exposure times grow with fixed and stationary rates, and imply . Four times the live time doubles this ideal ratio. Misestimated background rates, uncertain X-ray effective area, and source variability can defeat that scaling; longer exposure does not remove systematic error.
Grazing-incidence X-ray optics redirect X-rays by shallow specular reflections along mirror surfaces. Riccardo Giacconi's lecture describes coaxial paraboloidal and hyperboloidal mirrors using two reflections, and the later Einstein observatory's imaging capability. Focusing separates collecting area from detector area: the collected source signal can remain large while the detector background is drawn from a smaller region.[ref]
An ideal lossless geometrical optics calculation explains the shallow angle. Take vacuum refractive index one and a material with real refractive index , where . Let be the grazing angle measured from the surface. Snell's law written for angles from the normal requires . A propagating transmitted ray exists only if . Thus the ideal threshold isThe last step uses the Taylor series . For a chosen , radians, or . Absorption makes the refractive index complex and softens this ideal threshold; surface roughness and alignment errors also reduce throughput or worsen the point spread function. These are reasons to calibrate X-ray effective area and angular resolution, rather than assume that reflection is perfect.
The benefit can be quantified without specifying a historical telescope. Suppose a source retains fraction of its counts inside an extraction region, while a uniform detector background contributes counts over detector area . In the background-dominated limit of the same independent on-off model,Reducing by a factor of 100 at fixed and X-ray effective area improves this ideal ratio tenfold. A collimator restricts admitted directions; focusing optics bring selected rays together. An image also separates nearby sources and identifies clean background regions, connecting optical design directly to a better constrained inverse problem.
Radio astronomy studies celestial sources through their radio waves. The long wavelengths make angular resolution expensive: a filled telescope of diameter has a characteristic diffraction scale of order . Aperture synthesis instead combines measurements from separated antennas, using their separations to measure fine structure while their individual collecting areas determine how much radiation they receive. A kilometre-wide arrangement of small antennas does not collect the power intercepted by a filled kilometre-wide dish.
The equivalent input noise temperature of the antenna-plus-receiver system is defined by available noise power in one matched polarization of waves mode. It includes receiver noise and the appropriate sky and instrumental contributions. It is not generally the physical temperature of a single component.
The system-equivalent flux density is the unpolarized spectral flux density that would produce an antenna temperature equal to . With effective collecting area , . The factor two follows from one polarization of waves measurement of an unpolarized source. State effective area and polarization of waves conventions when comparing sensitivities.[ref]
A radio telescope is an astronomical instrument that receives radio waves using an antenna and associated receivers. A single dish measures radiation over its directional sensitivity pattern; separated elements can supply complex visibilities for aperture synthesis.
Interplanetary scintillation is rapid variation in the received strength of a compact astronomical radio source, produced by propagation through fluctuating electron density in the solar wind. Its dependence on source angular size can help distinguish compact sources. It is a propagation effect, distinct from intrinsic periodic emission by a pulsar.
Aperture synthesis reconstructs the sky's brightness from complex visibilities measured at different interferometric baselines. Each measurement constrains a Fourier transform component of the brightness, rather than supplying a little photograph. Combining many such components can distinguish sources that each individual antenna leaves unresolved. The remarkable economy is that changing separations and the rotation of Earth can provide many measurements with only a few physical antennas.
Martin Ryle's Cambridge group made aperture synthesis a practical method of astronomical imaging at the Mullard Radio Astronomy Observatory. Cambridge's institutional history connects that work with the One-Mile Telescope and its larger successors.[ref]
Mullard Radio Astronomy Observatory at Lord’s Bridge by Cavendish Laboratory, University of Cambridge. Cavendish Laboratory, Mullard Radio Astronomy Observatory at Lord’s Bridge, sections Foundation and early development and A centre for radio interferometry
In his 1974 lecture Radio Telescopes of Large Resolving Power, Martin Ryle recalled the problem of distinguishing weak extragalactic sources and resolving their structure. He explained sequential wavefront sampling using one simultaneously observed element as a wave phase reference, and the saving obtained by letting Earth rotate the apparent baseline.[ref]
Radio Telescopes of Large Resolving Power by Martin Ryle. Ryle (1974), Radio Telescopes of Large Resolving Power, pp. 187–192, Figures 1 and 4
The 1974 Nobel Prize in Physics distinguished Martin Ryle's observations and inventions, especially aperture synthesis, from Antony Hewish's role in discovering pulsars. The latter is a separate astronomical discovery, with its own observational history.[ref]
The Nobel Prize in Physics 1974 by Nobel Prize Outreach. Nobel Prize in Physics 1974, award explanation and equal prize shares
The synthesized beam is the angular response produced by the sampled and weighted complex visibilities. Its characteristic width is set by the longest well-weighted projected interferometric baselines, of order , while sidelobes reflect incomplete Fourier coverage. It differs from the individual antenna primary beam, which limits the field of view.
Radio interferometry measures the spatial coherence of received radio waves. At two antennas, a receiver preserves the relative wave phase, compensates the geometric delay for a chosen phase centre, and averages a product of one signal with the complex conjugate of the other. In a complex-signal description this correlation is . Its real and imaginary parts carry two complementary components of the complex visibility; measuring only the received powers discards the relative wave phase needed for general imaging.
A finite frequency band makes delay compensation essential. If the residual delay is , the residual wave phase varies by across a band of width . Averaging these differently oriented complex contributions reduces the correlation. For an ideal rectangular band the multiplicative factor is . A phase correction at just the central frequency cannot remove this variation across the band. Long time averages can likewise smear a changing signal.
The Very Long Baseline Array is a radio-telescope array used for very-long-baseline interferometry. In a solar-deflection experiment, differential astrometry of nearby compact sources compares their apparent directions as their angular separation from the Sun changes. Measurements at several frequencies can distinguish dispersive refraction in the solar corona from achromatic gravitational deflection.[ref]
very-long-baseline interferometry correlates accurately time-referenced radio signals recorded at widely separated collectors, giving angular resolution of order wavelength divided by projected baseline. Geometric delays, frequency standards, atmospheric propagation and source structure enter the calibration. Compact maser positions and motions are one application.
A residual delay in a rectangular band of width attenuates the correlated amplitude by . Coarse delay quantization must keep this factor near one; the relevant path scale is . Separately, an untracked carrier phase has error . Fine phase rotation can remove that central-frequency phase while leaving the band-dependent decorrelation, so delay-step specifications must state both bandwidth and compensation architecture.
Independent visibility samples are combined with weights proportional to inverse noise variance. This maximizes the point-source sensitivity for correctly calibrated samples. Dense regions of the sampled Fourier plane receive more total weight; tapering the long baselines can further emphasize extended structure at the cost of angular resolution. A source-template filter instead also weights by predicted source response.
For equal antennas, weak-source independent receiver noise, natural weighting and total on-source time , the point-source rms in one polarization of waves is the displayed value. There are independent cross-correlation baselines, each with real-component error . Combining independent polarization of waves estimates reduces the rms by . Correlation losses divide the sensitivity by an efficiency factor; weighting, flagging and an extended source change the effective sensitivity.[ref]
The phase centre is the reference sky direction for removing geometric delay and its associated wave phase. An unresolved source exactly there ideally has constant complex visibility after calibration; a displaced source has a baseline-dependent wave phase.
An interferometric baseline is the displacement between two antennas. For a unit line of sight toward the phase centre, its projection onto the plane of the sky isHere is the speed of light. The signed delay depends on which receiver is delayed; the geometric path difference's magnitude does not. If is a unit tangent in the direction being imaged, the dimensionless coordinate is a spatial frequency, measured in cycles per radian of small sky offset. A single pair gives fringes of angular period along that tangent. This period specifies one measured oscillation; it does not specify a whole image's angular resolution or eliminate ambiguous source arrangements.
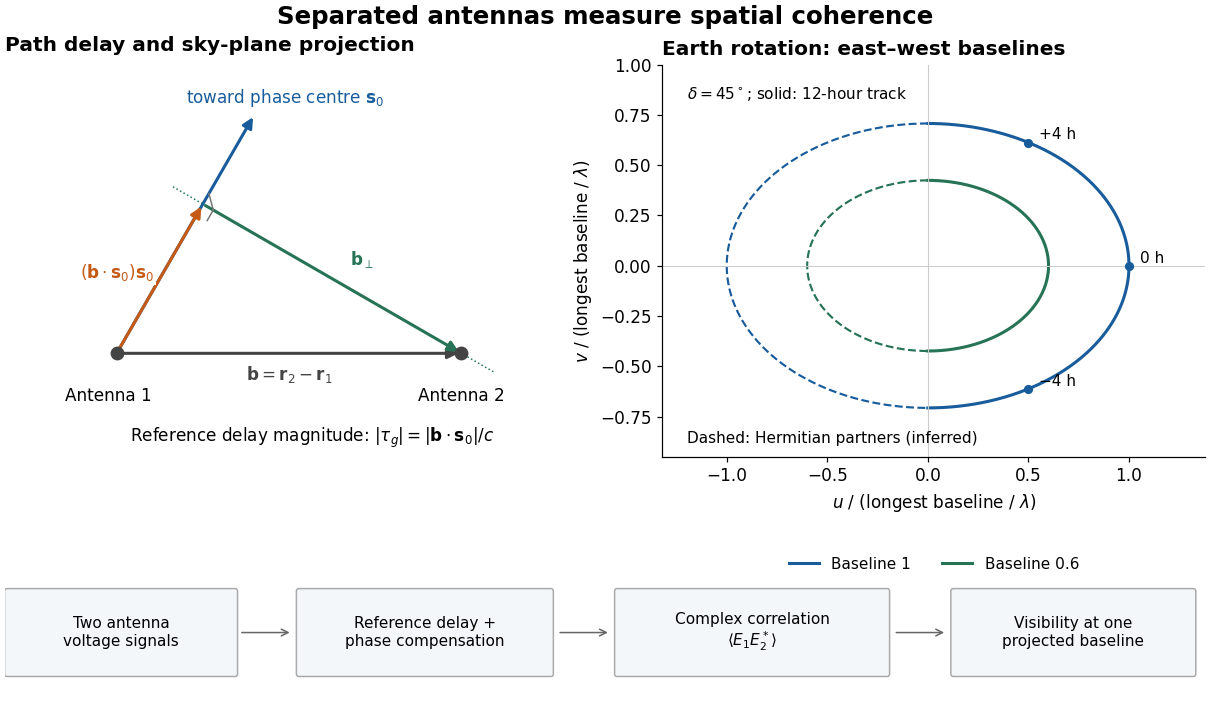
Geometric delay, projected baseline, and a schematic Earth-rotation track; original geometry, not telescope data
. Details. 
The left panel separates the component producing the reference delay from the component measuring angular structure. The right panel shows a possible Earth-rotation aperture synthesis track, with its opposite complex conjugate track. Those opposite samples provide the symmetry required by a real brightness distribution; they are not independent extra observations.
The shortest useful projected baseline sets the lowest sampled spatial frequency, of order , and hence an angular scale . Operational maximum recoverable source sizes also depend on source shape, coverage, weighting and primary beam. The longest baseline sets a different scale, the synthesized angular resolution. The number of antennas alone does not fix either limiting baseline or supply zero-spacing total power.
The difference in plane-wave propagation time between two antennas is the projected baseline along the source direction divided by the speed of light. Its sign depends on the ordering of the receivers. A monochromatic signal acquires relative phase ; its change with Earth rotation is compensated by fringe stopping for the chosen reference direction.
For an east-west baseline and phase-centre zenith angle in its vertical plane, path compensation subtracts . An offset leaves . The complex correlation therefore has phase , up to receiver-order convention. Equal cable lengths do not remove this sky-dependent path difference.
Earth-rotation aperture synthesis uses Earth's changing orientation to vary a fixed ground baseline's projection onto the plane of the sky. In two dimensions, and are the components of along two perpendicular sky tangents. Tracking one field traces a curve in this plane; changing the physical baseline supplies other curves. A track samples Fourier transform coordinates, rather than the brightness along a track across the sky.
For a horizontal east–west baseline of length , choose the sky-axis signs so thatwhere is hour angle and is declination. The ellipse follows by projecting the rotating baseline onto sky tangents. At a celestial pole it is a circle; near the celestial equator its minor axis collapses. Thus the same ground layout constrains different sky directions unequally. Rotation improves coverage, but does not fill every spatial frequency, and synthesis across many hours assumes that the source changes negligibly during that interval.
Radio interferometer calibration estimates instrumental and propagation effects that alter a complex visibility. A simple narrow-field model iswhere are complex receiver gains and represents additive noise. A point-like astronomical source of known position and stable strength constrains these gains: its expected complex visibility has a known wave phase and amplitude. A resolved or variable reference source requires a better source model. Errors in the reference model can be transferred into the inferred sky.
In a proposed extension, Martin Ryle described simultaneous observation of a nearby reference point source to correct atmospheric wave phase errors, using an additional dish at each element. He presented this as a possible extension, rather than the standard One-Mile Telescope arrangement.[ref]
Radio Telescopes of Large Resolving Power by Martin Ryle. Ryle (1974), p. 202: proposed reference-source correction
A complex visibility is a calibrated complex correlation of the signals received at a particular interferometric baseline. In a narrow field, with scalar radiation, the far-field approximation for an outgoing source, a narrow frequency channel, negligible noncoplanar phase curvature and a steady sky of mutually incoherent emitters,Here are small dimensionless sky-direction offsets, is brightness in the chosen channel, and is the primary beam. This is the Fourier transform of beam-weighted brightness. The two-dimensional formula requires those approximations: a wide field generally needs the third baseline coordinate and curved sky geometry.
For an explicit one-dimensional derivation, set the primary beam to one over the small field, and place independent emitters at angular offsets . Choose a wave phase convention in which, after removing the phase centre's delay, their received complex amplitudes areHere is the Kronecker delta and angle brackets denote an expected value estimated by time averaging a steady signal. The last equality states mutual incoherence: different emitters have zero averaged cross term, although each emitter's two received copies remain correlated. Multiplying and averaging givesFor continuous brightness this becomes . Real brightness implies the Hermitian symmetry ; it does not require brightness to be even. In particular, an asymmetric real source usually has a nonzero imaginary complex visibility. At zero baseline, is the total beam-weighted source strength. Ordinary separated-element correlations need not measure that zero-baseline value.
A centred uniform source of angular width has normalized visibility , with the projected baseline along that angular coordinate and . The result is the integral of the point-source complex phase over source brightness. Its first null occurs at width ; negative values are phase reversals rather than negative brightness.
With constant surface brightness over a centred angular rectangle of widths , and a nearly uniform primary beam over that rectangle, the Fourier transform separates into two one-dimensional integrals. The result is , where . The zero-spacing value is the integrated spectral flux density, while the first axial null is at . Long baselines therefore do not measure the total flux of a resolved rectangle.
Electronic compensation of the time-dependent reference geometric delay multiplies each complex visibility by an opposite reference phase. A stationary point source at the phase centre then has constant corrected phase despite Earth rotation. antenna pointing alone does not perform this correction. Off-axis sources retain the relative fringe evolution that encodes their angular offsets.
After delay tracking and fringe stopping at a phase center, an off-axis direction retains delay of order and rotation-induced fringe-rate offset of order . Averaging across a wide channel or long integration then decorrelates that direction. The displayed inequalities give order-of-magnitude small-smearing conditions; exact coefficients depend on baseline geometry, averaging window and allowed loss. A larger field or longer baseline therefore demands finer frequency and time sampling.
A point source away from the tracked direction has residual geometric delay . Averaging its frequency-dependent phase over a top-hat band gives the displayed sinc attenuation times its central-frequency complex phase. The first bandwidth null is complete cancellation, not a small-loss operating limit. Fine frequency channels preserve the information needed for later frequency-aware imaging.
The primary beam is the individual antenna pair's directional sensitivity envelope in the complex visibility equation. For identical, identically pointed elements it is the individual element's power pattern. Its angular width sets the useful field of view; the much longer interferometric baselines set finer measured scales. The primary beam and the dirty beam describe different responses.
The One-Mile Telescope used three steerable 60-foot dishes: two fixed, one rail-mounted. The movable–fixed pairs supplied two baselines simultaneously. Twelve-hour tracks at successive rail positions sampled projected spacings. Phase-switching receivers measured in-phase and quadrature correlations; adjustable delay and phase rotation compensated tracking.[ref]
The Operation of the Cambridge One-Mile Diameter Radio Telescope by Bruce Elsmore and others. Elsmore et al. (1966), sections 1–2, pp. 87–92, Figures 1–2
The readout was correlation versus time. Reference-phase subtraction should leave constant point-source phase; position offsets produce predictable variation. A source near the field's declination supplies a collimation check. Structure, instrumental error and sampling artefacts need separating.[ref]
The Operation of the Cambridge One-Mile Diameter Radio Telescope by Bruce Elsmore and others. Elsmore et al. (1966), section 4(a), p. 93; Appendix, p. 95
The dirty beam is the point spread function obtained by directly inverting the weighted sampled complex visibilities. For sampling positions and nonnegative weights with , chooseInclude each with and the same weight so that is real. Its unit peak convention means that an isolated unit point source contributes a shifted unit-height response. It is not a unit-integral convention. Sparse sampling can leave substantial subsidiary peaks, even when the longest interferometric baseline is large.
The dirty image is the direct weighted inverse Fourier transform of the measured complex visibilities:The final equality follows by substituting the point-source complex visibility and exchanging the finite sums. For continuous brightness it is a convolution with the dirty beam, with the primary beam included in the brightness when necessary. Negative values and subsidiary peaks can arise from that response even when every true source has positive strength.
Choose two point-like astronomical sources with and , where the angles are in radians and strengths use arbitrary common units. Their separation is radians. These are invented model parameters, not historical measurements. Their complex visibility follows immediately from the preceding derivation, and its squared magnitude isAt , ; at , ; at , . The unequal strengths prevent the complex visibility magnitude from reaching zero. Its modulation contains the source separation, while a common displacement of both sources changes wave phase without changing this magnitude. Amplitude alone loses that location information.
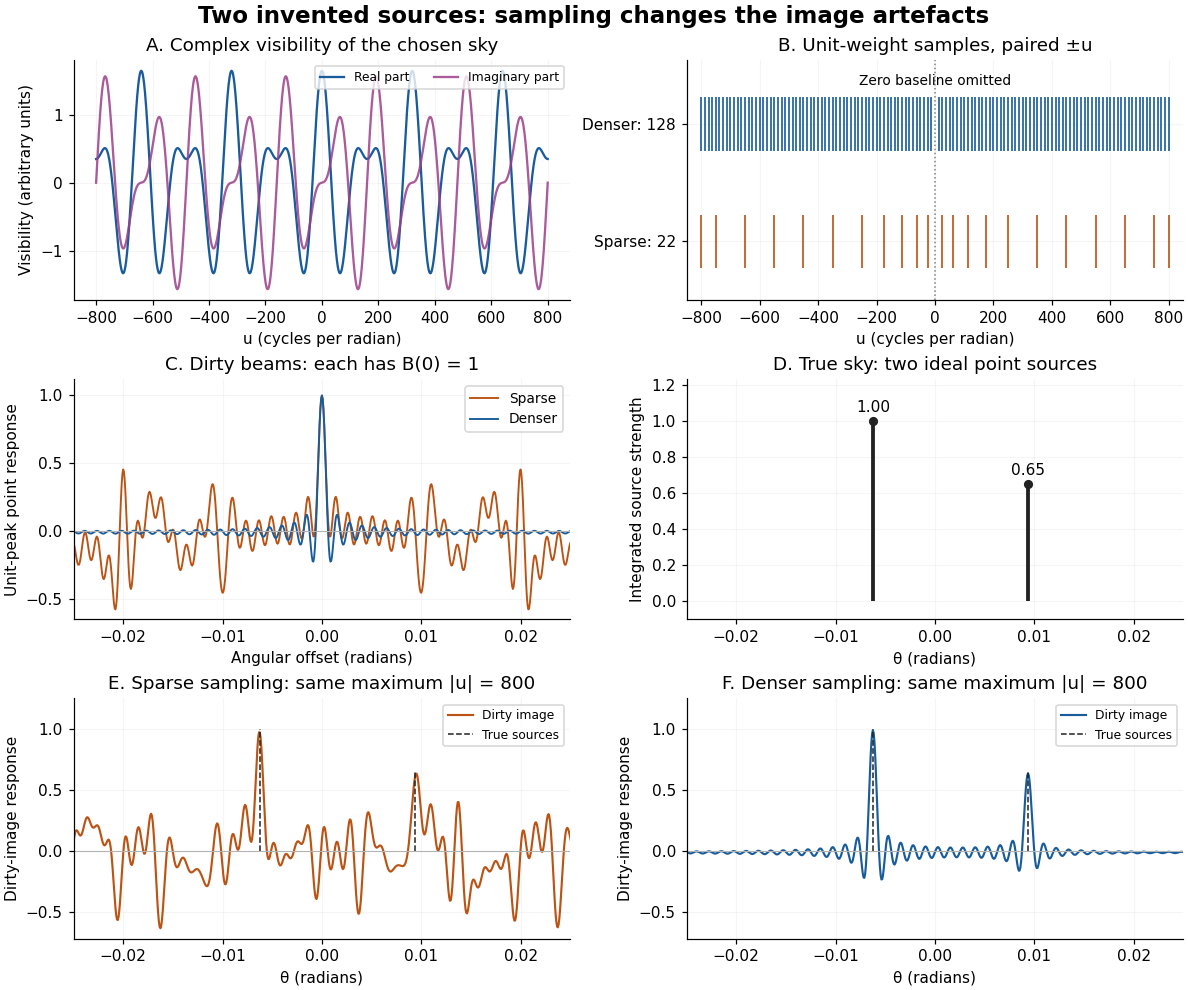
An original two-source model: complex visibility, sampling gaps, unit-peak dirty beams, and dirty images
. Details. 
The sparse case samples for ; the denser case samples every , also with both signs. All weights are one. Both reach , so their shortest fringe period is the same radians. Their dirty beams and false subsidiary features differ because the intermediate spatial frequencies differ. Neither case includes or frequencies above that maximum. The figure uses a periodic angular interval of length radians; this artificial boundary makes a discrete Fourier transform calculation exact for the chosen grid, rather than modelling an all-sky observation.
The plotted dirty image is the sum of two shifted dirty beams, not a fitted or deconvolved estimate of the source. Adding samples in this example reduces prominent spurious peaks; it does not establish a universal monotonic improvement for every weighting or sky. A missing zero baseline leaves the periodic dirty image with zero mean, so it cannot by itself recover the total positive brightness. Missing short spacings also weaken constraints on extended smooth emission.
Reconstruction is an inverse problem. A perturbation whose Fourier transform vanishes at every sampled coordinate can be added without changing the measurements: incomplete coverage leaves a null space. Nonnegative brightness, a restricted source region, or a model with a small number of components can reduce ambiguity, but each is additional information. Removing dirty beam artefacts means estimating a sky consistent with both data and such assumptions; a narrow central peak alone does not certify a unique image. Measurement error, uncertain calibration and source variability add further limitations.
For a nearby Euclidean survey with limiting flux , a galaxy of luminosity is detectable out to . Its accessible volume is therefore proportional to . With a Schechter function , counts per logarithmic interval are proportional to and peak at when . This selection suppresses faint objects relative to a volume-limited census; finite survey boundaries and cosmological evolution modify the simple law.
Angular resolution describes the smallest angular separation or structure an observation can distinguish. A physical scale at distance subtends approximately radians when . Resolving a black-hole sphere of influence therefore involves distance as well as its physical radius, and useful kinematics also require adequate surface brightness.
For a roughly square array of retinal receptors with surface density and image distance , the pitch is and its angular scale is . Reconstructing a periodic spatial pattern requires at least two samples per period under the Nyquist–Shannon sampling theorem. Receptor density alone does not specify lattice geometry, contrast sensitivity or a unique point-source resolution criterion.
Surface brightness is received flux per unit solid angle on the sky. It describes the brightness of an extended source independently of a particular aperture's area. An isophote is a contour of constant surface brightness; central surface brightness sets the available photons for resolved galaxy spectroscopy.
For a diffraction-limited telescope, collecting area scales as while a native angular resolution element scales as . Counts from a smooth resolved source per native resolution element therefore do not increase with aperture, at fixed radiance, exposure and throughput. Counts in a fixed angular bin instead grow as , and the photon-noise-limited signal-to-noise ratio grows as . Conservation of etendue and cosmological surface-brightness dimming do not forbid this latter gain.
For freely propagating radiation with the usual distance duality relation, a fixed emitted bolometric surface brightness is observed smaller by . One factor each comes from photon energy and arrival rate, and two from the relation of projected angular area to luminosity distance. In a fixed observed photometric passband, spectral shifts add a band-dependent correction; the bolometric power is not automatically the monochromatic one. A distortion created by scattering the local cosmic microwave background has a different redshift comparison, as in the thermal Sunyaev-Zeldovich effect.
For a circular projected profile with a positive power-law tail, an annulus contributes . Thus the outer integral converges only when ; diverges logarithmically and as . A shallower tail measured over a finite range must steepen or terminate before an infinite-radius extrapolation is physical. This projected criterion already includes line-of-sight integration and must not be replaced by a three-dimensional volume factor.
A Sérsic profile models projected galactic light, with index controlling curvature and chosen so that encloses half the luminosity. Its logarithmic slope is . The case is exponential; gives the traditional de Vaucouleurs form. Unlike a fixed power law, its slope steepens outward.
The case of the Sérsic surface-brightness profile, approximately useful for many bright elliptical galaxies: . Real galaxies can have other Sérsic indices.
An optically thin spherical source with volume emissivity has surface brightnessSubstitute in the line-of-sight integral and evaluate using the beta function. The condition is convergence at large distance. A core or finite outer boundary changes the projection near that boundary; the stated scaling applies between those scales.
An isophote is a contour of equal surface brightness in an astronomical image. Deviations from fitted ellipses encode additional information about a galaxy's projected stellar structure.
Writing an isophote's radial residual about its fitted ellipse as , positive extends the major and minor axes and gives a pointed, disky shape; negative extends diagonal directions and gives a boxy shape. The sign stated here is for radial residuals, not an unconverted brightness residual. Massive slowly rotating elliptical galaxies commonly have boxy isophotes, while embedded rotating disks commonly make lower-mass elliptical galaxies disky.
Sky brightness is the diffuse radiance received away from an astronomical target. Ground-based observations include atmospheric airglow, scattered light, and thermal radiation; extraterrestrial diffuse light also contributes. Its photon fluctuations contribute to the signal-to-noise ratio in photon counting.
Articles by others on the same topic
There are currently no matching articles.