
Moment-generating function Created 2026-09-24 Updated 2026-11-05
The moment-generating function of a real random variable is the exponential transformallowing the value . It always satisfies . The important regularity condition is finiteness on an open neighbourhood of zero; finiteness only at zero provides no moment information.
Under that neighbourhood condition, differentiating under the expected value gives for every nonnegative integer . In particular the mean is and the variance is . Exponential bounds dominate powers locally and justify the derivatives. For independent random variables, wherever finite, making addition easier to analyze.
For a Bernoulli random variable with success probability , . For an exponential distribution of rate , for , and it is infinite for . A standard Cauchy random variable has infinite at every nonzero real , although its characteristic function is defined for every real .
Two probability distributions with equal moment-generating functions on a neighbourhood of zero are equal. The neighbourhood condition is what makes this uniqueness theorem stronger than merely listing formal moments.
Median Created 2026-09-24 Updated 2026-11-05
A median of a real random variable is a number with at least half the probability at or below it and at least half at or above it:Equivalently, its cumulative distribution function satisfies . The non-strict inequalities matter for atoms: if almost surely, zero is its median despite having no probability strictly below or strictly above it.
A median need not be unique. If zero and one each have probability , every point in is a median. The generalized inverse selects the lower median. For a continuous strictly increasing cumulative distribution function, the unique median solves .
For a finite data set, the sample median measures the middle rather than the arithmetic average. The sample has median three and mean 22; changing 100 to a still larger value leaves its median unchanged. With finite first absolute moment, medians are exactly the minimizers of expected absolute loss, giving a decision-theoretic reason for their usefulness.
Symmetric distribution Created 2026-09-24 Updated 2026-11-05
Continuous probability distribution Created 2026-09-24 Updated 2026-10-14
A real probability distribution with a continuous cumulative distribution function assigns probability zero to each individual value. Here this is the broad meaning of continuous probability distribution. Many elementary examples are more specifically absolutely continuous probability distributions, described by a probability density function with respect to Lebesgue measure. Some texts use "continuous" for that narrower class. The Cantor distribution shows why the distinction matters: its cumulative distribution function is continuous, yet no probability density function with respect to Lebesgue measure represents its whole law. [ref]
https://ocw.mit.edu/courses/6-436j-fundamentals-of-probability-fall-2018/9797310bed4c7f5b5d40d007783eec8d_MIT6_436JF18_lec04.pdf. MIT Lecture 4: continuous CDFs and the singular Cantor example
. Discrete probability distribution Created 2026-09-24 Updated 2026-10-14
A discrete probability distribution is a probability distribution concentrated on a finite or countable set of possible values : a random variable with this law satisfies . Its probability mass function assigns a probability to each value:Thus the probability of an event is obtained by adding masses, rather than integrating a probability density function. The possible values need not be equally spaced, or even integers. When the relevant moments are finite, its expected value and variance are
For a constructed example, assign values masses . They sum to one; , , and . Hence the variance is . A mean can lie between possible values: no outcome here equals .
The useful organizing question is what an experiment records. One yes/no indicator random variable gives a Bernoulli distribution; a success count in a fixed number of independent attempts gives a binomial distribution; the attempt number of the first success gives a geometric distribution. A Poisson distribution describes an event count under different assumptions. Naming the quantity first helps prevent selecting a familiar formula for the wrong experiment.
Quantile function Created 2026-09-24 Updated 2026-10-14
The quantile function converts a cumulative probability level into a value. For a cumulative distribution function and , use the generalized inverseIt selects the first threshold reaching the requested level. The infimum handles jumps and flat portions, so this construction does not require an ordinary inverse function. Other endpoint conventions are possible at or ; the open probability interval avoids those issues. NIST introduces the inverse-direction question as the percent point function. [ref]
https://itl.nist.gov/div898/handbook/eda/section3/eda362.htm. NIST: cumulative distribution and percent point functions
.For the finite example under probability distribution,Thus , , . The value at is still zero, because already reaches that level. For on , the quantile function is , giving .
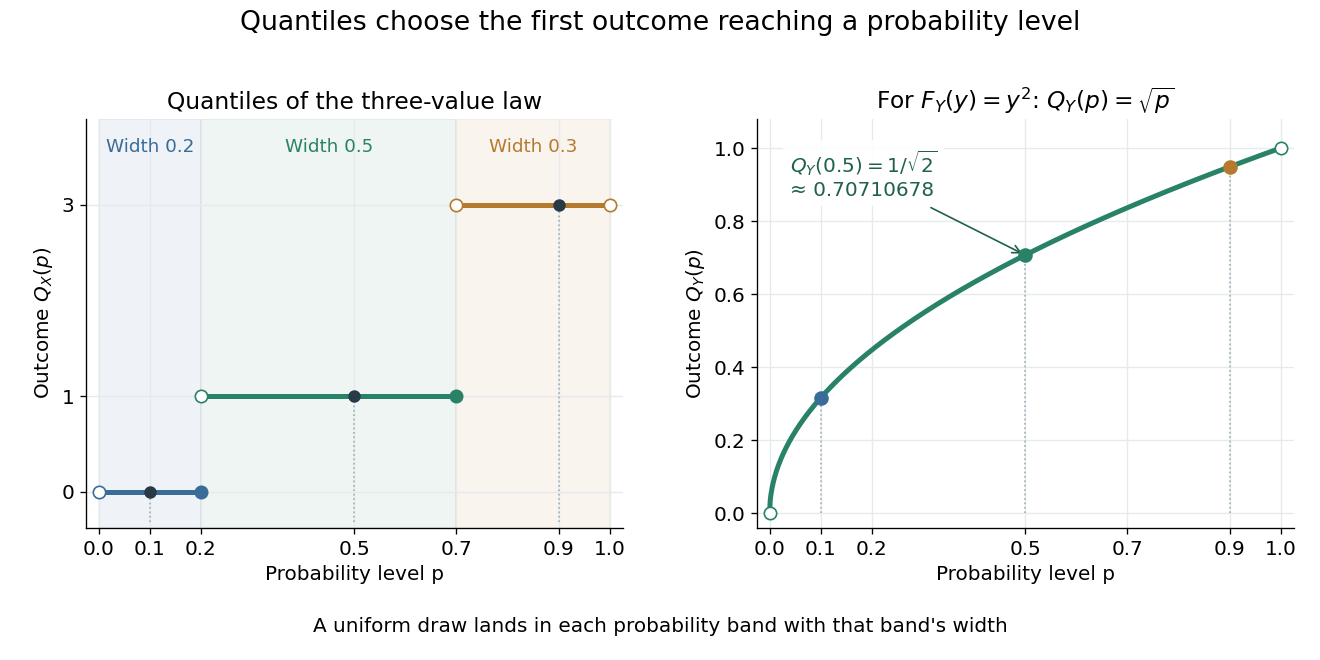
A median is a central threshold; supplies one, though a median need not be unique. The same quantile function becomes a sampling algorithm through inverse transform sampling. Jumps in become flat bands in , precisely the mechanism needed to assign positive probability to one outcome.
Probability mass function Created 2026-09-24 Updated 2026-11-05
For a discrete probability distribution, the probability mass function of its random variable isThe sum ranges over its finite or countable set of possible values. An event's probability is the sum of the masses of the included values. For the example under probability distribution, . The cumulative distribution function sums masses below a threshold; its jump at a value equals that value's probability mass. This differs from a probability density function, whose height is not a point probability.
Probability generating function Created 2026-09-24 Updated 2026-10-18
For a nonnegative integer-valued random variable , write . Its probability generating function packages the entire probability mass function into one power series:This domain is guaranteed, even for complex , because . At the constant monomial is one, including when : the convention here gives . Also . The power series may converge beyond this domain, but that needs an additional argument. Encoding a probability distribution this way turns convolution of independent random variables into multiplication.[ref]
Random: Probability, Mathematical Statistics, Stochastic Processes by Kyle Siegrist. Expected Value, §6 Generating Functions, Basic Theory, The Probability Generating Function: definition, absolute convergence, inversion, and the independent-sum identity
Cauchy distribution Created 2026-09-24 Updated 2026-11-05
The Cauchy distribution with location and scale has probability density functionThe standard Cauchy distribution has , , characteristic function , and infinite first absolute moment.
Cumulative distribution function Created 2026-09-24 Updated 2026-10-20
The cumulative distribution function of a real random variable isIt records the probability accumulated up to a threshold. It is a nondecreasing function and is right-continuous; its limits are zero at and one at . These properties follow from ordered threshold events, continuity from above of a measure, and continuity from below of a measure. A cumulative distribution function determines the entire probability distribution on the real line. [ref].
For ,where is its left-hand limit. The second formula measures a jump. Thus ; changing an endpoint is harmless only when its point probability is zero.
For the finite example under probability distribution, is below zero, on , on , and on . In particular , but , so the jump gives . For the density example, on , and its increase from to is .
When an absolutely continuous probability distribution has probability density function , its cumulative distribution function is and almost everywhere. A continuous cumulative distribution function by itself does not guarantee such a density: the Cantor distribution is an important exception.
Beta distribution Created 2026-09-24 Updated 2026-10-20
The beta distribution is an absolutely continuous probability distribution for a random variable between zero and one. It can describe uncertainty about a probability, such as an unknown coin's chance of heads. For any real , its probability density function isand zero outside . The normalizer is the Euler beta function, related to the gamma function by the beta-gamma identity:Thus the probability density function integrates to one. [ref].
The endpoint behavior explains why the restrictions are exactly : near zero the probability density function behaves like a constant times , and near one like a constant times . These improper integrals converge for positive parameters, even when the probability density function diverges at zero for or at one for . There is no probability mass at either endpoint: . A probability density function's height is not a probability; an interval's probability is the area under it.
Some useful examples of the beta distribution are:
- is the uniform distribution on , with probability density function .
- has probability density function : values near one half are favored, and it is a symmetric probability distribution about one half.
- has probability density function . Its mean is and its variance is ; most of its area lies toward the lower end.
- is the arcsine distribution, with probability density function . It favors values near both endpoints despite having mean ; its variance is .
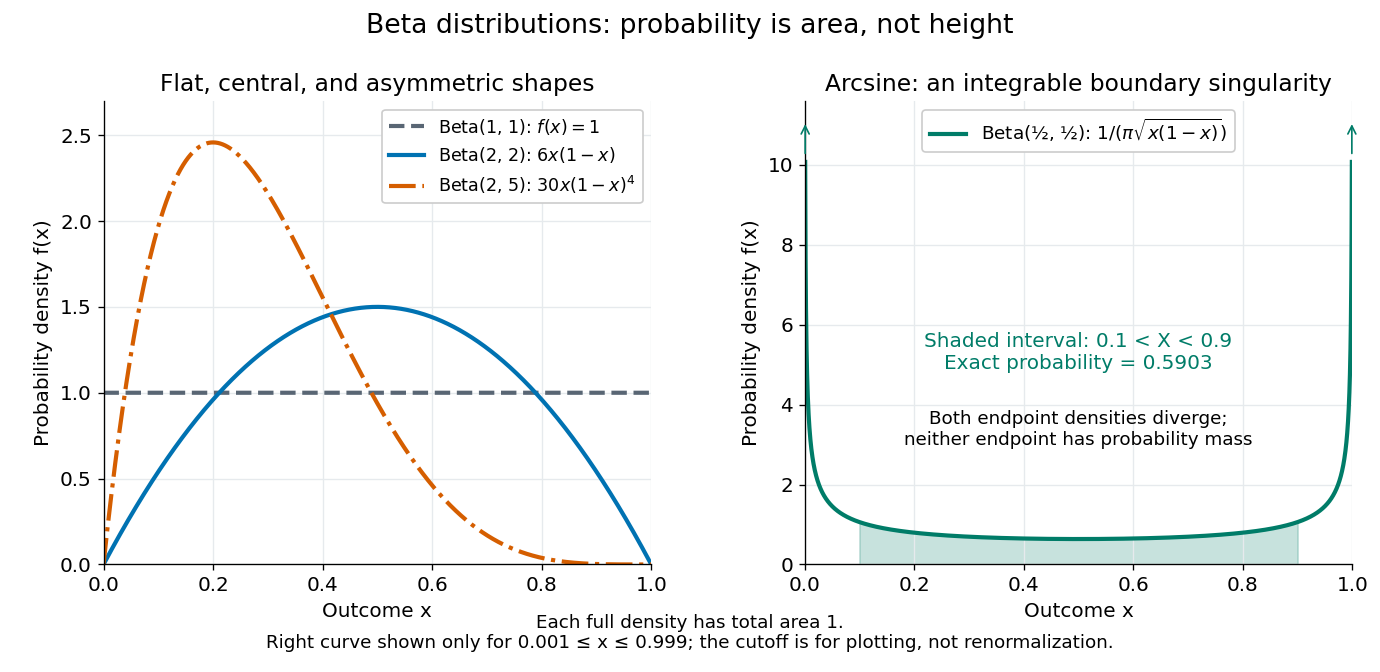
The arcsine distribution curve is plotted only for ; its finite plotted ends do not represent finite endpoint values of the probability density function. Using the inverse sine, the shaded central interval has exact probability , calculated analytically rather than by treating the cropped curve as normalized.
To separate location from spread, write and . The mean and variance of the beta distribution areThe mean specifies the balance between the parameters; their sum controls concentration about that mean. Multiplying both parameters by the same positive number preserves the mean and changes the variance. Larger puts more area near and makes the probability density function taller there; the total area stays one. Small allows much greater spread, sometimes favoring the endpoints rather than the mean itself.
For example, keeping mean and taking gives the beta distributions , , and . Their variances are , , and , respectively. Parameters need not be integers.
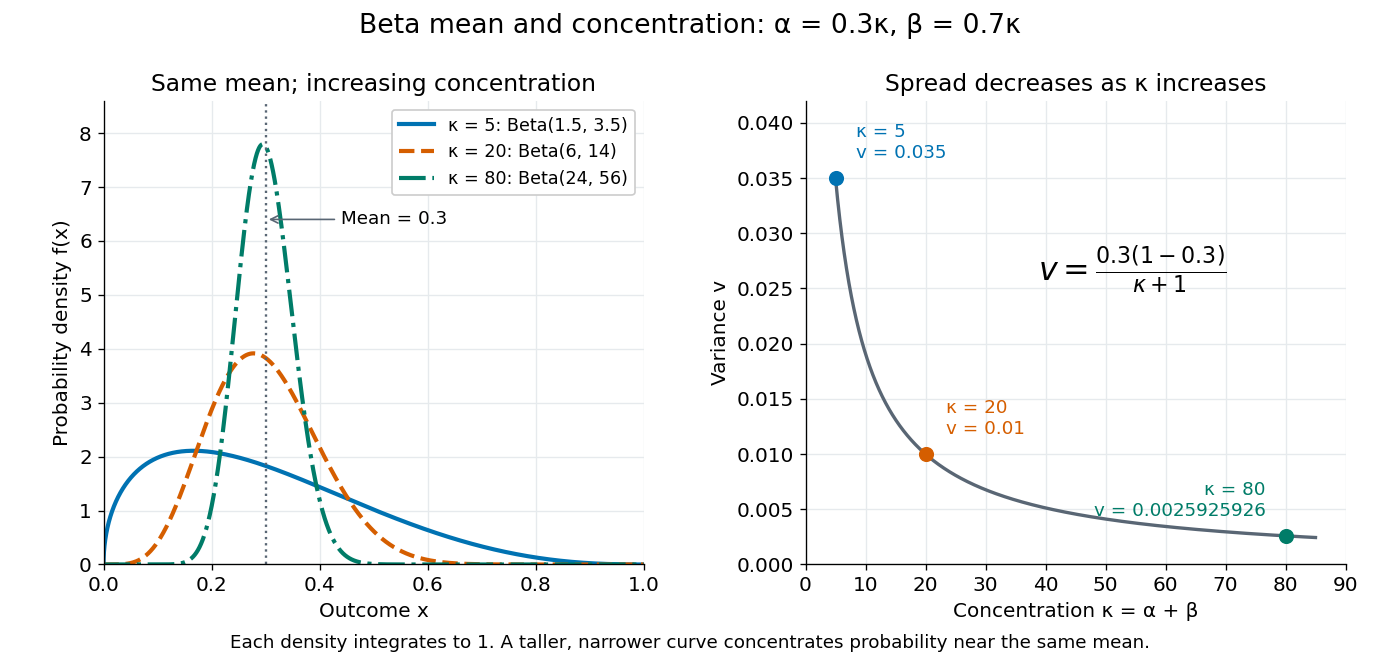


The formulas follow from two short moment calculations. Multiplying the probability density function by or increases the first parameter of the Euler beta function:Apply the Gamma function recurrence to the beta-gamma identity, then subtract from to obtain the variance.
The beta distribution is especially convenient as a prior distribution for the unknown success probability of Bernoulli trials. The Beta-binomial conjugacy says that successes and failures update a prior distribution to a posterior distribution . For example, suppose a coin has prior distribution and we observe eight heads and two tails. Its posterior distribution is then , with posterior mean . [ref]
https://ocw.mit.edu/courses/18-05-introduction-to-probability-and-statistics-spring-2022/mit18_05_s22_class15-prep.pdf. MIT 18.05, Reading 15: beta priors and conjugate updating
. Truncated distribution Created 2026-09-24 Updated 2026-11-05
A truncated distribution is the conditional probability distribution obtained by restricting a random variable to a specified event with positive probability. If its original law is , the truncated law isThe denominator renormalizes the retained probability mass to one. If has a probability density function , the truncated density is ; the same restriction and normalization apply to a probability mass function.
For example, truncate a uniform distribution on to values at least six. The retained event has probability , so the new density is on , and its mean is eight. This is the law obtained by repeatedly sampling from the original law and rejecting values outside the retained set; rejection sampling becomes inefficient when the retained event is rare.
A zero-probability restriction cannot be normalized by the displayed formula. Conditioning a continuous random variable to equal a specified value requires an additional conditional-law construction or limiting convention, rather than division by zero.
Probability continuity equation Created 2026-09-24 Updated 2026-10-20
For a wavefunction satisfying the Schrödinger equation with a real potential,This continuity equation expresses local conservation of probability.
Born rule Created 2026-09-24 Updated 2026-10-18
The Born rule connects a quantum state to measurement probabilities. Let be a complete orthonormal basis, finite or countably infinite, for a Hilbert space, and letAn ideal measurement distinguishing these basis vectors returns label with probabilityThis assignment is a physical measurement rule. Its compatibility with total probability one follows from orthonormality and normalization:The probabilities are the squared moduli, not the amplitudes themselves or the squares . [ref].
If the basis is an eigenbasis of an observable, the reported numerical value is its eigenvalue. Several vectors can share one eigenvalue; the probability of that value is then the sum over the corresponding basis labels. More generally, a projective measurement with orthogonal projections assignsfor a pure state and a general density matrix , respectively. This also covers mixed states and degenerate eigenspaces. The Born rule determines outcome statistics; the ideal conditional state change is specified separately by the Lüders rule. See projective measurement for that formulation and its assumptions. [ref]
https://quantum.cloud.ibm.com/learning/en/courses/general-formulation-of-quantum-information/general-measurements/formulations-of-measurements. Watrous, IBM Quantum Learning, Mathematical formulations of measurements, Projective measurements
.For a worked example, take the normalized qubit quantum stateThe squared moduli add to . A computational-basis measurement, equivalently a measurement of the Pauli matrix, hasThese probabilities do not depend on the relative quantum phase . Now choose the Hadamard basiswhose vectors are eigenstates of the Pauli matrix, also used by the Pauli X gate. The new probability amplitudes and probabilities areBoth probabilities are nonnegative and their sum is one. The relative quantum phase becomes visible because the two probability amplitudes add before their squared modulus is taken:
- At , and .
- At , .
- At , and .
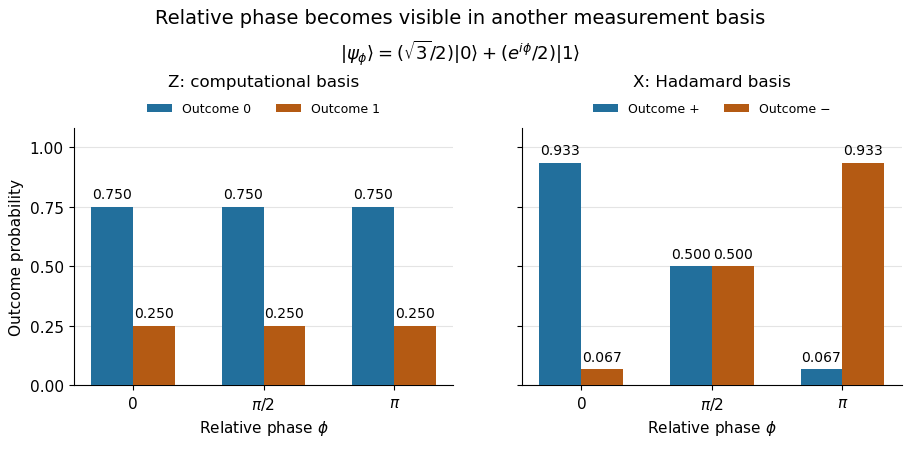
The same qubit preparation has phase-independent Z probabilities and phase-sensitive X probabilities
. Details. 
A Hadamard gate followed by a computational-basis measurement realizes these statistics, since , respectively. Compare the two bases using fresh, identically prepared copies: a preceding measurement may change the state. The quantum superposition section shows why replacing the preparation by the mixed state keeps the statistics but gives for every .
The usefulness of the Born rule is this conversion from linear algebra to experimental predictions: calculate overlaps in the basis actually measured, then take squared moduli. Its appealing geometry is that changing basis redistributes probability while preserving total squared norm. The same rule relates an energy eigenstate expansion to an energy measurement and a position wavefunction to a probability density.
Born's 1926 paper on quantum scattering interpreted the outgoing-wave coefficients in terms of the probabilities of collision outcomes; a corrective footnote specified proportionality to the square of the amplitude. This is a historical scattering formulation, rather than the general density matrix formula above. [ref]
Zur Quantenmechanik der Stoßvorgänge by Max Born. Born, Zur Quantenmechanik der Stoßvorgänge, Zeitschrift für Physik 37, 863–867, 1926
; [ref]https://www.neo-classical-physics.info/uploads/3/0/6/5/3065888/born_-_qm_for_collisions_i.pdf. English translation of Born's paper, p. 3 and footnote 1
. Minimum-degree Ramsey lower bound Created 2026-09-24 Updated 2026-11-05
For a finite simple graph of minimum degree of a graph , its ordinary two-colour graph Ramsey number satisfiesThe lower bound also applies when contains a subgraph of minimum degree at least , since a monochromatic copy of would contain a monochromatic copy of that subgraph. The paragraph before Corollary1.7 of Ordered Ramsey numbers by David Conlon and others records this ordinary Ramsey bound before comparing it with ordered Ramsey numbers.[ref]
Ordered Ramsey numbers by David Conlon and others. Printed p.5, paragraph immediately before Corollary1.7
For , this gives . Thus even without using the entire degree sequence, a large minimum degree already forces an exponential obstruction to guaranteeing a monochromatic copy.
Locally dense graph thinning lemma Created 2026-09-24 Updated 2026-11-05
For every there are and such that the following holds for and . If a finite simple graph satisfiesfor all disjoint of sizes at least , it has a spanning subgraph withfor all disjoint . This turns local lower density into an approximately uniform cut density by deleting edges.
Use the Szemerédi regularity lemma with regularity parameter much smaller than , and with a sufficiently large lower bound on the number of cells. If the number of cells is at most , choose small enough that every nonexceptional cell has size at least . Each regular cross-pair then has density . Keep each of its edges independently with probability , and delete edges in irregular pairs, within cells and incident with the exceptional set.
On a regular pair, every sufficiently large subrectangle has density within of ; on a smaller subrectangle its area is already small. Consequently the expected discrepancy on arbitrary cuts is , plus the small deleted-cell and irregular-pair budgets. A concentration inequality bounds deviations of each cut from its expectation by with probability exponentially close to one on the scale. A union bound over at most disjoint ordered pairs of vertex subsets then supplies a simultaneous choice. Both the regular partition and the sufficiently-large- hypothesis are necessary parts of this proof; an arbitrary partition does not control subrectangles.
Edge density of a bipartite graph Created 2026-09-24 Updated 2026-09-24
Dependent random choice Created 2026-09-24 Updated 2026-09-24
Dependent random choice finds a large vertex set whose small subsets have large common neighbourhoods. In a bipartite graph with parts , choose random vertices of with repetition and take their common neighbourhood ; convexity gives a lower bound for , while counting subsets of with small common neighbourhood allows their deletion.
Lovász local lemma Created 2026-09-24 Updated 2026-11-05
For a finite family of bad events with a dependency graph of events of maximum degree , the symmetric Lovász local lemma guarantees positive probability that none occurs whenever each event has probability at most and .
Random alteration method Created 2026-09-24 Updated 2026-10-03
The random alteration method samples a random object and then deletes a small number of offending elements. If few forbidden configurations occur while the desired global property already holds, the altered object witnesses existence.
There are unlisted articles, also show them or only show them.