
Jones calculus represents a fully polarized monochromatic light field by a two-component Jones vector of transverse complex amplitudes. An ideal linear optical element acts by a complex matrix; successive elements act by the ordered product of their matrices. The order matters because the transformations need not commute.
For transverse axes , an ideal polarizer transmitting has matrix , so . A quarter-wave plate aligned with those axes can be represented, up to a common phase factor and the chosen sign convention, by . It changes the relative wave phase, enabling conversion between linear polarization and elliptical polarization. Rotating the elements tests these predictions by changes in transmitted light intensity. A single Jones vector does not describe arbitrary partially polarized light; that requires statistics of the field rather than one fixed pair of amplitudes.
The optical coherency matrix records the second moments of transverse complex amplitudes. Normalize its trace to light intensity. Under a deterministic Jones matrix , . Unpolarized light has , so its output intensity is ; it cannot be represented by one fixed Jones vector.
The degree of polarization quantifies how strongly a transverse optical field departs from an unpolarized mixture. Here are the eigenvalues of its coherency matrix. For two mutually uncorrelated orthogonal linear components of intensities , . It is undefined when the total light intensity is zero. A signed difference is a separate convention that also identifies a preferred polarization direction.
Pure polarization means that the transverse components of a light field have a fixed complex amplitude ratio. A single Jones vector describes the state; its coherency matrix has rank one. Removing overall intensity and a common phase leaves two real parameters, which determine its polarization ellipse.
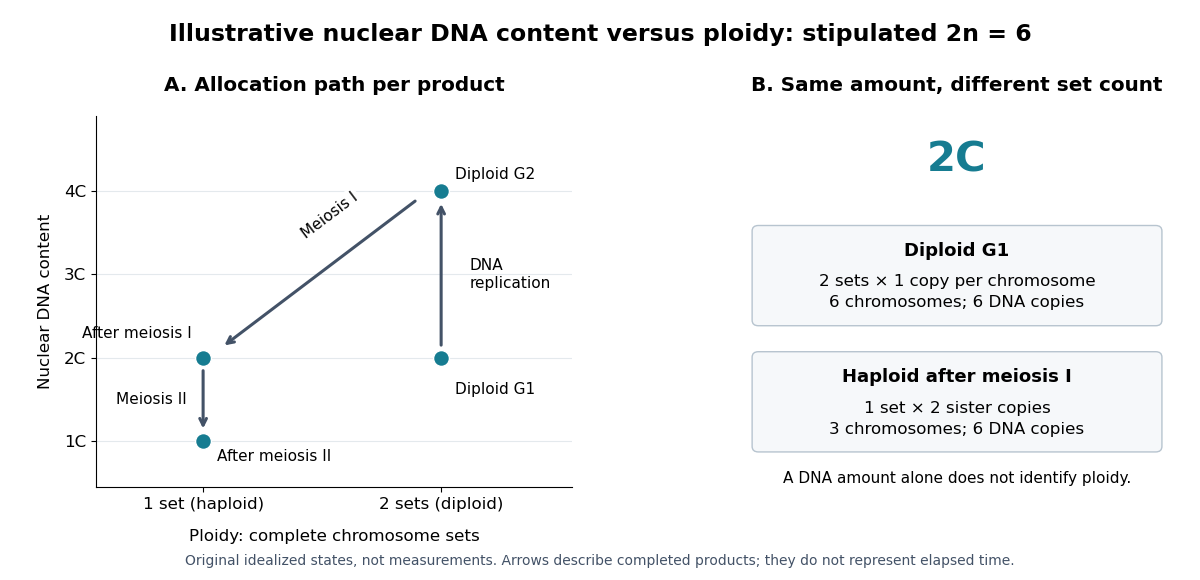
Nuclear DNA content is the amount of DNA in a specified cell nucleus. Define relative to one unreplicated haploid set of the chosen species. It includes coding and non-coding DNA and excludes DNA outside the cell nucleus, such as a mitochondrion's genome. is an amount, whereas is a chromosome count; neither fixes the other across different species.
For an original numerical model, assign the three chromosome types unreplicated DNA amounts of 3, 2 and 1 arbitrary units. Then units: diploid G1 phase contains 12 units, G2 phase 24, each completed meiosis I product 12, and each completed meiosis II product 6. The totals and check conservation after copying. Equal chromosome counts alone would not justify equal DNA amounts if the sets had different sequence lengths.

How can an experiment measure the amount independently of chromosome counting? UCL's Cell Cycle Analysis by Propidium Iodide Staining, pp. 1–2, specifies a flow cytometric DNA-content assay. Washed biological cells receive cold 70% ethanol dropwise while vortexing, then at least 30 minutes on ice. After centrifugation and two washes, ribonuclease A removes RNA that would also bind the dye. Propidium iodide stains the preparation. A flow cytometry instrument such as the listed BD LSR II records individual-event fluorescence on a linear scale. Signal area versus height or width excludes doublets and clumps; acquisition is below 400 events per second, retaining at least 10,000 single-cell events. These are protocol settings, not measured results.[ref]
For a ploidy comparison, add a known diploid G1 phase reference processed with the same staining and detector settings, and an unstained background control. These are proposed comparison controls, beyond the protocol's clump-exclusion procedure. Proportional fluorescence then estimates relative Nuclear DNA content; it does not count chromosomes. A event could be a diploid G1 phase product or a replicated haploid product; could be replicated diploid material or an unreplicated four-set cell nucleus. Peaks alone therefore cannot establish ploidy or cell cycle stage without a reference and biological context. Uneven staining, residual RNA and unresolved doublets limit this inference; two particles can mimic one event.
A transverse magnetic polarization electromagnetic wave bound to an interface through coupling to the material's collective charge response. Its fields propagate along the interface and decay away from it on both sides. In an ideal nonmagnetic lossless planar vacuum-material interface, a real negative relative permittivity below supports the bound branch described by the lossless planar surface-plasmon dispersion. Material losses generally make the propagation constant complex.
For mobile thermal electrons with a fixed neutralizing background, the Debye length is the characteristic distance over which plasma screening suppresses an electrostatic perturbation. Linearizing the Boltzmann density response and using Poisson's equation gives the displayed scale. Other mobile species contribute additively to through .
In an unmagnetized plasma, an electron displacement driven by obeys . Its dipole moment is , giving electric polarization . With , this yields the displayed relative permittivity and . Ions contribute a further negative term smaller by for one ion species of charge . Neglecting it requires heavy ions at electron-wave frequencies; collisions, background magnetization and pressure dispersion are excluded. The transverse electromagnetic wave relation is .
Unsigned laboratory chapter; publication date unknown.
Laboratory chapter: physics.wm.edu/~evmik/classes/2019_fall_Experimental_Atomic_Physics_251/manual/faraday_rotation.pdf
Cited passages: pp. 1–7, Introduction, Experimental Setup, Experimental Procedure and Data Analysis.
A physical oceanographer studies the ocean's motion and physical state, including ocean currents, waves, temperature, salinity and mixing. Observations and mathematical models connect local measurements with transport over much larger distances.
For example, temperature and salinity influence mass density, which affects stratification and buoyancy-driven motion. Interpreting a current therefore requires both fluid dynamics and the physical properties of seawater.
X-ray photoelectron spectroscopy uses X-ray excitation to investigate electron removal energies, including those of core electrons. The common name electron spectroscopy for chemical analysis emphasizes its use in distinguishing chemical surroundings. The whole recorded spectrum can also contain electrons produced by processes other than direct photoionization; a peak assignment must identify the emission process as well as the chemical element.
In a modern implementation, a quartz crystal selects aluminum characteristic X-rays according to Bragg's law and focuses them onto the sample. Vacuum reduces gas collisions and contamination; a separately pumped entry chamber limits exposure to air. Lenses collect photoelectrons; an electrostatic electron energy analyzer transmits a narrow kinetic energy band. Stepping that band and counting detector pulses produces the spectrum. An electron flood source can compensate positive electric charge on insulating samples. Ion cleaning can alter vulnerable samples.[ref]
X-Ray Photoelectron Spectroscopy Instrumentation Features by Thermo Fisher Scientific. Sections Ultra-high vacuum system; XPS X-ray source; Electron analyzer; Ion sources; Charge neutralization
For a scan with count and dwell time at setting , compare rates , rather than raw counts when dwell times differ. Under an independent Poisson distribution model, the count standard deviation is approximately for a sufficiently populated bin. Longer acquisition reduces this relative counting measurement uncertainty; it does not automatically improve separation of overlapping peaks. Photoelectron peak overlap and resolution gives an example in which the same chemical separation produces either two maxima or one.
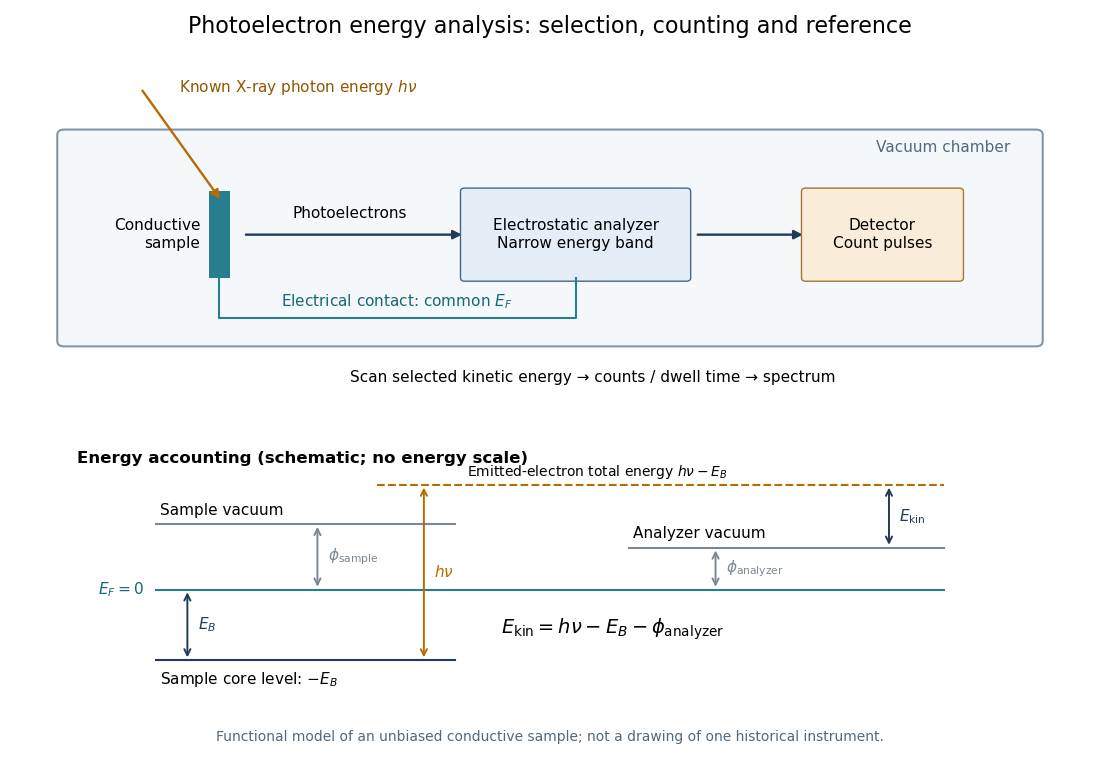

Angle-resolved photoemission spectroscopy measures the kinetic energy and emission angle of electrons removed from a solid by light. With photon energy , sample work function , and binding energy measured downwards from the Fermi level, . The measured parallel momentum is , modulo a surface reciprocal-lattice vector. Bright ridges reveal occupied electronic band structure; their slopes give the corresponding group velocity. Extracting a Fermi energy relative to a Dirac point requires a calibrated Fermi level, not merely an unlabelled image boundary.
The array factor describes the interference between the elements of a phased array, separately from the radiation pattern of each element. For identical equally spaced elements,At the limiting value has magnitude . The total intensity is proportional to times the single-element antenna beam pattern.
A grating lobe is an additional principal maximum caused by spatial sampling in a phased array. A regularly spaced linear array steered towards also has maxima wherever lies in . Taking excludes such maxima for all steering angles; is the usual limiting choice, with an endfire degeneracy at the extreme scan directions.
A phase factor is a unit-modulus complex number . Multiplying a complex amplitude by it changes its wave phase by while preserving its squared modulus. A common phase factor does not change light intensity, while different phase factors of contributions can change their interference.
A phase shift is a change in an oscillation's wave phase, specified modulo . It can arise from propagation, reflection or an imposed response. With the time convention , a delay multiplies the complex amplitude by . A sign reversal is a phase shift.
There are unlisted articles, also show them or only show them.