Topics (384k) Articles (398k) Users (410) Discussions (242) Comments (383) Files (13k) New article

A glycosyl group is a substituent obtained formally by removing the hydroxy group at the anomeric carbon of a cyclic monosaccharide. The resulting attachment site connects that sugar-derived unit to another part of a molecule. Removing the whole hydroxy group differs from removing only its hydrogen: the latter leaves an oxygen at the attachment site.[ref]
For an atom-count example, cyclic glucose has molecular formula . Subtracting an anomeric gives a glycosyl group fragment with composition . Attaching that fragment to gives . The oxygen joining the sugar-derived group to the methyl group belongs to the attached fragment in this bookkeeping. The formal subtraction describes connectivity, rather than prescribing a preparative reaction.
A name also needs the ring form and, when specified, the anomer configuration. Thus the glycosyl naming rules retain information about the cyclic sugar and its attachment; a molecular formula alone does not distinguish all such structures. Glycosyl groups occur in names of glycosides and oligosaccharides, connecting functional group nomenclature with glycosidic bonds.[ref]
A formyl group is the acyl group , attached to the remainder of a molecule through its carbonyl carbon. It contains one carbon, one oxygen and one hydrogen; the terminal dash denotes the attachment bond, not a negative charge. IUPAC retains formyl as a preferred prefix and lists methanoyl as another name for the same substituent.[ref]
Nomenclature of Organic Chemistry: IUPAC Recommendations and Preferred Names 2013 by IUPAC. P-65.1.7.2.1 and Appendix 2: HCO–, formyl/methanoyl. Primary locators iupac.qmul.ac.uk/BlueBook/P6.html and iupac.qmul.ac.uk/BlueBook/Papp2.html .
The attachment atom matters. In acetaldehyde, , the formyl group is attached to a carbon and gives an aldehyde. Attaching to a nitrogen instead gives an N-formyl derivative, with different chemical surroundings. Thus recognizing a formyl group does not make the entire compound an aldehyde. Nor is a bonded substituent automatically a free radical or an independently existing ion.
A useful molecular-formula calculation starts with methionine, . Formally replacing one hydrogen on its amino nitrogen by adds overall: one hydrogen leaves and the attached group supplies one. The neutral free acid consequently becomes , the formula recorded for formylmethionine.[ref]
N-formyl-L-methionine in ChEBI. CHEBI:16552, structure and neutral-acid formula.
This is atom bookkeeping, not a preparative reaction or the formula of a residue already bound to transfer RNA.The formyl group can be derived formally from formic acid, , by removing its hydroxyl group at the attachment site. This explains the nomenclature relationship while keeping the connectivity and the chemical species distinct.
An em is a nominal typographic length set by the current font size. At a font size of typographic points, one em is typographic points long.[ref] A scalable computer font describes its geometry relative to this scale. In OpenType,
unitsPerEm specifies how many font units make one em.[ref]Font Header Table by Microsoft. head table, unitsPerEm
Suppose one em contains 2048 font units. A design length of 1024 font units is half an em. At a font size of 12 typographic points, that length is 6 typographic points; at 18 typographic points, it is 9 typographic points. The stored coordinate has not changed; the scale has.
The word em does not require the glyph for “M” to be exactly one em wide. Nor is an em the measured ink height of every glyph: a shape can occupy only part of the nominal square or extend beyond it.[ref]
CSS Fonts Module Level 4 by W3C. Section2.5, note about arbitrary glyph ink bounds relative to the EM box
Glyph advances, left side bearings and right side bearings must consequently be read from the computer font's metrics rather than inferred from the em alone.The font size sets the nominal scale at which a font is used. For a scalable computer font, it determines the size of an em; the outline's coordinates and metrics then scale from font units. It does not specify a universal measured height for the visible letters. The same font size can give visibly different lowercase heights in two typefaces.[ref]
CSS Fonts Module Level 4 by W3C. Section2.5: definition of font-size and the note about EM boxes and apparent size
For a concrete geometric example, suppose two computer fonts have x-heights equal to 0.45 and 0.60 of an em. At a nominal 16 pixels per em, the ideal scaled heights are 7.2 and 9.6 pixels, respectively. Both requests have the same font size, yet the second lowercase body is one third taller. These are hypothetical metrics, before grid fitting.
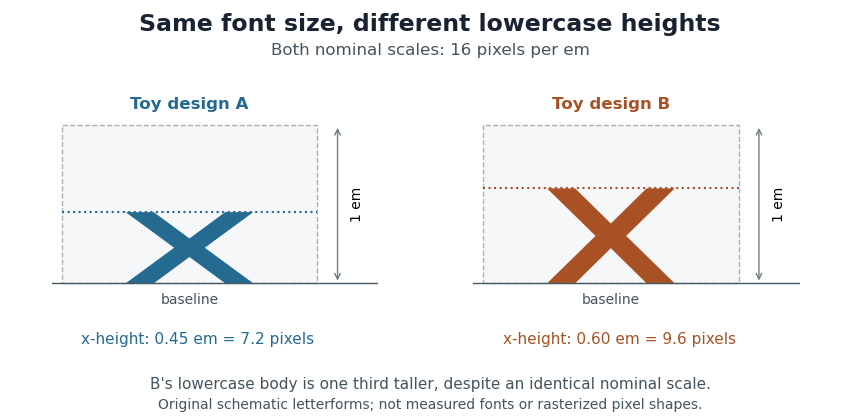
Equal font sizes can produce different x-heights
. Original toy letterforms with x-heights of 0.45 and 0.60 em at a nominal scale of 16 pixels per em. The ideal heights are 7.2 and 9.6 pixels; these are schematic shapes rather than measured computer fonts or a demonstration of rasterization. Details.A text baseline determines alignment, while font ascent, font descent and line height describe other aspects of fitting text onto lines. Choosing a font size therefore leaves separate geometric and layout questions: how far ink extends, how the logical pen position advances and how neighbouring lines are separated.
The font ascent is an upward metric measured from a text baseline and used when allocating vertical space for a font. It describes the font's layout metrics as a whole, rather than the visible ascender of one particular glyph. A short letter, a tall letter and an accented form can therefore share the same font ascent while having different ink bounding boxes.[ref]
Suppose a computer font has a chosen font ascent of 800 font units and 1000 font units per em. At 20 pixels per em, the scaled upward metric is 16 pixels. This calculation allocates a reference extent; it does not assert that the letters being drawn actually reach 16 pixels above the text baseline.
The field used must be stated. OpenType provides
ascender in hhea and sTypoAscender in OS/2, while some older layout paths use other metrics. The sTypoAscender, sTypoDescender and sTypoLineGap fields are intended to work together for typographic line spacing. Their ascent-minus-descent need not equal unitsPerEm.[ref]OS/2 and Windows Metrics Table by Microsoft. sTypoAscender: default line spacing, legacy differences and independence from unitsPerEm
Combining a font ascent with the corresponding font descent and font line gap gives a consistent basis for choosing line height. Mixing fields chosen under different conventions can instead change the spacing even when the nominal font size is unchanged.
The font descent supplies the below-text baseline part of a font's vertical layout metrics. It must be distinguished from the descender of an individual glyph. The coordinate convention also matters: a downward extent can be represented as a negative coordinate in a system whose vertical axis points upward, or as a positive distance in another API.[ref]
Glyph Metrics in the FreeType documentation. Section2: descent sign in FreeType and other font formats
For example, a signed descent font units represents a downward extent font units. With 1000 font units per em and 20 pixels per em, its magnitude scales to 4 pixels. Calling that a negative height would confuse the coordinate with the distance being allocated.
Using a signed descent, an ascent and a font line gap in the same font units givesEquivalently, if is the positive downward extent, the same line height is . This is the elementary typographic spacing model; the rendering system's choice of metrics must still be respected.[ref]
Glyph Metrics in the FreeType documentation. Section2: linespace = ascent - descent + linegap
A computer font can contain several descent-related fields. For example, OpenType's
hhea header stores a typographic descender; an application must not infer the sign and purpose of every other API field merely from the word descent.[ref]Horizontal Header Table by Microsoft. descender and lineGap fields; remarks on platform-specific interpretations
A flow cytometer is an instrument that measures optical signals as suspended particles pass through an illuminated observation region. Its fluidics positions the sample stream, its optical system excites and collects light, and its electronics converts detector pulses into recorded events. Flow cytometry is the measurement technique; a flow cytometer is the apparatus implementing it.
In a common design, hydrodynamic focusing narrows the sample stream within surrounding fluid so particles encounter a more reproducible region of a laser beam. Collected fluorescence and scattered light reach photodetectors through optical selection elements. A pulse can be summarized by its height, integrated area and width. The FACSCelesta manual distinguishes the maximum digitized intensity from the integral over the electronic acquisition window.[ref]
BD FACSCelesta Flow Cytometer User’s Guide by BD Biosciences. Chapter 7, Technical overview, printed p. 115
Signal area and peak height are different measurements even when both increase with the brightness of a selected particle population.For an original ideal pulse model,Two pulses with the same height but widths and have areas in ratio 1:2. Conversely, equal areas can arise from different heights and durations.
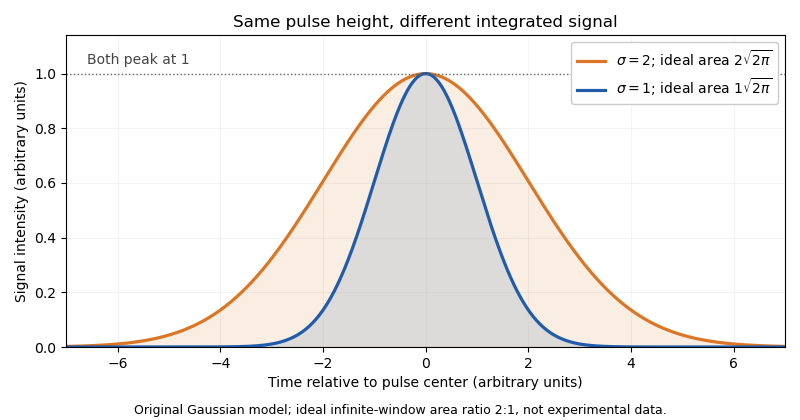
Real acquisition windows and thresholding modify the infinite-window model. Pulse-shape comparisons can help identify coincident particles, but no one pulse parameter guarantees a single intact biological cell.
A primary experimental example measured green fluorescent protein expression in a genetic toggle switch with a FACSCalibur instrument. It used 488 nm excitation, a 515–545 nm emission filter and separately acquired cultures; single-cell distributions distinguished alternative expression populations.[ref]
Construction of a genetic toggle switch in Escherichia coli by Timothy S. Gardner and others. p. 342, Methods, Assay of gene expression; Figure 5
That experiment illustrates the chain from biological reporter to photons, detector signal and population interpretation.A flow cytometric DNA-content assay similarly requires controlled staining, a suitable event-selection rule and detector operation within its quantitative range. Adjusting detector gain changes recorded signal without changing cellular DNA. Instrument response, sample preparation and biological interpretation therefore require distinct controls.
Correspondence of structures or other characters through shared evolutionary ancestry. Shared function alone does not establish it; comparative position, biological development and phylogenetics help distinguish it from convergent evolution.
Neutral evolution is change in inherited variants whose differences do not affect biological fitness in the population and environment being modeled. Their allele frequencies can change through genetic drift even without a selective advantage. Neutrality concerns effects on reproductive success, rather than requiring that the underlying DNA sequences are chemically identical.
An idealized diploid population with individuals makes a useful prediction. If the neutral mutation rate per copy per generation is , the expected value of the number of new copies is . Each has fixation probability , so the neutral substitution rate isThe cancellation explains why a molecular clock can reflect a mutation rate rather than population size under these assumptions. Motoo Kimura's molecular argument motivated a major role for neutral evolution; it does not assert that every mutation is neutral.[ref]
Evolutionary Rate at the Molecular Level by Motoo Kimura. Nature 217, pp. 624–626; neutral molecular substitutions and substitutional load
Molecular evolution is inherited change in molecules such as DNA and proteins across generations. Mutations introduce new variants; natural selection and genetic drift influence which variants persist. Comparing a nucleotide sequence or protein sequence between lineages therefore supplies evidence about their history as well as their present chemistry.
An important early example was the comparison of cytochrome c from different organisms. Emanuel Margoliash's 1963 report connected differences in protein primary structure to evolutionary relationships. The experimental input was the ordered amino acid residues of the proteins, rather than only their bulk composition or their shared function. Placing corresponding positions side by side made molecular differences countable.[ref]
Primary structure and evolution of cytochrome c by Emanuel Margoliash. pp.672–679, cytochrome-c primary structures and evolutionary comparison
For a deliberately simplified example, suppose two already aligned sequences have differing positions among compared positions. Their observed difference fraction is . That statistic is not itself a divergence time. If both lineages split time units ago and each accumulates substitutions at the same constant rate per position per unit time, their expected accumulated pairwise molecular divergence isThe factor two counts the two descendant branches. At low divergence, the observed difference fraction can approximate ; repeated changes at one position can conceal earlier changes, and unequal branch rates invalidate the equal-rate simplification. A molecular clock additionally needs a rate or time calibration to turn molecular differences into dates.
Sequence identity is a measured agreement between aligned positions. homology is a historical relationship of common descent; it is not a percentage. Orthology and paralogy further distinguish relationships associated with lineage splitting and gene duplication. These distinctions matter when a phylogenetic tree is inferred from a chosen gene rather than directly observed.
The neutral theory of molecular evolution provides a complementary population-level explanation: molecular change need not always be an adaptive improvement. Motoo Kimura's 1968 argument emphasized the potential importance of neutral changes and genetic drift, while leaving room for natural selection.[ref]
Evolutionary Rate at the Molecular Level by Motoo Kimura. pp.624–626, molecular substitution rates and neutrality argument
A methyltransferase is an enzyme transferring a methyl group from a donor to an acceptor. The acceptor can be a small molecule, DNA, RNA or a protein; the family name specifies a type of chemical transfer, not a universal biological function. Many methyltransferases use S-adenosylmethionine as donor. [ref]
Molecular Biology of the Cell, 4th edition by Bruce Alberts and others. Chapter 7, Control of Gene Expression: DNA methylation and chromatin modifications
For example, DNA methylation changes selected bases, while histone methylation modifies amino acid side chains in a different macromolecule. Different acceptor positions can have different consequences. A specific activity assay therefore needs a defined donor, acceptor and product measurement: disappearance of donor alone does not establish the intended site or exclude another methyl-transfer reaction.
Cyclooxygenase refers to the oxygenating activity of prostaglandin-endoperoxide synthases, commonly distinguished as COX-1 and COX-2. These enzymes convert arachidonic acid through prostaglandin intermediates toward products used in local signalling. Their cyclooxygenase and peroxidase reactions are successive catalytic activities, rather than the names of two unrelated complete pathways. [ref]
NCBI Gene by the National Library of Medicine. Human PTGS1, Gene ID 5742, Summary: prostaglandin biosynthesis, cyclooxygenase and peroxidase activities
Different tissues can process the common intermediate into different final signals, so inhibiting the upstream enzyme can affect several products at once. COX-1 and COX-2 also differ in their regulation and tissue distribution. A change in enzyme abundance, catalytic inhibition and a change in downstream product formation are related but experimentally distinct observations.
Squalene epoxidase is a flavin-dependent enzyme that converts squalene to 2,3-epoxysqualene during sterol synthesis. The reaction introduces an oxygen-containing epoxide group before later cyclization steps construct the sterol ring system. In the human enzyme, FAD supports oxidation using molecular oxygen and reducing equivalents supplied through a reductase. [ref]
This step illustrates that biosynthetic pathways control both carbon skeletons and oxidation state. Adding a double-bond oxygen functionality and subsequently forming rings are different chemical operations performed by different enzymes. An assay of pathway output cannot locate an inhibition point without measurements of intermediates or a direct enzyme assay.
Invertase is an enzyme that hydrolyses sucrose into glucose and fructose. Its name reflects the change in optical rotation of the sugar mixture during the reaction. Optical rotation therefore provides a measurable signal of chemical conversion, provided other contributions to that signal are controlled. [ref]
The Kinetics of Invertase Action by L. Michaelis and Maud L. Menten. 1913, translated pp. 1–3: substrate, acidity, temperature and optical-rotation measurements
The classic kinetic study measured initial reaction rates at different sucrose concentrations. At low substrate concentration the rate rises strongly as more substrate is supplied; at high concentration the finite amount of enzyme limits the rate. This supplies a concrete motivation for Michaelis-Menten kinetics. Product mutarotation complicates the optical readout, showing why a convenient physical signal is not automatically a direct count of reaction events.
Plasmin is a protease that cuts fibrin into soluble products, helping dismantle a blood clot. It is produced by proteolytic activation of plasminogen, an inactive precursor. Activation of an existing precursor can switch on an enzymatic process without waiting for new protein synthesis.[ref]
Plasmin EC 3.4.21.7 in IUBMB Enzyme Nomenclature. Reaction and Comments
This supplies a useful contrast within clot biology. Thrombin helps form the fibrin network; plasmin helps remove it. In a simplified experiment, a fibrin gel can therefore be formed first and its subsequent breakdown measured after adding active plasmin. The observable loss of the network is a consequence of peptide bond cleavage, linking a molecular reaction to a macroscopic change in material structure.
Acetylcholinesterase is an enzyme that hydrolyses the neurotransmitter acetylcholine to choline and acetate. Its activity helps terminate signalling at cholinergic synapses, including the neuromuscular junction. Chemically, it is a catalyst: the reaction consumes acetylcholine and water, while the enzyme can be reused.[ref]
Acetylcholinesterase EC 3.1.1.7 in IUBMB Enzyme Nomenclature. Accepted name and reaction
The distinction between removal of a messenger and inhibition of its receptor matters. Reducing acetylcholinesterase activity leaves more acetylcholine available to activate receptors; it does not directly substitute for the messenger or block every receptor. Thus the duration of a chemical signal depends both on its release and on its clearance. Measuring reaction-product accumulation in an enzyme assay tests the clearance machinery separately from a responding muscle or neuron.
Thrombin is a protease that converts soluble fibrinogen into fibrin, a principal structural component of a blood clot. It cleaves particular peptide bonds and releases short fibrinopeptides, enabling the remaining fibrin units to assemble. Thrombin is generated by activation of the precursor prothrombin.[ref]
Thrombin EC 3.4.21.5 in IUBMB Enzyme Nomenclature. Reaction and Comments
A simple clotting experiment makes the change visible: adding active thrombin to a suitable fibrinogen solution produces an assembling network. The resulting material is not a precipitate of the enzyme itself; a relatively small amount of catalyst can transform a much larger amount of its substrate. This separates the messenger-like activation step, the catalytic reaction and the mechanical structure of the final clot.
An enzyme assay measures the catalytic activity of an enzyme by following consumption of a substrate or appearance of a reaction product under specified conditions. The signal may be chemical concentration directly or a calibrated optical readout, such as absorbance or fluorescence.
For example, if product concentration increases from 0 to 6 micromolar in the first two minutes, a linear initial interval gives a rate of 3 micromolar per minute. A no-enzyme control tests whether the signal also changes without the catalyst. Comparing rates requires the same temperature, pH, substrate concentration and detection conditions; raw brightness alone is not an activity unit.
The initial interval matters because later measurements can be affected by substrate depletion, product accumulation or loss of enzyme activity. Assay-development guidance therefore recommends establishing the linear initial-rate region before comparing inhibitors or enzyme preparations.[ref]
Basics of Enzymatic Assays for HTS by Harold B. Brooks and others. Initial velocity, linear reaction range, substrates and controls
An inorganic pyrophosphatase is an enzyme that catalyses hydrolysis of free inorganic pyrophosphate into two orthophosphate units. One explicitly balanced choice of ionic forms isActual protonation and metal binding depend on pH and solution conditions. Hydrolysis removes pyrophosphate generated by other reactions, helping couple those reactions to product removal.
In 1952, M. Kunitz isolated crystalline inorganic pyrophosphatase from baker's yeast. The preparation hydrolysed free pyrophosphate, required activating metal ions such as magnesium, and did not interchangeably hydrolyse the tested organic diphosphate-containing compounds. Purifying a catalyst and comparing substrates connected the reaction to a specific protein activity.[ref]
Crystalline inorganic pyrophosphatase isolated from baker's yeast by M. Kunitz. Abstract: purification, specificity and metal-ion dependence
For a stoichiometric assay example, complete hydrolysis of pyrophosphate adds orthophosphate, provided no other reaction consumes or generates it. Pre-existing phosphate must be measured as background. Stoichiometry predicts product amount; enzyme kinetics, pH and metal availability determine the time required. The yeast preparation's preferred conditions should not be assigned to every inorganic pyrophosphatase.
A nitric oxide synthase is an enzyme that produces nitric oxide from arginine, with citrulline as the accompanying amino-acid product. The reaction couples oxidation chemistry to reducing equivalents supplied by NADPH. The resulting nitric oxide can act as a short-range biological signal, so controlling its synthesis is different from releasing a pre-existing stored transmitter.[ref]
Isolation of nitric oxide synthetase, a calmodulin-requiring enzyme by D. S. Bredt and S. H. Snyder. Abstract: enzymatic formation from arginine, citrulline production and NADPH requirement
The purification of a brain enzyme provided an important mechanistic experiment. In 1990, the authors enriched activity from rat cerebellum with an affinity column and showed that the purified activity required calmodulin under their calcium-dependent assay conditions. This connected a protein preparation with a regulated chemical conversion, rather than identifying the signal solely from a tissue's relaxation response.[ref]
Isolation of nitric oxide synthetase, a calmodulin-requiring enzyme by D. S. Bredt and S. H. Snyder. Abstract: affinity purification and requirement for calmodulin
An illuminating assay comparison holds enzyme amount fixed and changes a required reaction component. If adding calmodulin restores activity to a suitable preparation, a weak initial signal need not mean that the enzyme protein was absent. Protein abundance, catalytic competence and the availability of substrates or enzyme cofactors are separate quantities.
Different nitric-oxide-synthase forms and cellular contexts have different regulatory behavior. The calcium dependence established for the purified brain preparation should therefore not be turned into a claim that every nitric-oxide-synthase response in every tissue follows the same calcium-control rule.
Pinned article: Introduction to the OurBigBook Project
Welcome to the OurBigBook Project! Our goal is to create the perfect publishing platform for STEM subjects, and get university-level students to write the best free STEM tutorials ever.
Everyone is welcome to create an account and play with the site: ourbigbook.com/go/register. We belive that students themselves can write amazing tutorials, but teachers are welcome too. You can write about anything you want, it doesn't have to be STEM or even educational. Silly test content is very welcome and you won't be penalized in any way. Just keep it legal!
Intro to OurBigBook
. Source. We have two killer features:
- topics: topics group articles by different users with the same title, e.g. here is the topic for the "Fundamental Theorem of Calculus" ourbigbook.com/go/topic/fundamental-theorem-of-calculusArticles of different users are sorted by upvote within each article page. This feature is a bit like:
- a Wikipedia where each user can have their own version of each article
- a Q&A website like Stack Overflow, where multiple people can give their views on a given topic, and the best ones are sorted by upvote. Except you don't need to wait for someone to ask first, and any topic goes, no matter how narrow or broad
This feature makes it possible for readers to find better explanations of any topic created by other writers. And it allows writers to create an explanation in a place that readers might actually find it.
Figure 1. Screenshot of the "Derivative" topic page. View it live at: ourbigbook.com/go/topic/derivativeVideo 2. OurBigBook Web topics demo. Source. - local editing: you can store all your personal knowledge base content locally in a plaintext markup format that can be edited locally and published either:This way you can be sure that even if OurBigBook.com were to go down one day (which we have no plans to do as it is quite cheap to host!), your content will still be perfectly readable as a static site.
- to OurBigBook.com to get awesome multi-user features like topics and likes
- as HTML files to a static website, which you can host yourself for free on many external providers like GitHub Pages, and remain in full control

Figure 2. You can publish local OurBigBook lightweight markup files to either OurBigBook.com or as a static website.
Figure 3. Visual Studio Code extension installation.
Figure 5. . You can also edit articles on the Web editor without installing anything locally. Video 3. Edit locally and publish demo. Source. This shows editing OurBigBook Markup and publishing it using the Visual Studio Code extension. 
- Infinitely deep tables of contents:




All our software is open source and hosted at: github.com/ourbigbook/ourbigbook
Further documentation can be found at: docs.ourbigbook.com
Feel free to reach our to us for any help or suggestions: docs.ourbigbook.com/#contact