Topics (384k) Articles (398k) Users (410) Discussions (242) Comments (383) Files (13k) New article

A superscript is a component raised relative to a base expression, commonly also reduced in size. An exponent in is one use. The superscript in can instead denote a derivative when that convention has been specified. The typographic position supports several meanings.
In TeX,
x^2 supplies one token as the superscript and x^{n+1} groups a longer expression. In MathML, msup lays out the base and superscript separately, with vertical placement and gap constraints.[ref]MathML Core by World Wide Web Consortium. Subscripts and superscripts: msup layout
For example, the base and raised expression inhave different local baselines. A mathematical typesetting style determines how the raised expression is presented. When subscripts and superscripts are both attached, their mutual clearance also matters; independently moving each one without considering the other could cause a collision. An OpenType MATH table provides font-specific data used for these choices.
A subscript is a component placed below the usual baseline of a base expression, commonly at a smaller size. It can label a term of a sequence, as in , or identify a matrix entry, as in . Its position does not by itself determine the mathematical meaning of the label.
In TeX,
x_i attaches a single-token subscript, while x_{i+1} groups a compound subscript. In MathML, msub supplies a base and subscript as separate children. Their layout uses baseline shifts and clearances rather than putting both components on the ordinary text baseline.[ref]MathML Core by World Wide Web Consortium. Subscripts and superscripts: msub child layout and shift calculations
For example, keeps together as one attached component. A mathematical typesetting style controls the treatment of the smaller expression. An OpenType MATH table can supply the font-specific placement data. This is why adding an underscore as an ordinary printed glyph would not reproduce the layout.
A typeset fraction is a two-dimensional layout that places one expression above another, commonly with a horizontal rule between them. The components are laid out as typesetting boxes before they are assembled. In MathML, an
mfrac element supplies the two components; mathematical typesetting style affects their presentation.[ref]For example,has a superscript in its upper component and a square root in its lower component. Their dimensions influence the space above and below the fraction rule. The expression's algebraic meaning and its geometry are related but distinct: the layout can contain arbitrary expressions, including ones whose values are not rational numbers.
A simple own box model makes the horizontal placement explicit. Suppose the component widths are and , and the layout adds a chosen side allowance . If both components are centred in widththeir left offsets are and . This is an illustrative centring model; real layouts also use vertical clearances, rule thickness and font data from an OpenType MATH table.
A mathematical delimiter is a symbol used to enclose or separate parts of a mathematical expression, such as parentheses, brackets or vertical bars. Its visible size should suit the enclosed material. Mathematical typesetting can select a larger mathematical glyph variant or construct a mathematical glyph assembly when a default glyph is too small.[ref]
MATH - The Mathematical Typesetting Table by Microsoft. MathVariants and MathGlyphConstruction: ready-made variants and assemblies for growing shapes
For example, compare the grouping inThe parentheses enclose the complete typeset fraction, so its height and depth inform their layout. The superscript applies to the grouped expression. In TeX,
\left( and \right) request paired size-sensitive delimiters around the enclosed material. The stored parenthesis characters can therefore yield different glyphs in different formula contexts.A mathematical typesetting style selects layout conventions appropriate to a formula's context, including compact inline material and more spacious displayed material. In MathML,
math-style distinguishes normal and compact, while math-depth participates in nested size selection.[ref]Compare two presentations of the same expression:Both represent the same quotient, but reserve different vertical space. In TeX,
\displaystyle and \textstyle request these contexts. The choice matters when fitting a typeset fraction into a line without making neighbouring text baselines unnecessarily far apart.For a hypothetical computer font with first- and second-level script scales 80 and 60 percent, a base font size of 20 units gives script sizes 16 and 12. The second value is relative to the base, so it is not . Actual percentages come from the computer font's mathematical font constants.[ref]
MathML Core by World Wide Web Consortium. §4.5: ScriptPercentScaleDown and ScriptScriptPercentScaleDown
The mathematical typesetting axis, or Math axis, is a horizontal alignment reference for a formula. Its offset from the text baseline is a mathematical font constant, represented by
axisHeight in an OpenType MATH table.[ref]MATH - The Mathematical Typesetting Table by Microsoft. MathConstants: axisHeight and baseline offset
For an invented coordinate example, choose upward-positive coordinates, put the text baseline at , and set the axis offset to font units in a computer font with 1000 font units per em. At 20 pixels per em, the axis is pixels above that baseline. A symmetric enclosing shape spanning to has midpoint , so its centre lies on the axis.
The typeset fraction bar is another useful alignment cue. The reference fixes relative placement; translating the whole formula also translates its baseline and axis.
Fermat's principle characterizes a light ray between fixed endpoints by stationary travel time, or stationary optical path length in a stationary isotropic medium. With refractive index and path element , the travel time is , so an allowed ray has vanishing first variation of this integral. Stationary does not always mean the globally shortest time.
For a planar interface between two uniform media, vary the point at which a broken straight path crosses the interface. Setting the travel-time derivative to zero gives , Snell's law, with angles measured from the normal. This makes the link between a variational statement and an observable direction of refraction explicit. The geometrical optics description requires scales large enough compared with the wavelength; diffraction supplies effects that a single ray cannot describe.
Parameter estimation uses observations to infer the unknown parameters of a mathematical model. The result depends on both the observations and the model: one must specify which quantities are unknown, how observations relate to them, and how discrepancies are assessed. Least squares and maximum likelihood estimation provide two common criteria.[ref]
NIST and SEMATECH e-Handbook of Statistical Methods. §4.1.4.1, Linear Least Squares Regression, unknown parameters and squared deviations
For an explicit example, suppose , where the same unknown level applies to all observations. MinimizinggivesSince , this is the unique minimum for . Observations give the sample mean , with residuals . Independent normal distributions with a common variance also make this estimate the maximum likelihood estimation solution for the level.
An estimate is not the same as a known exact value. Under the independent equal-variance model, its standard error is estimated by , where is the sample variance. For the three illustrative observations, and the estimated standard error is . Correlated errors or a common measurement offset require different accounting; collecting more identically biased readings does not remove the offset.
Identifiability is a separate prerequisite. If a model depends only on , data of that form can estimate their sum but cannot uniquely separate from . Pairs and give the same sum. More repeated observations of that same relationship reduce uncertainty about the sum without identifying both parameters. State what the observations can determine before reporting numerical estimates.
Single-crystal plastic deformation is irreversible shape change of a single crystal, often through dislocation motion on particular slip systems. A slip system specifies a crystallographic plane and a direction within it. Applied loading resolves into a shear stress that drives slip, making the response depend on crystal orientation.[ref]
Under uniaxial stress , the resolved stress on a slip system is , where is the angle between the loading axis and plane normal and the angle to the slip direction. For compatible -degree angles, . Slip begins when the relevant resistance is reached; subsequent deformation can rotate the lattice and change which systems carry further strain.[ref]
Electron backscatter diffraction determines crystallographic information from electron diffraction patterns recorded in a scanning electron microscope. A scanned electron beam strikes a crystalline specimen, and the detector records backscattered-electron diffraction patterns. Their band geometry can be indexed against a crystal model to estimate local orientation and identify compatible phases.[ref]
What is Electron Backscatter Diffraction? by Oxford Instruments. Instrument developer’s EBSD principles and microstructure mapping
Repeating the measurement across a surface produces an orientation map that can reveal crystal grains, boundaries and changes associated with deformation or recrystallisation. Preparation and pattern quality matter: a map records successfully indexed information, so poor surface quality or an unsuitable structural model can create missing or misleading assignments. It complements chemical analysis rather than directly reporting elemental composition.
Mechanical strength describes the stress a material withstands before a specified limiting event, such as yielding or fracture. The event, loading mode and test conditions must be stated: tensile strength, compressive strength and yield strength measure different responses.
In a simple tension test, engineering stress is applied force divided by initial cross-sectional area, . A specimen carrying over experiences by that convention. Strength is distinct from Young's modulus, which relates tensile stress to elastic strain, and from fracture toughness, which concerns resistance to crack growth. Microstructure, defects, temperature and loading history can all influence the measured limit.
A critical mineral is a mineral commodity whose importance to specified uses combines with vulnerability in its supply. Criticality depends on the assessment's region, time and criteria. The United States Geological Survey explains it through essential functions and potential supply disruption, while noting that assessments change as technology and supply conditions change.[ref]
What is a critical mineral? by the United States Geological Survey. Definition and changing criticality; no current-list claim
From an engineering viewpoint, substitution requires more than matching one headline property. A replacement for a contact material must also meet requirements for electrical conductivity, corrosion, processing and service life. Recycling and alternative designs can alter demand, while concentrated production or processing can affect supply risk. Criticality consequently links material performance with the resilience of the system using it.
A secondary phase is a distinguishable material phase present alongside a principal matrix phase. It can differ in chemical composition, crystal structure or both. Particles of a secondary phase within an alloy are therefore different from atoms simply dissolved in a solid solution.
Their effects depend on size, distribution and interface properties. Fine particles can obstruct dislocation motion and increase mechanical strength, while coarse or brittle regions can assist crack initiation. Heat treatment can change a secondary phase's amount and morphology, explaining why overall composition alone does not determine an alloy's behaviour.
A material fibre is a long, slender physical strand: its length is large compared with its transverse dimensions. The geometry is shared by materials with different roles. Carbon fibres and glass fibres can reinforce a composite material, while an optical fibre guides light. The material's properties, the strand dimensions and the way strands are assembled all affect its response.
A single-fibre tensile test grips one strand, measures its axial force and extension over a specified gauge length, and uses its cross-sectional area to obtain stress and strain. A 2020 study used a semi-automated instrument to characterize glass fibres and carbon fibres through their stress-strain curves and inferred moduli.[ref]
Understanding the mechanical response of glass and carbon fibres: stress-strain analysis and modulus determination by Rajnish Kumar and others. Public primary abstract: single-fibre apparatus and modulus analysis
Its public dataset supplies individual tensile curves at several gauge lengths, summary sheets and calculations of test-setup machine compliance.[ref]Single fiber tensile test - Glass and Carbon fibers by Rajnish Kumar and others. Dataset description, gauge-length groups and compliance files
This matters because crosshead displacement can include deformation of the apparatus as well as extension of the material fibre; its slope alone need not give the specimen's Young's modulus.An original ideal model shows why making thinner strands changes some responses more strongly than others. Keep total material cross-sectional area , length and Young's modulus fixed. Compare one solid circular rod with identical circular fibres, each of radiusFor axial loading, grip every strand so that all undergo the same extension . Each supplies force , and adding the forces gives the axial stiffnessindependent of under these assumptions. This is the uniform-bar linear elasticity relation applied to parallel strands.
Now make a separate pure-bending comparison of an unbonded material-fibre bundle. Allow longitudinal sliding, neglect friction, and let each strand bend about its own neutral axis with the same curvature . A circular strand has second moment of area and filament bending modulus . Its bending moment is in the small-deformation model.[ref]
Stresses in Beams by David Roylance. Normal Stresses, equations3–6, pp.2–4: linear-elastic moment-curvature relation
Adding those moments gives the bending rigidity of an unbonded fibre bundle:Each material fibre has its own neutral axis, which is crucial to this calculation. Bonding strands together transfers shear stress and couples their axial deformation; the independent-strand sum then ceases to describe the assembly. In a reinforced composite material, that coupling is part of fibre-matrix load transfer.For chosen , and , both axial specimens have . At , each radius is approximately , and the independent-bending value is compared with for the solid rod. The parameters are stipulated for this model; counts material and excludes spaces between strands.
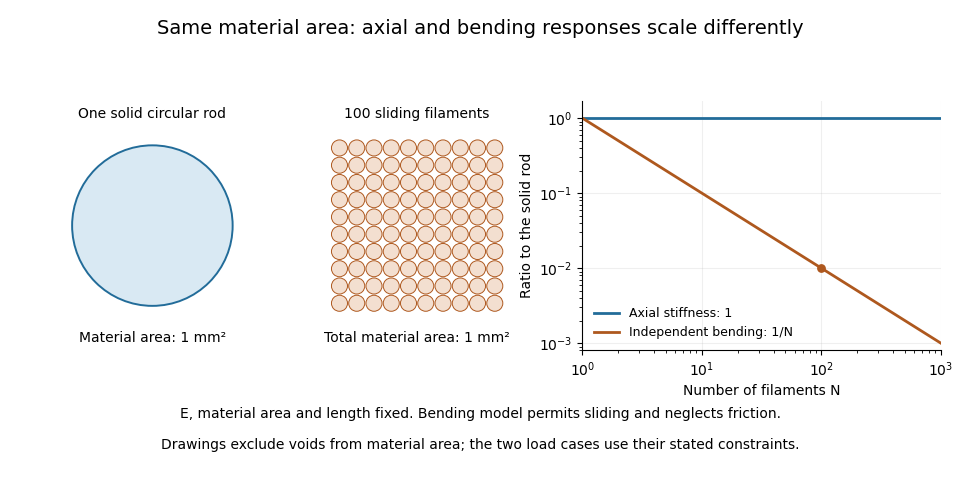
A useful mechanical comparison therefore records which material fibres are gripped, whether they can slide, their arrangement and the loading direction. Equal material quantity alone does not determine an assembly's stiffness, and small filament bending modulus does not imply small axial Young's modulus.
In biomedical engineering, a biomaterial is a material selected or designed to interact with a biological system for a medical purpose. Its defining feature is this intended interaction, rather than whether it originated in an organism. A synthetic polymer, a metal or a ceramic can therefore be a biomaterial; natural collagen can also be processed for such a use. The biomedical meaning should be distinguished from the broader use of “bio” to mean material obtained from biomass.[ref]
Terminology for biorelated polymers and applications (IUPAC Recommendations 2012) by Michel Vert and others. Entry 30 and its notes; the biomaterial entry is also reproduced in the IUPAC Gold Book
A biomaterial has both a material function and a biological environment. A load-bearing component must transmit forces without unacceptable deformation, but its surface also contacts fluid, proteins and biological cells. Biocompatibility consequently concerns an appropriate host response for a particular application; it is not a universal label that guarantees identical behavior at every site or for every exposure duration.[ref]
Terminology for biorelated polymers and applications (IUPAC Recommendations 2012) by Michel Vert and others. Entry 106, biocompatibility in biomedical therapy
An illuminating historical example is the 1971 work of L. L. Hench and colleagues on a bone-bonding glass-ceramic. They compared laboratory measurements of glass-ceramic solubility and interfacial hydroxyapatite crystallization with histology and ultrastructure observations around implants in rat femurs. The important question was how the material–bone interface developed, rather than merely whether the bulk ceramic was strong.[ref]
Bonding mechanisms at the interface of ceramic prosthetic materials by L. L. Hench and others. Primary abstract: comparison of in-vitro interfacial studies and in-vivo implant observations
To separate bulk behavior from an interface effect in a model experiment, one could compare specimens with identical dimensions and bulk Young's modulus but different surface treatments, while holding the cell culture conditions fixed. Measure both the mechanical response and cell adhesion, instead of substituting one for the other. Conversely, changing specimen thickness while retaining the same surface can change bending resistance without changing the nominal surface chemistry. These controlled comparisons show why evaluating a biomaterial requires specifying the material, its geometry, its interface and the biological setting together.
Time-of-flight mass spectrometry separates ions by measuring how long they take to reach a detector after a timed acceleration pulse. The simplest instrument has an ion source, an accelerating electric field, and a drift tube kept under vacuum. For ions of equal positive electric charge accelerated through the same electric potential difference, smaller mass gives greater speed and earlier arrival.[ref]
Time-of-Flight Mass Spectrometer with Improved Resolution by W. C. Wiley and I. H. McLaren. Review of Scientific Instruments 26, p. 1150, General Description
Let be the accelerating electric potential difference, the positive electric charge, the mass, and the field-free drift length. Neglecting initial speed and the time spent accelerating, conservation of energy givesFor an ideal drift at , a singly charged ion of mass arrives after approximately ; takes . Here is the unified atomic mass unit. Quadrupling mass doubles the ideal flight time. A doubly charged ion has the same mass-to-charge ratio as the singly charged ion and therefore the same ideal arrival time.
Real peaks broaden because ions begin at different positions and with different kinetic energies. In 1955, W. C. Wiley and I. H. McLaren analysed these effects and demonstrated an ion gun with two accelerating regions that reduced timing differences caused by initial position. Comparing calculated focusing conditions with measured spectra turned a timing idea into a practical improvement in mass spectrometry.[ref]
Time-of-Flight Mass Spectrometer with Improved Resolution by W. C. Wiley and I. H. McLaren. pp. 1150–1157; resolution analysis, two-field ion gun and experimental spectra
A mass spectrometer is an instrument that produces or receives ions, separates them according to mass-to-charge ratio, and records their signals. Its major functions are supplied by an ion source, a mass analyzer and a mass spectrometer detector. The result is a mass spectrum; interpreting a peak also requires knowing which ionic chemical species produced it.
The 1955 instrument described by W. C. Wiley and I. H. McLaren provides a concrete apparatus example. An ion source and accelerating fields launch ions into an evacuated drift region toward a collector. Arrival times separate mass-to-charge ratios; the paper analyses how initial positions and velocities broaden the recorded peaks, and uses a two-field ion-gun geometry to improve focusing.[ref]
Time-of-Flight Mass Spectrometer with Improved Resolution by W. C. Wiley and I. H. McLaren. Page 1150, general description; subsequent resolution analysis and two-field ion gun
This is one analyzer design, not a definition requiring every mass spectrometer to measure flight time.For an ideal time-of-flight mass spectrometer, neglect initial speed and acceleration duration. Across an electric potential difference , an ion of positive electric charge gains . A field-free drift of length then givesIf one peak arrives at and another at , identical acceleration and drift conditions imply a mass-to-charge ratio ratio . It is a mass ratio only if the charge states are also equal. Peak position, width and intensity answer different questions: ionic identity, resolving ability and response-weighted abundance.
Mass spectrometry imaging associates mass spectra with positions in a specimen, allowing an image to be formed for a chosen mass-to-charge ratio or spectral feature. Instead of reducing the whole specimen to one spectrum, it retains a link between molecular signal and location.
A 1997 experiment used matrix-assisted laser desorption/ionization, MALDI, to collect an ordered array of spectra from coated tissue sections or tissue imprints. Selected-ion images mapped peptides and proteins; one demonstration localized insulin in rat pancreatic tissue.[ref]
Molecular imaging of biological samples: localization of peptides and proteins using MALDI-TOF MS by R. M. Caprioli and others. Abstract, sample coating, ordered spectra and tissue demonstrations
The apparatus couples controlled sampling positions with a mass spectrometer; an image pixel records a spectral measurement, not a conventional colour photograph.An original two-position example shows why interpretation depends on scaling. A selected feature gives raw signals 10 and 20, while the respective summed spectral signals are 100 and 400. The second position is twice as bright in the raw feature image. Dividing each feature by its local total gives and , reversing which position has the larger fraction. Mass spectrometry image normalization changes the question being displayed; neither version alone is a universal concentration map.
Spatial sampling, material redistribution during preparation, ion production and detector response can all affect the result. A common peak coordinate does not by itself resolve every molecule with the same nominal mass or establish biological function. Retaining spectra, coordinates and processing choices makes the image scientifically interpretable.
MALDI, short for matrix-assisted laser desorption/ionization, is an ionization method for mass spectrometry. The sample is prepared with a MALDI matrix that absorbs the incident laser light and helps release sample molecules into the gas phase as ions. The MALDI matrix is a chemical preparation component; it is distinct from the mass analyzer that subsequently separates the ions. Combining MALDI with time-of-flight mass spectrometry gives MALDI-TOF. The measured mass-to-charge ratio characterizes the resulting ion, rather than directly reporting the mass of an uncharged molecule.
For an illustrative molecule of nominal mass atomic mass units, adding one proton gives a singly charged ion with nominal mass-to-charge ratio , whereas adding two protons gives approximately . These are simplified assignments that neglect exact mass defects. A second peak therefore need not mean a second molecular species: charge states, isotopes and attached ions also affect a mass spectrum.
In the 1997 tissue-imaging experiment, a MALDI matrix coated a tissue section or its blotted imprint, and an ordered array of mass spectra supplied a spatial map for a selected mass-to-charge ratio. The investigators mapped insulin in rat pancreas and peptides in rat pituitary. This connects the ion source to mass spectrometry imaging: sample position supplies the image coordinates, while the mass spectrum supplies chemical discrimination. A bright pixel alone does not establish an absolute molecular concentration.[ref]
Molecular imaging of biological samples: localization of peptides and proteins using MALDI-TOF MS by R. M. Caprioli and others. Abstract and pp. 4751–4760: matrix-coated sections, ordered spectral arrays and the pancreas/pituitary demonstrations.
Ion suppression is a reduction in the mass spectrometry response of an analyte caused by other sample constituents affecting ion production or the ion source response. The same amount of analyte can consequently yield a smaller signal in a complex sample than in a reference solution. It is one direction of a mass spectrometry matrix effect; enhanced response is also possible. A weak peak therefore need not mean that less analyte was originally present.
A 2003 experimental study separated matrix-response effects from analyte recovery in quantitative liquid chromatography–mass spectrometry. For its investigated compound, changing from ion spray to a heated-nebulizer interface removed a matrix effect under otherwise matched sample preparation and chromatographic conditions. This is evidence that the source interface matters, rather than a guarantee that one interface avoids suppression for every compound.[ref]
Strategies for the assessment of matrix effect in quantitative bioanalytical methods based on HPLC-MS/MS by B. K. Matuszewski and others. Abstract: recovery/matrix distinction and matched interface comparison.
An original matched-spike example distinguishes two losses. Give equal final analyte amounts to a neat reference and to an extracted blank sample after preparation. Suppose their peak areas are and : the relative matrix response is , corresponding to suppression relative to the reference. Now spike the same nominal amount before preparation; an area of gives an estimated recovery of and overall process response . This interpretation assumes matched final volumes, injections and response conditions. It separates material lost during preparation from reduced response of material that remains.
Detector signal clipping is a different mechanism: a recording ceiling can lose intensity after ions have been produced. Neither that loss nor analyte-specific ion suppression is generally repaired by total ion current normalization. Distinguishing the mechanisms requires controls at the stages where the signal can change.
Pinned article: Introduction to the OurBigBook Project
Welcome to the OurBigBook Project! Our goal is to create the perfect publishing platform for STEM subjects, and get university-level students to write the best free STEM tutorials ever.
Everyone is welcome to create an account and play with the site: ourbigbook.com/go/register. We belive that students themselves can write amazing tutorials, but teachers are welcome too. You can write about anything you want, it doesn't have to be STEM or even educational. Silly test content is very welcome and you won't be penalized in any way. Just keep it legal!
Intro to OurBigBook
. Source. We have two killer features:
- topics: topics group articles by different users with the same title, e.g. here is the topic for the "Fundamental Theorem of Calculus" ourbigbook.com/go/topic/fundamental-theorem-of-calculusArticles of different users are sorted by upvote within each article page. This feature is a bit like:
- a Wikipedia where each user can have their own version of each article
- a Q&A website like Stack Overflow, where multiple people can give their views on a given topic, and the best ones are sorted by upvote. Except you don't need to wait for someone to ask first, and any topic goes, no matter how narrow or broad
This feature makes it possible for readers to find better explanations of any topic created by other writers. And it allows writers to create an explanation in a place that readers might actually find it.
Figure 1. Screenshot of the "Derivative" topic page. View it live at: ourbigbook.com/go/topic/derivativeVideo 2. OurBigBook Web topics demo. Source. - local editing: you can store all your personal knowledge base content locally in a plaintext markup format that can be edited locally and published either:This way you can be sure that even if OurBigBook.com were to go down one day (which we have no plans to do as it is quite cheap to host!), your content will still be perfectly readable as a static site.
- to OurBigBook.com to get awesome multi-user features like topics and likes
- as HTML files to a static website, which you can host yourself for free on many external providers like GitHub Pages, and remain in full control

Figure 2. You can publish local OurBigBook lightweight markup files to either OurBigBook.com or as a static website.
Figure 3. Visual Studio Code extension installation.
Figure 5. . You can also edit articles on the Web editor without installing anything locally. Video 3. Edit locally and publish demo. Source. This shows editing OurBigBook Markup and publishing it using the Visual Studio Code extension. 
- Infinitely deep tables of contents:



All our software is open source and hosted at: github.com/ourbigbook/ourbigbook
Further documentation can be found at: docs.ourbigbook.com
Feel free to reach our to us for any help or suggestions: docs.ourbigbook.com/#contact