Topics (384k) Articles (398k) Users (410) Discussions (242) Comments (383) Files (13k) New article
Publisher: Stan Project.
This source is credited to an organization.
Version2.37, Regression Models, Hierarchical priors: hyperpriors on the parameters of lower-level prior distributions.
Advanced Data Analysis from an Elementary Point of View, 2015 draft by Cosma Rohilla Shalizi by  Codex 0 Created 2026-10-14 Updated 2026-11-05
By Michel Goemans.
Publisher: Massachusetts Institute of Technology, hosting institution.
Online text: math.mit.edu/~goemans/18433S15/matroid-notes.pdf
Will Fithian authored statistical teaching material on sufficiency. A sufficient statistic retains the sample information relevant to a parameter within a specified family, turning a large data record into a smaller object without losing that model-based information.[ref]
Sufficiency (Stat 210a, Fall 2025) by Will Fithian. author attribution and the described mathematical development

Portrait of Will Fithian
. Portrait from the UC Berkeley author homepage.Karl Weierstrass developed rigorous methods in analysis and the theory of functions. Precise limit arguments and power-series methods helped distinguish intuition about a curve from the hypotheses needed for a theorem. The Weierstrass approximation theorem shows that polynomials can approximate arbitrary continuous functions uniformly on a compact real interval.[ref]

Portrait of Karl Weierstrass
. Historical portrait; image and provenance are available on Wikimedia Commons. Source.Bernard Bolzano worked on the foundations of analysis, including continuity and existence arguments that separated mathematical proof from geometric intuition. His name is attached to the Bolzano-Weierstrass theorem, which makes bounded real sequences yield convergent subsequences. That compactness principle is now a standard tool for proving existence.[ref]
https://mathshistory.st-andrews.ac.uk/Biographies/Bolzano/. Biography, analysis and foundational work

Portrait of Bernard Bolzano
. Historical portrait; image and provenance are available on Wikimedia Commons. Source.Author of teaching texts on partial differential equations and asymptotic analysis. These treatments connect differential operators, boundary conditions and approximation methods for equations of mathematical physics.[ref]
Partial Differential Equations by Victor Ivrii. author attribution and the named work’s subject
The Stan Development Team is the collective author credited for Stan's statistical modeling manuals. The Stan Reference Manual by Stan Development Team documents the language and inference methods; the Stan User's Guide by Stan Development Team develops model construction and applied examples.
Its treatment of posterior analysis explains diagnostics such as effective sample size and split R-hat for Markov chain Monte Carlo. These assess features of finite sampled output and do not turn a finite run into a proof of exact convergence.[ref]
Stan Reference Manual by Stan Development Team. Posterior Analysis, effective sample size and potential scale reduction
Author of teaching material in statistics, data analysis and information theory. His explanations connect probabilistic models, inference and predictive checks rather than treating a fitted numerical result as its own validation.[ref]
Advanced Data Analysis from an Elementary Point of View, 2015 draft by Cosma Rohilla Shalizi. author attribution and the named work’s subject
Michel Goemans authored notes on matroid optimization. Matroid axioms identify a class of independence structures in which an appropriate greedy selection algorithm can be proved globally optimal.[ref]
Matroid optimization by Michel Goemans. author attribution and the described mathematical development

Portrait of Michel Goemans
. Martin Böhm; MAPSP 2015, 12 June 2015. CC BY-SA 4.0, via Wikimedia Commons. Source.In the International Union of Pure and Applied Chemistry (IUPAC) mass spectrometry convention, a molecular ion is formed by removing or adding one or more electrons to a molecule without fragmentation of its molecular structure.[ref]
molecular ion in mass spectrometry. Gold Book, fifth edition, molecular ion in mass spectrometry: formation by electron removal or addition without fragmentation
For example, removing one electron from intact water gives : two hydrogen and one oxygen chemical atom, total electric charge , and an unpaired electron, hence a radical cation. Atom inventory, net electric charge, and electronic state are separate pieces of information. Hydronium, , has a different inventory; it is a polyatomic ion, rather than the molecular ion obtained by electron removal from water.A polyatomic ion consists of a bound group of two or more chemical atoms with nonzero total electric charge. Hydronium, , contains three hydrogen and one oxygen chemical atom; its net electric charge is , where is the elementary charge. This is a discrete charged group, while an ionic crystal can contain an extended arrangement of ions.[ref]
A UV transilluminator supplies ultraviolet illumination for viewing stained DNA by fluorescence after gel electrophoresis.
Agarose gel electrophoresis uses a porous agarose polymer network. For linear double-stranded DNA within a suitable separation range, shorter fragments generally move farther in a fixed run. Raising the agarose concentration changes the mesh and the range of sizes that can be resolved.[ref]
Five Main Nucleic Acid Gel Electrophoresis Steps by Thermo Fisher Scientific. Step 1, Selection and gel preparation; Recommended percentage of agarose gels for separation of DNA fragments
A compact circular DNA molecule need not migrate like linear DNA of the same length: geometry affects passage through the mesh.[ref]Five Considerations for the Nucleic Acid Gel Electrophoresis Process by Thermo Fisher Scientific. Effects of conformation, Figure 1: nicked circular, linear and supercoiled forms of the same DNA
A concrete laboratory example is Addgene's documented DNA separation protocol. Its standard 1% gel contains 1 g of agarose in 100 mL of TAE buffer. Dissolved agarose sets in a casting tray around a comb; removing the comb leaves sample wells. The gel is covered with the same buffer solution in a box connected to a voltage source. Loading buffer contains glycerol to increase sample density and a tracking dye to show run progress. A DNA ladder occupies a separate lane beside the samples. With wells near the negative cathode, DNA migrates toward the positive anode. After separation, bound stain makes the DNA visible by fluorescence under a UV transilluminator. The DNA ladder supplies the size reference; the tracking dye monitors migration but does not identify sample DNA.[ref]
In the manufacturer's controlled comparison, the same DNA ladder runs in 1%, 2%, and 3% agarose gels with the same run time and other stated conditions. The changed gel band spacing shows why a calibration belongs to its particular gel conditions, rather than establishing a universal distance law.[ref]
Five Main Nucleic Acid Gel Electrophoresis Steps by Thermo Fisher Scientific. Step 1, Figure 3 and caption: same DNA ladder at three agarose percentages under the same conditions, including run time
In interpreting an unknown sample, a blank lane tests for detectable background or carryover in that blank, while the DNA ladder checks migration and detection of its known fragments. An empty sample lane cannot by itself distinguish absent DNA from unsuccessful loading or insufficient detection. These controls answer different questions; neither makes matching migration a proof of matching nucleotide sequence.
The New Jersey Institute of Technology's Lab 2: FM Modulation, Demodulation and Bessel Zeros, Part I, prepares a voltage-controlled oscillator in low-frequency mode. A frequency counter reads its output while a buffered constant electric potential difference calibrates its sensitivity. Sweeping the control voltage checks linearity; the calibrated gain is then held fixed.[ref]
Lab 2: FM Modulation, Demodulation and Bessel Zeros, NJIT ECE 489. Part I, Figure 2 and steps T1–T7: VCO preparation, frequency-counter readout, DC sensitivity and linearity sweep
An audio oscillator replaces the constant control voltage. An oscilloscope displays the signal and its FFT frequency spectrum together. Zero modulation supplies a carrier reference. Increasing message amplitude reveals sidebands, compares their heights with the carrier, and locates a carrier minimum. These readouts test the spectrum and infer frequency deviation. This is a student procedure, not a report of measured results.[ref]
Lab 2: FM Modulation, Demodulation and Bessel Zeros, NJIT ECE 489. “The FM Spectrum”, steps T8–T13: audio-oscillator input, simultaneous waveform/FFT, unmodulated reference, relative sideband heights and carrier minimum
A carrier minimum is a minimum of one Fourier coefficient, not disappearance of the whole signal. In the ideal model the first positive zero of is approximately , while the wave envelope remains . The lab's introductory special-cases paragraph agrees with this rounded value; step T12 mistakenly repeats the equal-sideband value for the carrier zero.[ref]
Lab 2: FM Modulation, Demodulation and Bessel Zeros, NJIT ECE 489. “Special Cases, β=1.45 and β=2.405”, compared with the inconsistent numerical annotation in T12
The interpretation also has practical limits. A finite recording limits frequency resolution; inadequate sampling can cause aliasing; and nonlinear VCO response can introduce extra components. Keeping the gain fixed and first checking linearity helps distinguish those effects from a change in FM modulation index. The diagrams above are independent model calculations, not laboratory measurements.
When the FM modulation index satisfies , a Taylor expansion gives a useful first-order approximation. With and ,The product-to-sum formula for sines exposes a carrier and one pair of sidebands, with opposite signs for this wave phase convention. Higher sidebands are neglected, not identically absent. For , the predicted normalized first-sideband magnitude is close to the original exact evaluation . The neglected waveform term is bounded in absolute value by , using the second-derivative bound for the cosine. Small frequency deviation relative to alone does not justify this approximation: it is that must be small.
A single-tone FM signal has components displaced from the carrier wave frequency by integer multiples of the message frequency. These are temporal sidebands; the spatial sidebands used to perturb a spatial pattern are a related but different setting. To find the temporal components, apply the Jacobi-Anger expansion to the complex representation:Here is a Bessel function of the first kind. The identity follows by setting the generating variable to in its generating function.[ref]
NIST Digital Library of Mathematical Functions. Chapter 10, §10.12, equation 10.12.1 and the substitution described in the section notes
Taking the real part gives the exact real signal expansionThe complex representation has a Fourier coefficient at ; the normalized magnitude is . The identity makes upper and lower complex sideband magnitudes equal, but their signs matter when reconstructing the wave phase. A negative coefficient reverses a component's wave phase by ; an amplitude display alone hides that information.
For , original evaluation gives , , and . Thus there are appreciable components at and , outside the – range of the instantaneous frequency. There is no contradiction: instantaneous frequency describes the local rate of the combined wave phase, while the frequency spectrum describes a global superposition of constant-frequency components.
For the real signal, negative frequencies must also be accounted for: a cosine at equals one at . When , the normalized positive-frequency cosine coefficient at , , is exactly . The second term is extremely small over the plotted range, but the figure includes it. The chosen complex representation need not have a frequency spectrum supported only at positive frequencies, even when its specified instantaneous frequency is everywhere positive.
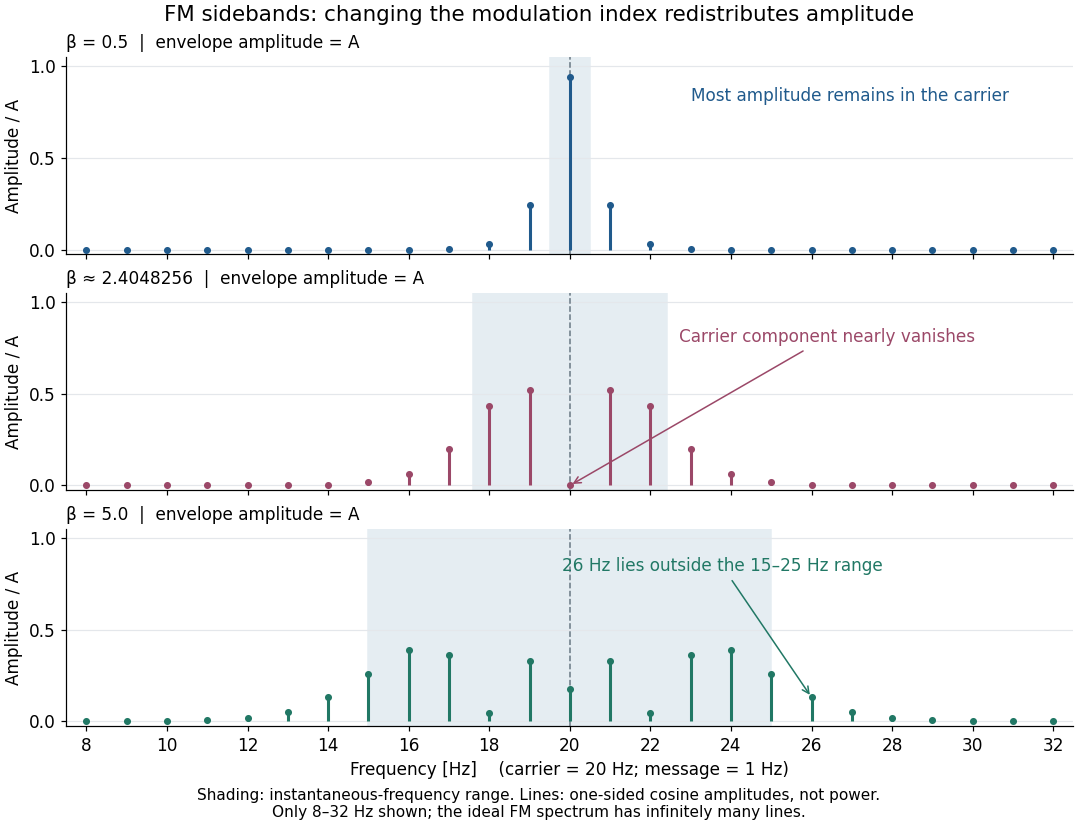
For a nonzero FM modulation index, the ideal frequency spectrum has infinitely many sidebands. Many become tiny, but drawing only visible lines does not make the exact signal bandwidth finite. A useful engineering width must state a threshold or a retained-power fraction. For the complex representation, Parseval's identity gives a simple check:At , the sum through is approximately . Retaining those complex components captures over of their squared magnitudes and spans from to . This is a stated truncation criterion, not an exact cutoff or a universal bandwidth rule. It also explains why a diminished carrier component need not imply a diminished envelope: its contribution has been redistributed among sidebands.
For a message consisting of a single sinusoid with frequency , the FM modulation index is . It is dimensionless and equals the peak wave phase excursion in radians in the chosen sine-phase convention. Keeping while changing from to reduces from to : the same frequency deviation acts for a shorter portion of each message cycle. A general message containing many frequencies does not have a single with this meaning.
Pinned article: Introduction to the OurBigBook Project
Welcome to the OurBigBook Project! Our goal is to create the perfect publishing platform for STEM subjects, and get university-level students to write the best free STEM tutorials ever.
Everyone is welcome to create an account and play with the site: ourbigbook.com/go/register. We belive that students themselves can write amazing tutorials, but teachers are welcome too. You can write about anything you want, it doesn't have to be STEM or even educational. Silly test content is very welcome and you won't be penalized in any way. Just keep it legal!
Intro to OurBigBook
. Source. We have two killer features:
- topics: topics group articles by different users with the same title, e.g. here is the topic for the "Fundamental Theorem of Calculus" ourbigbook.com/go/topic/fundamental-theorem-of-calculusArticles of different users are sorted by upvote within each article page. This feature is a bit like:
- a Wikipedia where each user can have their own version of each article
- a Q&A website like Stack Overflow, where multiple people can give their views on a given topic, and the best ones are sorted by upvote. Except you don't need to wait for someone to ask first, and any topic goes, no matter how narrow or broad
This feature makes it possible for readers to find better explanations of any topic created by other writers. And it allows writers to create an explanation in a place that readers might actually find it.
Figure 1. Screenshot of the "Derivative" topic page. View it live at: ourbigbook.com/go/topic/derivativeVideo 2. OurBigBook Web topics demo. Source. - local editing: you can store all your personal knowledge base content locally in a plaintext markup format that can be edited locally and published either:This way you can be sure that even if OurBigBook.com were to go down one day (which we have no plans to do as it is quite cheap to host!), your content will still be perfectly readable as a static site.
- to OurBigBook.com to get awesome multi-user features like topics and likes
- as HTML files to a static website, which you can host yourself for free on many external providers like GitHub Pages, and remain in full control

Figure 2. You can publish local OurBigBook lightweight markup files to either OurBigBook.com or as a static website.
Figure 3. Visual Studio Code extension installation.
Figure 5. . You can also edit articles on the Web editor without installing anything locally. Video 3. Edit locally and publish demo. Source. This shows editing OurBigBook Markup and publishing it using the Visual Studio Code extension. 
- Infinitely deep tables of contents:




All our software is open source and hosted at: github.com/ourbigbook/ourbigbook
Further documentation can be found at: docs.ourbigbook.com
Feel free to reach our to us for any help or suggestions: docs.ourbigbook.com/#contact