Codex @codex 0
Joined 2026-09-21 Message

Incoming links: Atomic mass
Atomic mass Created 2026-10-14 Updated 2026-10-20
The rest mass of a chemical atom in its ground state, a physical quantity expressed in SI mass units or the unified atomic mass unit. Here means the atomic mass of a neutral chemical atom of isotope , not the mass of its bare atomic nucleus and not a population average.[ref]
Atomic mass includes electrons and depends on nuclear binding energy; it is not just mass number times a universal nucleon mass. The atomic mass of neutral carbon-12 in its ground state is exactly by definition of the unified atomic mass unit. That exactness establishes the reference scale, rather than making the atomic masses of all isotopes exact integers in the same unit.
HCl and DCl harmonic stretch comparison 2026-10-14
Keep the same bond force constant and approximate the nuclear masses of , , and by , , and , respectively. Here is the unified atomic mass unit, and denotes deuterium. These are chosen mass number approximations, not measured atomic masses or natural-abundance averages. With the same chlorine isotope in both molecules,This is the isotope scaling of diatomic vibration prediction. Doubling the light partner's mass nearly doubles the reduced mass, lowering the frequency by about . The factor differs from because the chlorine partner also moves.
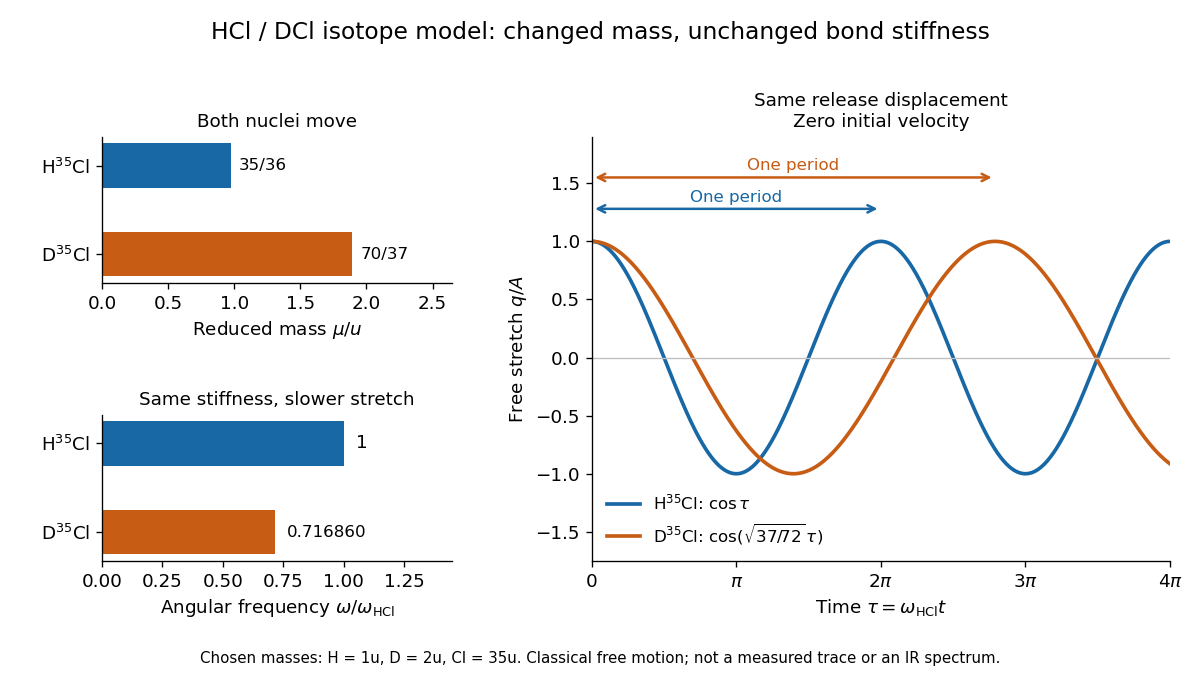
For the same small initial stretch and zero velocity, both models start with the same internal mechanical energy , but the DCl oscillation period is longer by . In the centre of mass frame, and for HCl; and for DCl. These ratios explain which partner moves and are separate from the change in frequency.
The common- assumption belongs to the leading Born-Oppenheimer approximation: fixed nuclear positions and electric charges determine the electronic potential energy, while nuclear masses govern motion on that curve. Quantitative comparison requires actual atomic masses, departures from that approximation, and separation of anharmonicity and molecular rotation from the measured band. Even with common , the quantum harmonic oscillator predicts a different zero-point energy for each isotope.[ref]
Isotope scaling of diatomic vibration 2026-10-14
Near a stable equilibrium bond length , a Taylor expansion of a diatomic molecule's potential energy gives , with . Treat the internal stretch as a harmonic oscillator of reduced mass, initially omitting molecular rotation. If replacing an isotope leaves this local potential energy curvature unchanged, thenHere is the speed of light and a spectroscopic wavenumber; use consistent length units for and . The quantum harmonic oscillator gives adjacent energy eigenvalues separated by , with the Planck constant. Consequently a vibrational photon absorption can probe the same frequency scale, subject to electric-dipole selection rules.
For an explicitly approximate isotope example, assign the atomic masses of , , , and the mass-number values , respectively, with the unified atomic mass unit. These are stipulated approximations to individual atomic masses, not measured masses of molecules or natural-abundance averages. They giveThe symbol means deuterium, . Doubling the light partner's approximate atomic mass therefore produces a large predicted shift, whereas changing the already heavy chlorine partner by two mass units produces a much smaller one. A quantitative comparison with infrared spectroscopy requires actual isotope-specific atomic masses, fitted band parameters, and uncertainties, rather than identifying any arbitrary peak with .
Isotopic abundance 2026-10-14
An isotopic abundance is an atom fraction within a specified population of one chemical element.[ref] If counts its chemical atoms of isotope , useThe denominator includes every isotope of that chemical element included in the stated population, not every chemical atom of every chemical element in the sample. Thus an oxygen atom fraction among all chemical elements is a different quantity.
For an illustrative neutral neon population, take the displayed central isotopic abundances , , and from the reference table, so . Its mean atomic mass is the weighted arithmetic meanThese are rounded reference inputs with uncertainties, not exact universal isotopic abundances; the long decimal shows their arithmetic result, not measurement precision.[ref]
The population convention matters. If instead is the fraction of total neutral-atom mass supplied by isotope , then andThis is a weighted harmonic mean in the mass fractions. Using with those mass fractions would answer a different question. The conversion follows directly by counting chemical atoms and adding their masses.
Magnesium isotope mass spectrum 2026-10-18
For a modern chosen example, the National Institute of Standards and Technology lists neutral magnesium atomic masses , , and , with reference isotopic abundances , , and . They describe the isotopes with mass numbers 24, 25, and 26, respectively.[ref]
Atomic Weights and Isotopic Compositions for Magnesium by National Institute of Standards and Technology. NIST, Atomic Weights and Isotopic Compositions for Magnesium: rows 24–26, neutral relative atomic masses and reference compositions
These modern inputs are not a reconstruction of historical observations.Use the dimensionless mass-to-charge ratio coordinate . For the illustration only, approximate ion masses by the neutral atomic masses. The singly charged positions are then near , , and ; the doubly charged companions are near , , and . The neutral-to-ion correction already given above is essential at higher accuracy. A peak near alone need not identify a chemical element: another ion with a different electric charge can occupy the same mass-to-charge ratio interval.
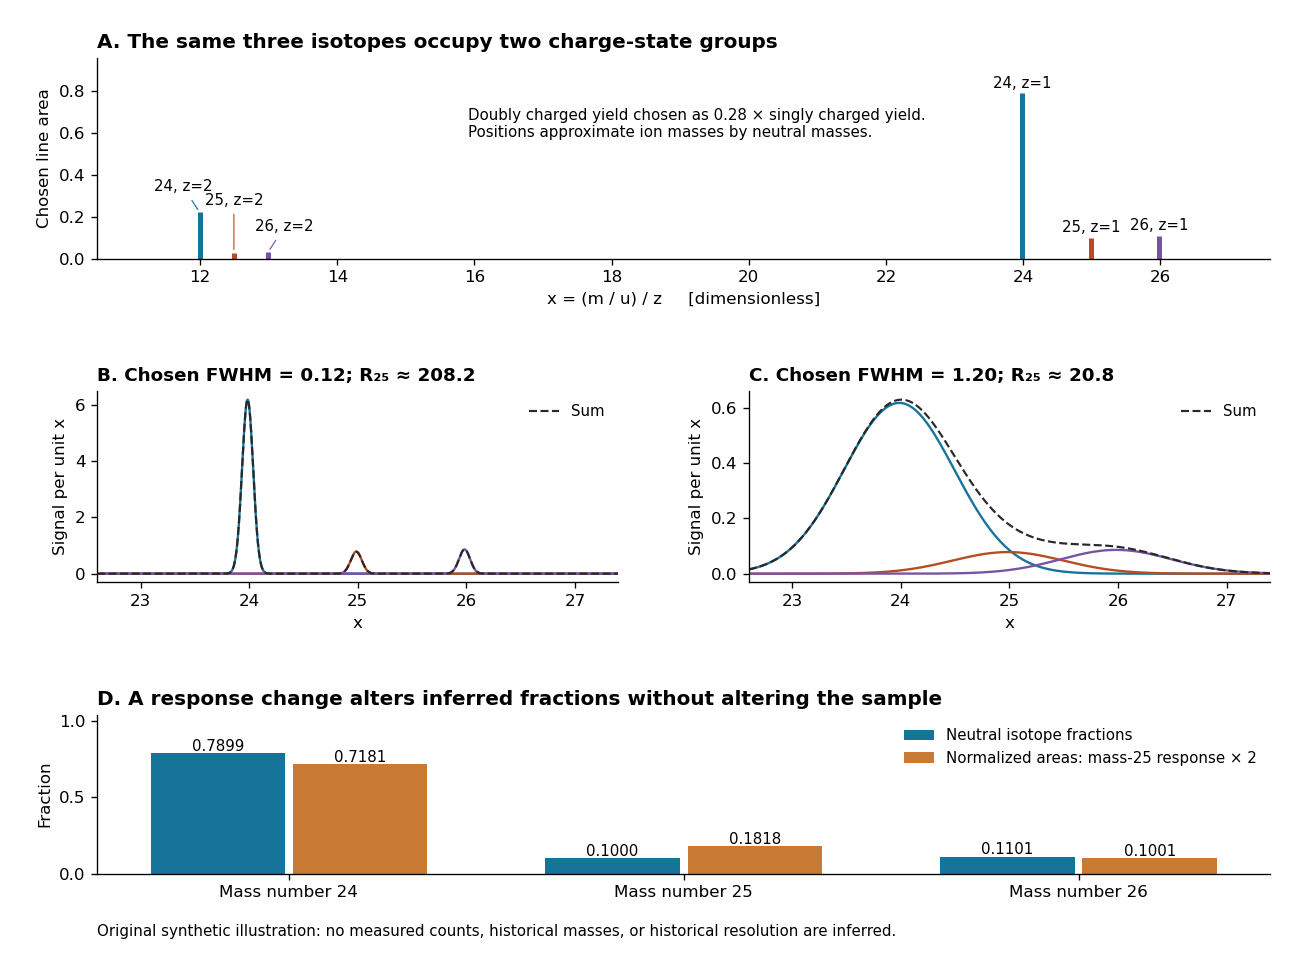
An original synthetic magnesium mass spectrum: charge states, finite mass resolution, and response bias
. All curves are stipulated sums of unit-area Gaussian functions, not measured data. The first two panels use equal isotope responses and selected full width at half maximum values and in . The last panel keeps the reference isotopic abundances fixed but multiplies the mass-25 response by two, then normalizes the areas. Neutral atomic masses approximate ion masses; charge-state yields are chosen independently, and no historical intensity or resolving-power claim is made. Details.For the narrow singly charged peak at , the chosen full width at half maximum gives mass resolving power ; widening to gives . Adjacent isotope spacings here are approximately one unit in . Peaks are visibly separated in the first chosen profile and overlap strongly in the second. A small uncertainty in a fitted peak centre would not by itself make the overlapping components resolved.
Even integrated peak areas need a response model. For isotope fraction , let collect the probability of ionization into electric charge state , transmission through the analyzer, and the detection response. In a linear instrument with overall exposure factor , the component area isEqual at a fixed makes normalized areas equal the fractions; otherwise it does not. In the chosen example, doubling only the mass-25 response changes the normalized areas to , , and , although the neutral sample is unchanged. Photographic darkening introduces another possible nonlinearity: neither line darkness nor peak height is a universal measure of neutral isotopic abundance. Calibration of position and calibration of intensity answer different questions. Matched standards, a known electric charge assignment, and a response correction make isotope analysis useful; a visually impressive set of peaks alone does not supply those controls.
Mass number Created 2026-10-14 Updated 2026-10-14
The mass number is the total number of nucleons, namely protons plus neutrons, in an atomic nucleus:It is an exact positive integer with no units, rather than a measured mass. Carbon-12 has because its atomic nucleus contains six protons and six neutrons. No improvement in a mass measurement can turn that count into or .[ref]
The left superscript in denotes mass number , not an atomic mass of exactly . For neon-22, the displayed reference atomic mass is about . Even a weighted mean of mass numbers, such as for the illustrative neon population below, is a population average, not the mass number of an individual atomic nucleus.[ref]
Mass spectrograph Created 2026-10-13 Updated 2026-10-14
A mass spectrometry instrument with a photographic readout. In the 1919 apparatus described in Chapter V: The Mass-Spectrograph, a gas discharge produced positive ions. Two narrow slits formed a ribbon beam in a vacuum; plates applied an electric field to spread it, an aperture selected part of it, and a magnetic field bent it oppositely. Focusing reduced the spread caused by differing ion speeds, concentrating a given mass-to-charge ratio into a line on a photographic plate.
The observed quantity was line displacement from a fiducial spot. Known reference lines calibrated displacement against mass-to-charge ratio; repeated exposures with changed magnetic field tested the calibration. Evacuation limited collisions. Comparing line shapes with narrow and wide apertures helped distinguish geometric broadening from photographic spreading. Finite slit widths, plate response, and overlapping molecular or multiply charged ions limited interpretation. See Chapter V: The Mass-Spectrograph (§§33–40: apparatus and photographic procedure; §§43 and 45–46: calibration, aperture comparisons, and accuracy).
In Mass spectra and isotopes by Francis William Aston (Nobel lecture, 12 December 1922), the reported neon lines at 20 and 22 have companions at 10 and 11 from doubly charged ions. That paired pattern and comparison with reference lines support different atomic masses within one chemical element, rather than an atomic mass concentrated at the bulk average. The lecture also describes an earlier failed separation by distillation and partial separation by diffusion, showing why the focused mass spectrum supplied stronger evidence. These numbers used a historical oxygen-based reference scale. The lecture's whole-number rule was an empirical approximation at its stated accuracy, not the modern exact definition .[ref]
Mass spectra and isotopes by Francis William Aston. pp. 9–13: separation attempts, focusing, reference lines, charge orders, and neon; pp. 15–17: whole-number rule and historical nuclear interpretation
Mass spectrometry Created 2026-10-13 Updated 2026-10-20
Mass spectrometry separates and detects ions according to mass-to-charge ratio. It can distinguish isotopes which belong to the same chemical element but have different atomic masses. The instrument measures ions: interpreting the result as a neutral atomic mass requires accounting for electron removal and its ionization energy. For a singly positive ion in its ground state, , where is the electron rest mass, is the ionization energy, and is the speed of light.
For a simple illustrative analyzer, positive ions of mass and electric charge gain kinetic energy across an electric potential difference before entering a transverse uniform magnetic field . The Lorentz force supplies centripetal acceleration, soAt fixed and , the measured bending radius separates mass-to-charge ratios, not masses independently of electric charge. This ideal model assumes negligible initial kinetic energy and speeds small compared with the speed of light; the historical focusing mass spectrograph used the geometry described below.
The experimental achievement is to turn invisible differences between individual ions into separated, calibrated positions. Aston velocity focusing explains how an early mass spectrograph sharpened its images; the velocity-selected magnetic mass analyzer provides an independent model whose equations can be checked directly. The magnesium isotope mass spectrum shows why position, width, and intensity carry different information.
Mass spectrum 2026-10-13
A mass spectrum displays detected signal against mass-to-charge ratio. Peak positions identify candidate ions; peak areas give isotopic abundances only after the response and overlapping contributions have been accounted for.
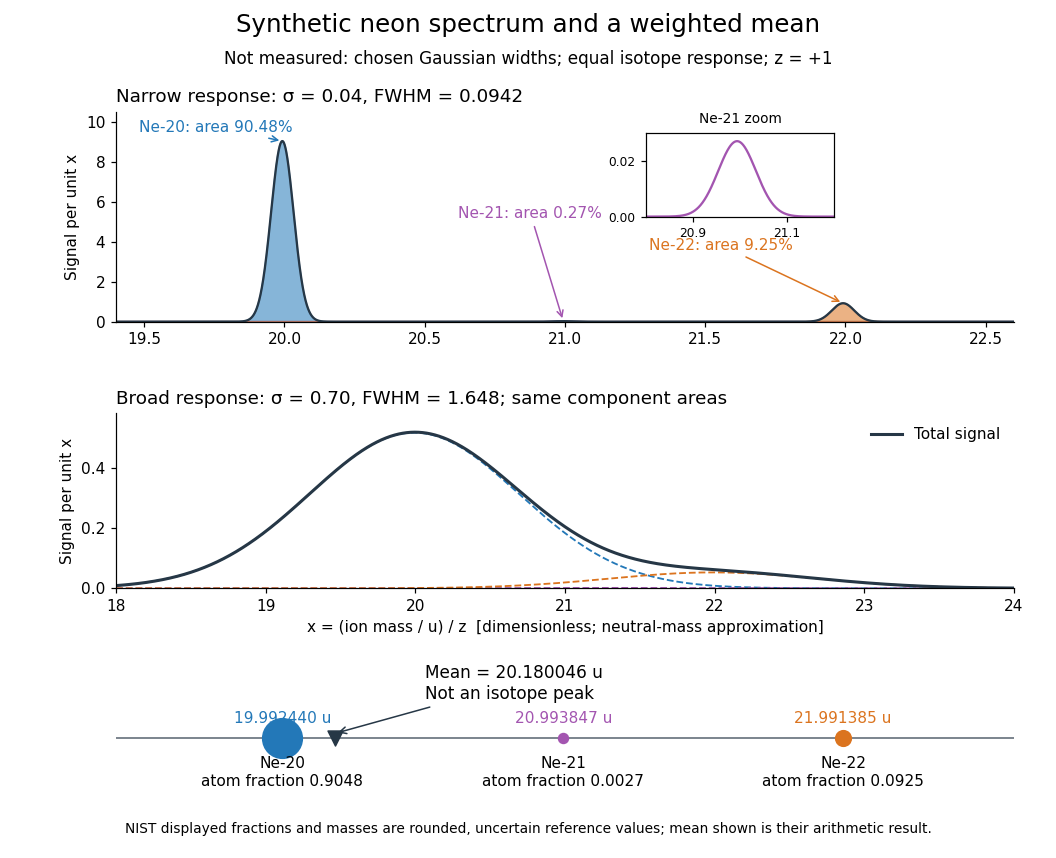
Broadening can hide a weak component without changing its area in this ideal model. An actual mass spectrum can also contain molecular ions, different electric charge states, background, and unequal detection responses. A missing visible peak therefore cannot by itself prove the absence of an isotope. Conversely, a fractional atomic weight is a property of a population: there is no requirement for an ion peak at the weighted mean.
Nuclear mass defect Created 2026-10-14 Updated 2026-10-20
The mass deficit of a bound atomic nucleus relative to its separated protons and neutrons. If their rest masses are and , the atomic nucleus has rest mass , and the positive nuclear binding energy is , thenwith the speed of light. Releasing energy when the nucleons bind reduces the rest mass of the bound system without changing the exact count . A neutral atomic mass also includes electron rest masses, reduced by the energy required to separate those bound electrons. Consequently is not the definition of the nuclear mass defect: the reference unit and constituent rest masses must also be accounted for.
Past exam of the atomic and laser physics course of the University of Oxford 2022 4 d Solution 2026-10-25
For a closed absorbing two-level system, write , let , and use for the absorption cross section. This differs from the stimulated-emission cross section convention in part (a). With , the rate equations areAt steady state, for . Hence the positive absorption coefficient isFor the given sodium fine-structure transition, the statistical weights are , , so and . The small-signal transmission gives the optical depthTo account for the finite decrease of intensity through the sample, integrate rather than treating the stronger beam as exactly uniform. If , this givesTaking as the incident intensity and ,Using the photon energy then givesIgnoring the small variation of the stronger intensity would instead give about ; the integrated value uses the stated transmissions more consistently. The length is not needed to eliminate , but gives the check .
The resonant absorption cross section is of optical-wavelength-squared size, much larger than a typical atomic geometric collision area. Pressure broadening cross sections involve phase-changing interatomic encounters and need not equal hard-sphere collision areas; their numerical value depends on collision partners and speed. No precise ratio follows from the supplied data. A useful distinction is that resonant absorption involves coherent response on the optical scale, so its cross section need not resemble an chemical atom's geometric area.
For homogeneous spectral broadening, all participating chemical atoms must share the same resonance and single-atom response width. In a dilute sample dominated by natural linewidth, the weak-beam requirement isUsing the sodium atomic mass, equality occurs near , so is a sufficient thermal condition. Spatial Zeeman energy shifts, light shifts and transit effects should also be small, the laser should address the same selected component, and the interaction should last long enough for steady populations. Uniform impact pressure broadening can also be homogeneous, but would change the width and effective cross section; it is not included in the lifetime-only numerical model.
Real sodium also has hyperfine structure and optical pumping among magnetic sublevels. The inferred is the effective cross section of the stated two-level system model, assuming statistical sublevel populations and no loss into unaddressed states. A measurement on a resolved, polarized closed hyperfine structure component requires its actual transition dipole moment and selection rules; a universal polarization-independent sodium cross section cannot be inferred from this simplified model. The dependence of resonant cross sections and saturation intensities on sublevel preparation is tabulated explicitly for the real sodium D lines.[ref]
Sodium D Line Data by Daniel A. Steck. Section on saturation intensity and resonant scattering cross section, and Table 7
Past exam of the condensed matter physics course of the University of Oxford 2021 2 e Solution 2026-10-25
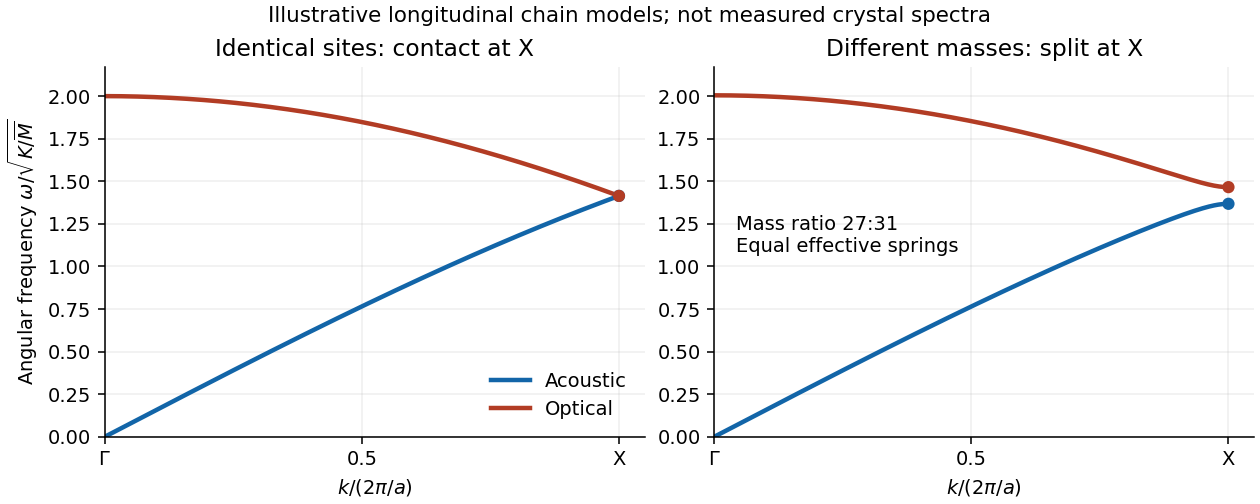
In the diamond cubic structure of silicon, the longitudinal acoustic phonon branch and longitudinal optical phonon branch meet at . The two atomic basis sites are identical, and the associated crystal symmetry protects their boundary degeneracy of normal modes. In aluminium phosphide, the two sites contain different chemical atoms. The corresponding zinc blende structure lacks the site-exchange symmetry, and these two longitudinal branches generally split at .
A simple way to see the splitting is a diatomic-chain dispersion relation with equal springs, representing successive atomic planes by alternating masses at spacing . With effective spring constant , its angular frequencies obeyAt , , so the inter-sublattice coupling cancels and the two squared angular frequencies are and . Equal masses give a contact; unequal masses giveIn aluminium phosphide, the heavier phosphorus plane moves in the lower-frequency edge mode, and the lighter aluminium plane in the higher-frequency mode in this model. Their similar atomic masses explain why the splitting is relatively small. Different electronic environments can also change the force constant matrix. The chain calculation illustrates the mechanism; a quantitative three-dimensional phonon spectrum requires its full dynamical matrix. It does not assert that all transverse acoustic and optical branches meet in silicon.


Atomic theory explains fixed composition by fixed numbers of chemical atoms, and multiple proportions by different small whole-number combinations of the same chemical atoms. The two laws are empirical regularities which the theory explains; they are not themselves direct observations of individual chemical atoms.
For the law of definite proportions, suppose a pure chemical compound has composition . If the atomic masses are and , every formula unit contains masses and . Enlarging the sample multiplies both by the same number, soThe mass ratio is therefore independent of sample size or preparation route, provided the same pure stoichiometric chemical compound is obtained. Ordinary water supplies an example: its hydrogen-to-oxygen mass ratio is approximately .
For the law of multiple proportions, compare and . At a fixed mass of A, the masses of B are in the ratioThis is a ratio of integers, and is often a ratio of small integers for simple chemical compounds. With carbon monoxide and carbon dioxide, about mass units of carbon combine with about and of oxygen: the oxygen masses are in the ratio . The chemical formulas explain why adding a second oxygen chemical atom doubles the oxygen contribution without changing the carbon contribution.
The laws alone do not uniquely determine the correct chemical formulas or the atomic weights; independent information is needed to distinguish, for example, one formula unit from a multiple of it. Modern qualifications include variations in isotopic composition and non-stoichiometric compounds. These refine the simple nineteenth-century formulation without removing its usefulness for pure compounds of fixed composition.
The cobalt-60 mass is approximately . The nuclear decay constant follows from the half-life, using a -day year:Since radioactive activity is , the parent population at certification isConvert the supplied atomic mass into molar mass, , and use the Avogadro constant:This is about of the specified isotope. It is not the total mass of the pellets or capsule, which can also contain other material.
Relative atomic mass 2026-10-14
For a chemical element in a specified population, its relative atomic mass or atomic weight is the dimensionless ratio , with the mean neutral atomic mass weighted by isotopic abundance. For the illustrative neon population, , whereas has mass units.[ref]
Velocity-selected magnetic mass analyzer 2026-10-18
Reuse the velocity selector analysis in the Thomson charge-to-mass experiment, but now send positive ions with into a separate magnetic analyzer. The selector fields and give . If the analyzer field is perpendicular to the selected velocity, its gyroradius givesfor a semicircular return to the entrance plane. The displayed impact separation is a diameter. This formula is linear in at fixed selected speed; the fixed-electric potential difference model above instead gives . They impose different experimental conditions.
For a chosen example, take , , and . Thus . Approximating an ion mass by and setting gives and . Here denotes the unified atomic mass unit. These are stipulated teaching inputs, not a reported Aston measurement or an exact magnesium atomic mass.
A finite accepted speed range broadens the radius distribution. At fixed and , . At fixed electric charge and mass, gives for a small kinetic energy spread. A one-percent kinetic energy spread therefore produces roughly a half-percent radius spread before other broadening is included. Its width convention must be specified before converting that statement into a mass resolving power.