
Molecular ion Created 2026-10-14 Updated 2026-10-20
In the International Union of Pure and Applied Chemistry (IUPAC) mass spectrometry convention, a molecular ion is formed by removing or adding one or more electrons to a molecule without fragmentation of its molecular structure.[ref]
molecular ion in mass spectrometry. Gold Book, fifth edition, molecular ion in mass spectrometry: formation by electron removal or addition without fragmentation
For example, removing one electron from intact water gives : two hydrogen and one oxygen chemical atom, total electric charge , and an unpaired electron, hence a radical cation. Atom inventory, net electric charge, and electronic state are separate pieces of information. Hydronium, , has a different inventory; it is a polyatomic ion, rather than the molecular ion obtained by electron removal from water. Polyatomic ion Created 2026-10-14 Updated 2026-10-20
A polyatomic ion consists of a bound group of two or more chemical atoms with nonzero total electric charge. Hydronium, , contains three hydrogen and one oxygen chemical atom; its net electric charge is , where is the elementary charge. This is a discrete charged group, while an ionic crystal can contain an extended arrangement of ions.[ref]
Historian of mathematics Created 2026-10-14 Updated 2026-10-24
UV transilluminator 2026-10-14
A UV transilluminator supplies ultraviolet illumination for viewing stained DNA by fluorescence after gel electrophoresis.
Agarose gel electrophoresis Created 2026-10-14 Updated 2026-11-05
Agarose gel electrophoresis uses a porous agarose polymer network. For linear double-stranded DNA within a suitable separation range, shorter fragments generally move farther in a fixed run. Raising the agarose concentration changes the mesh and the range of sizes that can be resolved.[ref]
Five Main Nucleic Acid Gel Electrophoresis Steps by Thermo Fisher Scientific. Step 1, Selection and gel preparation; Recommended percentage of agarose gels for separation of DNA fragments
A compact circular DNA molecule need not migrate like linear DNA of the same length: geometry affects passage through the mesh.[ref]Five Considerations for the Nucleic Acid Gel Electrophoresis Process by Thermo Fisher Scientific. Effects of conformation, Figure 1: nicked circular, linear and supercoiled forms of the same DNA
A concrete laboratory example is Addgene's documented DNA separation protocol. Its standard 1% gel contains 1 g of agarose in 100 mL of TAE buffer. Dissolved agarose sets in a casting tray around a comb; removing the comb leaves sample wells. The gel is covered with the same buffer solution in a box connected to a voltage source. Loading buffer contains glycerol to increase sample density and a tracking dye to show run progress. A DNA ladder occupies a separate lane beside the samples. With wells near the negative cathode, DNA migrates toward the positive anode. After separation, bound stain makes the DNA visible by fluorescence under a UV transilluminator. The DNA ladder supplies the size reference; the tracking dye monitors migration but does not identify sample DNA.[ref]
In the manufacturer's controlled comparison, the same DNA ladder runs in 1%, 2%, and 3% agarose gels with the same run time and other stated conditions. The changed gel band spacing shows why a calibration belongs to its particular gel conditions, rather than establishing a universal distance law.[ref]
Five Main Nucleic Acid Gel Electrophoresis Steps by Thermo Fisher Scientific. Step 1, Figure 3 and caption: same DNA ladder at three agarose percentages under the same conditions, including run time
In interpreting an unknown sample, a blank lane tests for detectable background or carryover in that blank, while the DNA ladder checks migration and detection of its known fragments. An empty sample lane cannot by itself distinguish absent DNA from unsuccessful loading or insufficient detection. These controls answer different questions; neither makes matching migration a proof of matching nucleotide sequence.
Frequency modulation laboratory 2026-10-14
The New Jersey Institute of Technology's Lab 2: FM Modulation, Demodulation and Bessel Zeros, Part I, prepares a voltage-controlled oscillator in low-frequency mode. A frequency counter reads its output while a buffered constant electric potential difference calibrates its sensitivity. Sweeping the control voltage checks linearity; the calibrated gain is then held fixed.[ref]
Lab 2: FM Modulation, Demodulation and Bessel Zeros, NJIT ECE 489. Part I, Figure 2 and steps T1–T7: VCO preparation, frequency-counter readout, DC sensitivity and linearity sweep
An audio oscillator replaces the constant control voltage. An oscilloscope displays the signal and its FFT frequency spectrum together. Zero modulation supplies a carrier reference. Increasing message amplitude reveals sidebands, compares their heights with the carrier, and locates a carrier minimum. These readouts test the spectrum and infer frequency deviation. This is a student procedure, not a report of measured results.[ref]
Lab 2: FM Modulation, Demodulation and Bessel Zeros, NJIT ECE 489. “The FM Spectrum”, steps T8–T13: audio-oscillator input, simultaneous waveform/FFT, unmodulated reference, relative sideband heights and carrier minimum
A carrier minimum is a minimum of one Fourier coefficient, not disappearance of the whole signal. In the ideal model the first positive zero of is approximately , while the wave envelope remains . The lab's introductory special-cases paragraph agrees with this rounded value; step T12 mistakenly repeats the equal-sideband value for the carrier zero.[ref]
Lab 2: FM Modulation, Demodulation and Bessel Zeros, NJIT ECE 489. “Special Cases, β=1.45 and β=2.405”, compared with the inconsistent numerical annotation in T12
The interpretation also has practical limits. A finite recording limits frequency resolution; inadequate sampling can cause aliasing; and nonlinear VCO response can introduce extra components. Keeping the gain fixed and first checking linearity helps distinguish those effects from a change in FM modulation index. The diagrams above are independent model calculations, not laboratory measurements.
Narrowband frequency modulation 2026-10-14
When the FM modulation index satisfies , a Taylor expansion gives a useful first-order approximation. With and ,The product-to-sum formula for sines exposes a carrier and one pair of sidebands, with opposite signs for this wave phase convention. Higher sidebands are neglected, not identically absent. For , the predicted normalized first-sideband magnitude is close to the original exact evaluation . The neglected waveform term is bounded in absolute value by , using the second-derivative bound for the cosine. Small frequency deviation relative to alone does not justify this approximation: it is that must be small.
Single-tone FM sidebands 2026-10-14
A single-tone FM signal has components displaced from the carrier wave frequency by integer multiples of the message frequency. These are temporal sidebands; the spatial sidebands used to perturb a spatial pattern are a related but different setting. To find the temporal components, apply the Jacobi-Anger expansion to the complex representation:Here is a Bessel function of the first kind. The identity follows by setting the generating variable to in its generating function.[ref]
NIST Digital Library of Mathematical Functions. Chapter 10, §10.12, equation 10.12.1 and the substitution described in the section notes
Taking the real part gives the exact real signal expansionThe complex representation has a Fourier coefficient at ; the normalized magnitude is . The identity makes upper and lower complex sideband magnitudes equal, but their signs matter when reconstructing the wave phase. A negative coefficient reverses a component's wave phase by ; an amplitude display alone hides that information.
For , original evaluation gives , , and . Thus there are appreciable components at and , outside the – range of the instantaneous frequency. There is no contradiction: instantaneous frequency describes the local rate of the combined wave phase, while the frequency spectrum describes a global superposition of constant-frequency components.
For the real signal, negative frequencies must also be accounted for: a cosine at equals one at . When , the normalized positive-frequency cosine coefficient at , , is exactly . The second term is extremely small over the plotted range, but the figure includes it. The chosen complex representation need not have a frequency spectrum supported only at positive frequencies, even when its specified instantaneous frequency is everywhere positive.
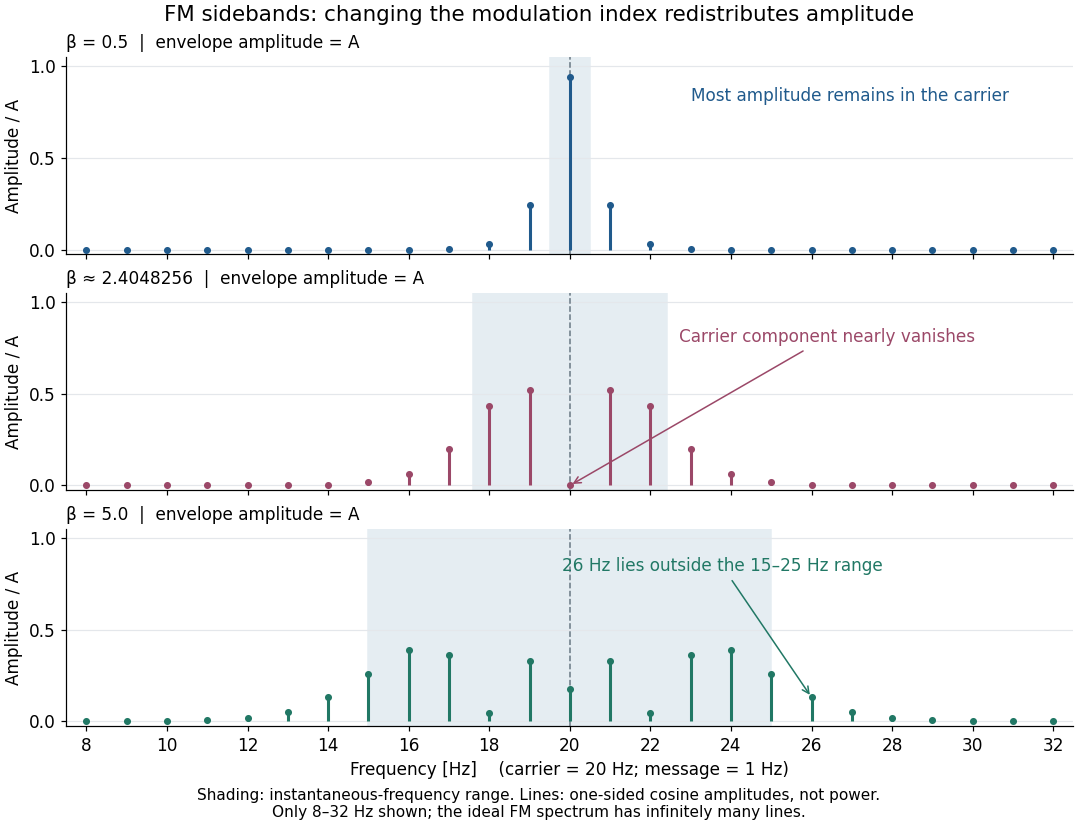

For a nonzero FM modulation index, the ideal frequency spectrum has infinitely many sidebands. Many become tiny, but drawing only visible lines does not make the exact signal bandwidth finite. A useful engineering width must state a threshold or a retained-power fraction. For the complex representation, Parseval's identity gives a simple check:At , the sum through is approximately . Retaining those complex components captures over of their squared magnitudes and spans from to . This is a stated truncation criterion, not an exact cutoff or a universal bandwidth rule. It also explains why a diminished carrier component need not imply a diminished envelope: its contribution has been redistributed among sidebands.
FM modulation index 2026-10-14
For a message consisting of a single sinusoid with frequency , the FM modulation index is . It is dimensionless and equals the peak wave phase excursion in radians in the chosen sine-phase convention. Keeping while changing from to reduces from to : the same frequency deviation acts for a shorter portion of each message cycle. A general message containing many frequencies does not have a single with this meaning.
Frequency deviation 2026-10-14
The peak frequency deviation is the largest absolute value of the instantaneous frequency offset from the chosen carrier wave frequency . For , it is . It is a frequency, measured in hertz, rather than a wave phase or an exact signal bandwidth.
Instantaneous frequency 2026-10-14
For a signal with a specified differentiable, continuously unwrapped wave phase , its instantaneous frequency isUnwrapping means following successive turns instead of resetting the wave phase at . Differentiating a reset phase would introduce artificial jumps. An arbitrary real signal does not by itself specify a unique amplitude-phase representation; this definition refers to the phase chosen in the model.
For the single-message-frequency FM model,The proof is the chain rule: the derivative of the sine contributes , which cancels the in the definition. In the example, , , and . Although the frequency offset vanishes at , the wave phase offset is then radians; the wave phase offset and its rate of change need not vanish together.
Between times , the accumulated number of cycles is . Thus a crossing-to-crossing measurement yields an average frequency over that interval. Its reciprocal time is only an approximation to the instantaneous frequency at one point when varies slowly over a cycle.
Molecular beam Created 2026-10-14 Updated 2026-10-18
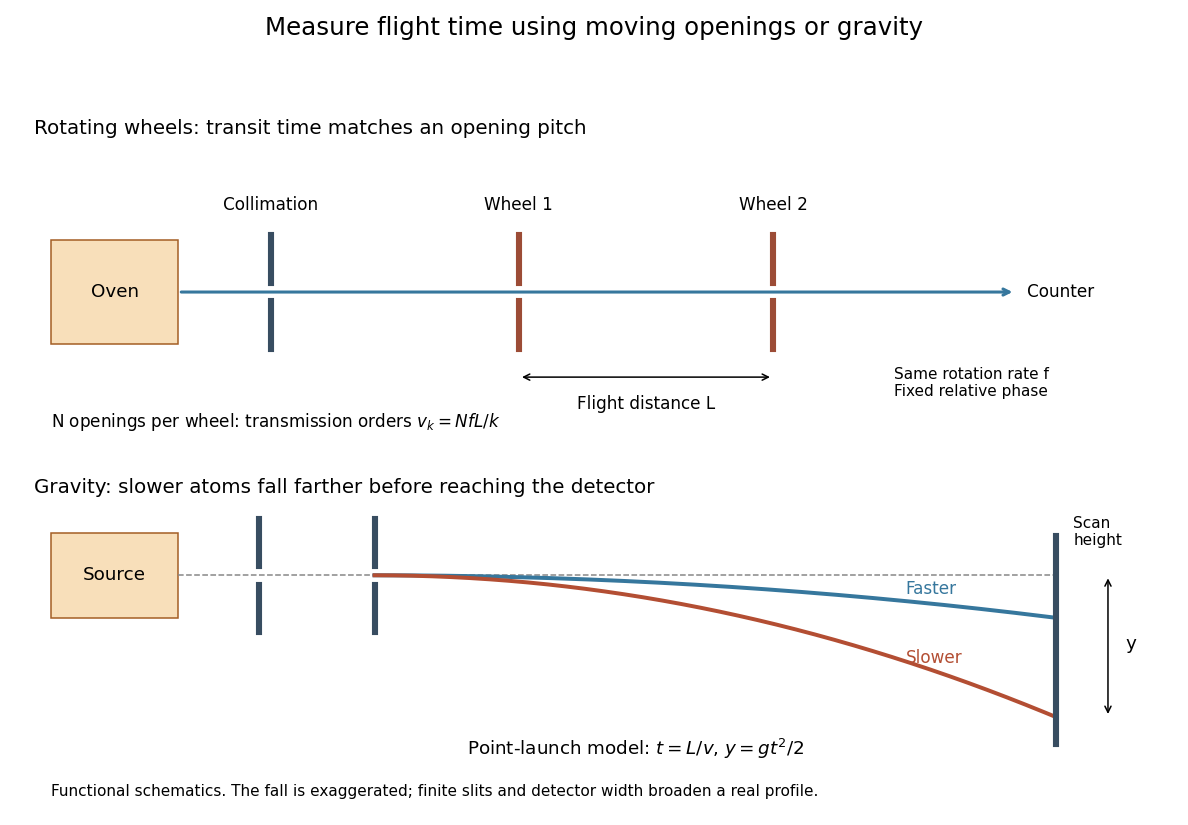
A molecular beam also includes a stream of chemical atoms, then called an atomic beam. An oven supplies particles; aligned slits restrict their directions, and a vacuum limits subsequent collisions. Narrowing the directions does not by itself make every particle's speed equal. This gives a useful separation of tasks: prepare a path, select or measure speed, apply an interaction, and read the resulting particle counts or deflection.
The advantage is unusually tangible. A magnetic field can separate spin components in the Stern-Gerlach experiment; even gravity can sort a beam by flight time. The effusive beam speed distribution explains which particles leave the source, while gravity deflection of an atomic beam explains how that distribution becomes a pattern on a detector.

ATP synthase Created 2026-10-14 Updated 2026-10-18
ATP synthase is a molecular motor that couples downhill proton movement across a cell membrane to formation of ATP from ADP and inorganic phosphate. In oxidative phosphorylation, this is the machinery that makes chemiosmosis productive: an electrochemical gradient becomes reusable chemical driving capacity.[ref]
Rotary catalysis of FoF1-ATP synthase by Rikiya Watanabe. Watanabe, Rotary catalysis of FoF1-ATP synthase, 2013, p. 51, opening paragraphs
Its usefulness is a conversion between currencies. A membrane-spanning proton-motive force can power a local machine, while newly formed ATP can participate in energy coupling elsewhere. The enzyme supplies a route between these forms of free energy; it cannot make an energetically uphill total cycle favourable merely by accelerating its chemistry.
Collagenase Created 2026-10-14 Updated 2026-11-05
A collagenase is an enzyme capable of cleaving collagen. Substrate range differs between bacterial collagenases and mammalian matrix-remodelling enzymes, so the label does not specify a unique sequence or cleavage pattern. Cleaving the structurally resistant extracellular substrate enables tissue remodelling and can help release cells from a tissue. Activity on one collagen preparation does not establish equal activity on every collagen type. [ref]
Phospholipase C Created 2026-10-14 Updated 2026-11-05
Phospholipase C cleaves a phospholipid phosphodiester bond. In a prominent signalling pathway, cleavage of phosphatidylinositol 4,5-bisphosphate produces membrane-associated diacylglycerol and soluble inositol trisphosphate. The latter can stimulate calcium release from intracellular stores, while diacylglycerol regulates selected protein kinase C isoforms. The two products carry information into different cellular locations. [ref]
Effect of inositol-1,4,5-trisphosphate on isolated subcellular fractions of rat pancreas by H. Streb and others. 1983, calcium release from an intracellular store
Ohmmeter 2026-10-14
An instrument that measures electrical resistance by applying a test excitation and observing the response.
Electrical test source 2026-10-14
A prescribed voltage source or current source used to probe a terminal response. For a suppressed linear resistive circuit, the ratio of terminal voltage to entering electric current determines the Thévenin resistance when finite.
Open-circuit voltage 2026-10-14
The terminal electric potential difference with zero external electric current, when a finite value exists. A reading from a finite-input-electrical resistance voltmeter approximates it subject to voltmeter loading.
Frequency counter 2026-10-14
An instrument measuring the rate of repeated electrical events; it supplies the frequency readout when calibrating a voltage-controlled oscillator.
Multimeter 2026-10-14
A multimeter combines measurements such as electric potential difference, electric current and electrical resistance in one instrument. Some models also measure capacitance; the supported functions and test conditions depend on the instrument. The dielectric laboratory example uses a multimeter in capacitance mode.
There are unlisted articles, also show them or only show them.