Assume a conventional finite-radius tapping tip whose apex radius and shank are not negligible compared with a trench. The recorded depression is shallower and tip-limited, because the tip contacts the sides before its apex reaches the sharp bottom. Its apparent shape is the accessible envelope of the tip and specimen, not a faithful geometric section.
At a descending edge the separation initially increases, so the oscillation amplitude tends to rise above its setpoint until the controller moves downward. At an ascending edge it tends to fall, until the controller moves upward. For a narrow trench these transients can overlap or partly cancel. With ideal tracking the amplitude remains at its setpoint even when the height is wrong because of tip geometry. Thus a small amplitude error is not proof that the trench bottom was reached.
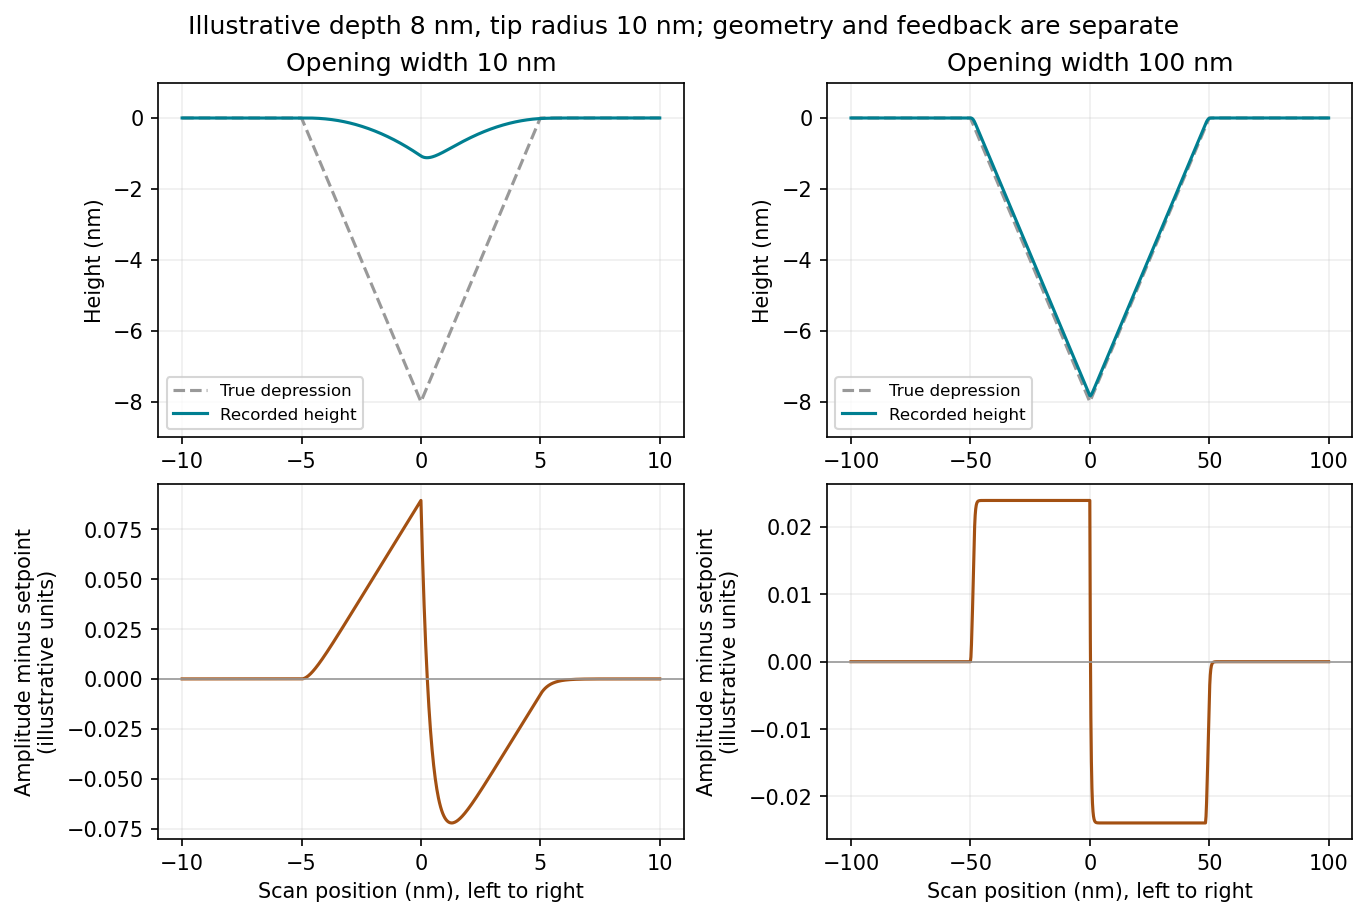
Original illustrative tapping-mode responses to narrow and wide depressions; heights are tip-accessible envelopes and amplitude errors depend on the stated finite-bandwidth model
. Details. 
Width alone does not determine a unique trace: depth, tip radius, cone angle, scan speed and feedback bandwidth are also needed. The plotted traces illustrate the common finite-tip interpretation rather than infer those missing quantities from the drawing.
If the same tip is much smaller than the opening and its shank can enter the depression, the height trace follows the V-shaped depression much more closely, with rounding near the apex and limitations at steep walls. It can reach the actual bottom only if the tip angle and depression depth permit access.
Properly adjusted feedback keeps the measured amplitude close to the setpoint through most of the scan. Small positive and negative amplitude errors occur on descent and ascent with the sign convention in part(a). They are more spatially separated for a wider feature. Reducing scan speed reduces dynamic errors but cannot remove finite-tip exclusion. The figure separates these geometric and feedback effects.
Measure pit dimensions from calibrated height data after background correction, with an explicit pit-boundary convention. Preserve the raw image, lateral calibration and acquisition settings. Level the surrounding terraces and correct line offsets with the pits excluded from the fit; otherwise the deep features bias the background.
Segment each depression relative to its local surface, for example by a reproducible height threshold or a fitted rim. Inspect segmentation overlaid on the image. For noncircular pits, report a metric such as equivalent-area diameteror maximum and minimum caliper diameters, rather than pretending every pit has a circular rim. Apply the same definition to all objects and exclude overlapping or edge-truncated pits where appropriate.
The visible scale bar can calibrate a rendered image approximately, while the original pixel-spacing metadata is preferable. The vertical scale is not a lateral calibration. Estimate uncertainty from pixels, threshold choice, background fits and repeated scans. The tip may be unable to enter narrow pits, so measured depths and diameters require a tip convolution assessment or a sharper calibrated probe. Finally classify populations only against independently validated size/type evidence; the image alone does not establish a universal diameter cutoff for edge, screw and mixed dislocations.
Conductive atomic force microscopy can map current near the pits while recording topography. Use a conducting tip, a suitable counter-contact to the film and an imposed bias, then compare current maps and local current–voltage curves near and away from dislocations. Spreading resistance microscopy is another useful electrical mode when its contact conditions and calibration are suitable.
Current depends on tip contact area, contact resistance, surface oxide, bias and local carrier barriers as well as the material's conductivity. Compare regions under controlled force and bias, check repeated scans for damage and distinguish a geometrical contact artifact from an electrical change. A surface-potential image can complement these measurements, but it does not by itself measure conductivity.
LiftMode is a two-pass measurement separating a measured topographic path from a longer-range interaction measurement. The first pass records height with ordinary topographic feedback. On the second pass the tip retraces that line at a chosen vertical offset above it, reducing contact and short-range contributions while detecting electrostatic or magnetic interactions.
The lift height is relative to the recorded path, not a single constant laboratory height over a corrugated sample. Its usefulness depends on first-pass accuracy and whether the relevant long-range signal remains detectable at that separation.[ref]
Scanning Probe Microscopy Modes by Bruker. LiftMode two-pass description and retracing the stored topography with a height offset
Use Kelvin probe force microscopy to quantify a local contact-potential difference. A conducting tip and sample form a position-dependent capacitor. Apply a voltage with adjustable direct and small alternating components,The electrostatic force is proportional to , so its component at is proportional toup to the chosen force-direction convention. A lock-in amplifier detects this component and a second controller adjusts to null it. At the null, . The compensation voltage becomes the potential image.[ref]
Scanning Probe Microscopy Modes by Bruker. Surface Potential Imaging: conducting probe and electrostatic null measurement
A lift pass can reduce direct topographic interactions. Calibration on a reference with a known work function is required for an absolute work-function interpretation, and the sign convention must state which electrode is biased. On a semiconductor the result can include surface band bending, trapped charge and surface chemistry, so it need not equal a simple map of bulk electrochemical potential.
The measured potential is a spatially weighted electrostatic signal, not an infinitesimal-point voltage. The apex, cone and cantilever all contribute capacitance; increasing lift height weakens the signal and broadens its lateral averaging. Small pits can consequently show reduced or distorted contrast.
Imperfect topographic tracking changes the true separation on the lift pass, producing crosstalk correlated with pit geometry. Tip contamination or work-function drift changes the reference. Adsorbed water, mobile charges, illumination, atmosphere and surface states can change the specimen during measurement; semiconductor band bending can also depend on the applied electrical excitation.
There is a tradeoff between small lift height and suppressing short-range/topographic interference. Repeat at several heights, check trace/retrace and an electrical reference, and compare with independently measured electrical response. A stable potential contrast is evidence of a local electrostatic difference, not by itself proof of a particular dislocation's conductivity.
A useful scale estimate is , where . Five complementary developments are immersion optics, illumination shaping, phase-shifting masks, computational proximity correction and multiple patterning. They address different parts of the process rather than repeal diffraction.
Immersion lithography raises numerical aperture by putting a compatible high-index liquid between the final lens and wafer. Off-axis, annular or dipole illumination places useful diffraction orders within the projection pupil and improves contrast for selected pattern directions.
A phase-shift mask uses controlled optical phase differences to sharpen destructive interference around selected features. Optical proximity correction modifies mask edges and adds assist features to compensate pattern-dependent image formation, resist and etch biases.
Multiple patterning divides a dense final layout into more widely spaced optical patterns, or uses spacer-based pitch division after an optical definition step. Overlay, etch control and pattern decomposition are then critical. For example, with , and , a single-exposure scale is roughly ; obtaining dense features of order commonly requires pitch multiplication rather than attributing everything to one exceptionally sharp aerial image.
These resolution enhancements also require suitable resist contrast, focus control and metrology. The manufacturer's description explains the numerical-aperture benefit of immersion; no claim about a particular 2018 production process is inferred from its current product pages.[ref]
Lenses and mirrors by ASML. Lithography-principles description of water immersion and increased numerical aperture
Locate an isolated nanowire first, then align source, drain, dielectric and top-gate patterns to it. A suitable research-device sequence is the following; the semiconductor is unspecified, so contact-barrier and surface-cleaning details cannot be assumed universally ohmic.
Prepare a clean electrically insulating substrate, with alignment marks. Disperse a sparse population of nanowires from the suspension, remove the carrier solvent compatibly, and locate a suitable isolated wire by microscopy. Record its position relative to the marks.
Use aligned electron beam lithography and a suitable lift-off process to open contact regions near the two ends while leaving a central channel. Clean the exposed contact regions without destroying the wire, evaporate gold and lift off. The contacts overlap the ends but do not bridge the central channel; test their electrical behavior before assuming an ohmic response.
In a second aligned pattern, define a central dielectric patch that extends beyond the proposed gate edges. Evaporate the specified silicon monoxide and lift off using a profile that permits film separation. Verify coverage over the wire and absence of pinholes: directional deposition onto curved nanoscale geometry is not automatically conformal.
Define and evaporate a gold top gate over that insulated central patch, with its lead kept electrically separated from the source, drain and wire. Lift off and test gate leakage before extracting transistor characteristics. The dielectric must remain continuous under the gate and overlap its edges; the illustrated central gate is not a third direct metal contact to the semiconductor. Gold and silicon monoxide are used as stipulated, without silently replacing SiO by a different oxide.
Replace one-wire discovery and bespoke alignment with reproducible placement, uniform device geometry and a scalable interconnect process. A circuit needs wires at known sites and orientations with controlled diameter, channel length, composition and electrical properties. Directed assembly, transfer or patterned growth can address placement, but must be validated for occupancy and alignment yield.
Use aligned array patterning rather than locating every randomly deposited wire individually. Control contact resistance, dielectric continuity and gate overlap across the wafer. Plan dielectric isolation, crossovers, vias and multiple interconnect levels so that connections do not short neighboring gates or channels. A reliable supply of the required device polarities and threshold voltages is also needed for the intended logic architecture.
Circuit manufacture additionally requires contamination control, compatible thermal budgets, passivation, dimensional and electrical metrology, defect detection, test structures and repair or redundancy strategies where appropriate. Serial electron-beam writing is useful for prototypes but can become a throughput bottleneck; scalable optical or imprint-based pattern transfer is attractive when its alignment and resolution meet the design. A successful isolated transistor does not establish circuit-level yield or reliability.
Use a self-assembled monolayer of an alkanethiol with a polar terminal group, such as . Sulfur anchors to gold while the exposed hydroxyl groups interact favorably with water. A methyl-terminated monolayer would instead present a low-polarity outer surface and usually retain hydrophobic character.
Prepare a clean gold surface, allow adsorption from a compatible clean solution, and rinse away unbound material. Dense coverage and molecular ordering help make the terminal chemistry reproducible. Mixed chain lengths or incomplete coverage can change the wetting response, so the presence of an OH group in the bottle alone is not sufficient. An original experiment demonstrated hydrophilic hydroxyl-terminated films and showed that mixing chain lengths changed surface order and wettability.[ref]
Molecular-Level Control over Surface Order in Self-Assembled Monolayer Films of Thiols on Gold by Colin D. Bain and George M. Whitesides. Science240, pp.62–63, abstract: sulfur anchoring, exposed hydroxyl groups and effects of mixed chain lengths
This specifies the resulting interface rather than treating every freshly prepared gold surface as intrinsically identical: contamination, preparation and adsorbates influence the starting contact angle.
A useful net bookkeeping reaction for thiol adsorption iswith removal or reaction of the hydrogen depending on environment. Equivalently, a simplified overall balance can combine two hydrogen atoms into . These balances identify sulfur anchoring; they are not a claim that one elementary adsorption step universally releases hydrogen gas.
Molecules arrive at the interface, adsorb through sulfur, and reorganize laterally as coverage grows. Interactions between the chains favor packing and order, with the hydroxyl end groups facing outward. Gold surface structure, defects and adsorption conditions affect the final film.
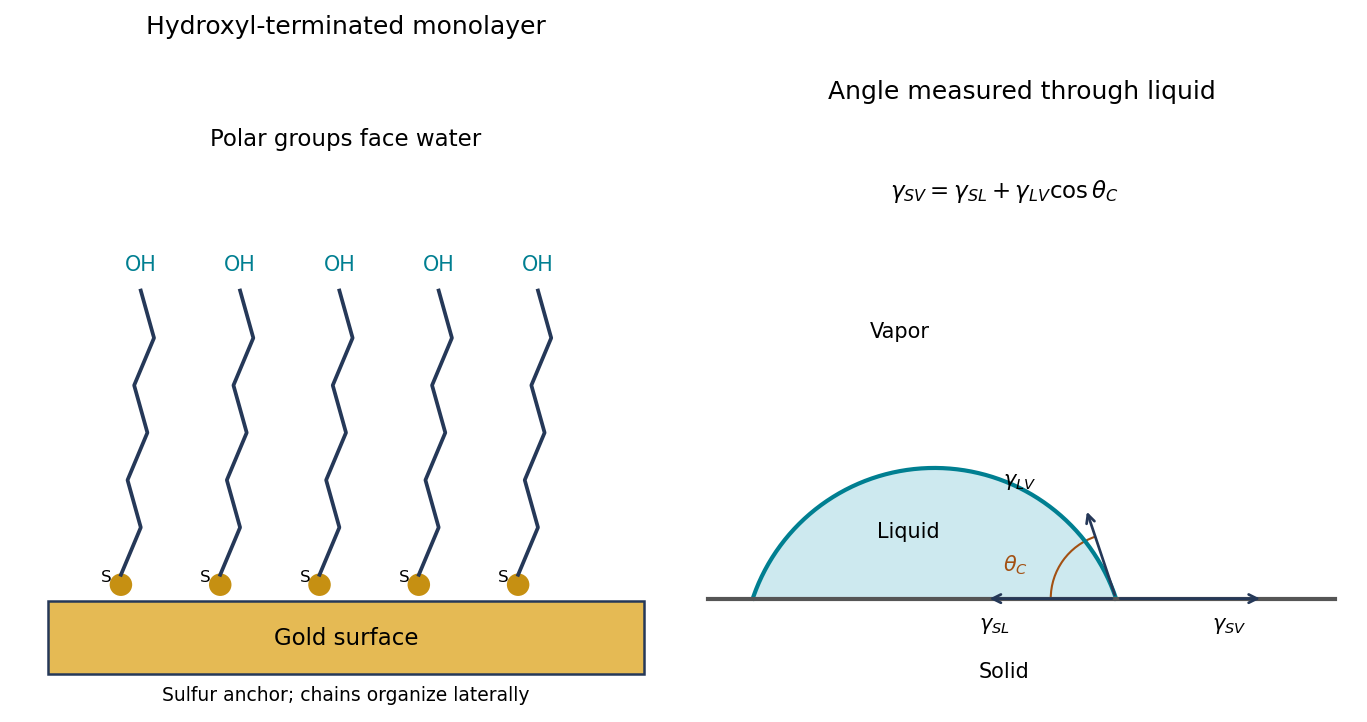
Original schematic of hydroxyl-terminated molecules anchored to gold and the through-liquid contact angle with interfacial-tension balance
. Details. 
The contact angle is measured through the liquid between the solid surface and the tangent to the liquid–vapor interface at the contact line. The right panel of the wetting diagram labels that angle and the three interfacial tensions.
At , the ideal macroscopic limit is complete wetting: a film spreads rather than remaining a finite-angle cap. Angles between and are conventionally called hydrophilic for water; the drop wets the surface relatively well. At the tangent is vertical. Between and the water drop is conventionally hydrophobic, with increasingly weak wetting. The exact limit represents vanishing macroscopic contact in an ideal model, not a routine finite-area sessile drop on a real solid.
The categories describe water under specified conditions. Roughness, contamination and contact-line pinning can make advancing and receding angles differ from each other and from the ideal equilibrium angle.
Use unambiguous symbols for solid–vapor, solid–liquid and liquid–vapor interfacial energies. The printed description repeats an interface subscript, so it cannot be used literally for two different interfaces.
For a smooth homogeneous equilibrium surface, take a horizontal displacement of the contact line. The substrate-parallel force balance isThus the contact-angle relation is Young's equation:The same result follows by varying interfacial free energy at fixed liquid volume. It assumes equilibrium, no contact-line pinning, and negligible line-tension and roughness corrections. If the inferred cosine lies outside , the finite-angle equilibrium construction fails and a wetting limit must be considered.
The name in the question should be distinguished from the Young–Laplace equation, which relates a pressure jump to interface curvature. The horizontal interfacial balance derived here is Young's equation; it does not require introducing a pressure-curvature formula.
This is the first printed “(vi)”, concerning adhesion. The reversible work per unit area to separate the solid–liquid interface into solid–vapor and liquid–vapor interfaces isSubstitute from Young's equation:This is the Young-Dupré equation. It has units , equivalent to . The liquid–vapor tension is the multiplier; the abbreviated printed subscript does not denote a new interface. Within this equilibrium model, smaller water contact angle means larger reversible work of adhesion for fixed liquid–vapor tension.
At the theta temperature, use the long-chain ideal-coil relationsThe two stated molar masses have ratio . ThereforeThe input is an end-to-end root-mean-square distance, not a radius of gyration: omitting would give the wrong result. The apparent missing superscript in the printed masses does not affect the factor-five ratio used here. The estimate assumes the same chain architecture and unperturbed segment statistics, and uses the long-chain rather than finite-link correction.
This is the second printed “(vi)”, concerning solvent temperature. The coil is expected to expand, so its radius of gyration increases. For the usual upper-critical-solution-temperature behavior of polystyrene in cyclohexane, heating above the stated theta condition improves solvent quality. Effective repulsion between segments favors more expanded conformations than the ideal coil.
In a Flory–Huggins solution theory description, the theta condition corresponds approximately to interaction parameter , whereas a good solvent has a positive effective excluded volume. The asymptotic size dependence crosses toward with near for a flexible chain in three dimensions. These scaling ideas establish the expected direction, not a numerical expansion factor for a ten-degree temperature change. Its value would require measured solvent-interaction data or a calibrated crossover model.
Taking the printed reference to part(iii) literally, measure an equilibrium water contact angle with a calibrated sessile-drop goniometer on a smooth homogeneous surface. With independently constrained interfacial tensions, test . Advancing and receding measurements reveal pinning and hysteresis; contact angle alone cannot independently determine both unknown solid-interface energies.
If the intended reference was instead the polymer-size prediction in the preceding part, use static light scattering or small-angle neutron scattering at both temperatures on appropriately dilute solutions. At small scattering wave number , the Guinier approximationgives from the slope of against . Control concentration, aggregation and scattering contrast, and compare the extracted radii. Dynamic light scattering normally measures a hydrodynamic size rather than directly the same radius of gyration. Answering both readings avoids silently correcting the printed cross-reference.
Above-gap photon absorption generates electrons and electron holes. A p-n junction's built-in field and carrier diffusion direct them toward selective contacts; their nonequilibrium populations can maintain separated quasi-Fermi levels and deliver electrical power. The equilibrium built-in voltage alone is not a battery supplying continuous power.
Choose diode current positive into the cell. An idealized characteristic isIllumination shifts the curve downward. At short circuit ; at open circuit . Between those points, and , so the delivered power is positive.
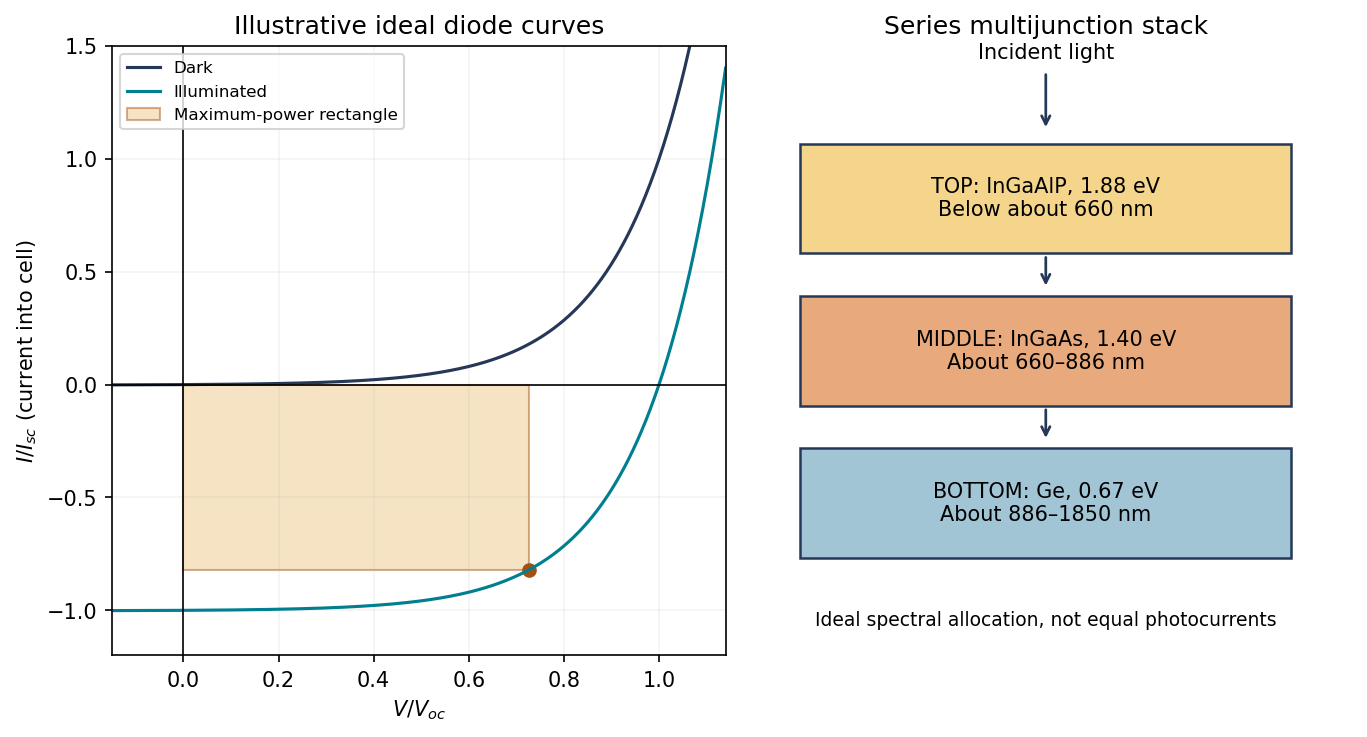
Original idealized photovoltaic current–voltage curves and the descending-bandgap order of the proposed three-junction stack
. Details. 
The solar-cell fill factor compares maximum delivered power with the open/short-circuit rectangle:Series resistance, leakage, recombination and temperature change the shape and hence the fill factor. Neither the short-circuit nor the open-circuit point itself delivers power.
The useful bandgap depends on the illumination spectrum, not only on whether the device is indoors or outdoors. The stipulated gap gives a long-wavelength absorption threshold near ; gives about using in nanometers.
Outdoor sunlight contains substantial visible and near-infrared power, so cadmium telluride can use a broader portion of that spectrum while retaining a useful output voltage. Its direct-gap absorption permits thin absorbers and large-area thin-film manufacture. Challenges include contacts and interfaces, collection and recombination, material supply and managing cadmium-containing material through fabrication and end-of-life handling.
Many indoor lamps concentrate their emission in the visible and provide little near-infrared power. A wider-gap absorber can then trade fewer lost useful photons for a higher attainable voltage and a smaller thermal dark-current penalty. Hydrogenated amorphous silicon has strong visible absorption, permits low-temperature large-area deposition and can suit low-power indoor devices. Disorder and defects restrict transport, and light-induced degradation and passivation stability must be controlled. Its larger gap forfeits more of the outdoor red/near-infrared spectrum.
These are suitability arguments, not guaranteed efficiencies. Indoor lamp spectra differ, and shunt leakage and recombination become particularly important at low light. Bandgap alone does not establish which finished device produces more power in every room.
For a monolithic series-connected multi-junction solar cell, all junctions carry the same terminal current, so a weakly illuminated junction limits the useful series current. Adjust absorber thicknesses, compositions and optical coupling to balance collected photocurrent. Tunnel interconnects provide electrical continuity; low-loss contacts and interfaces also matter. Equal incident energy in each spectral band would not guarantee equal current, because photon counts and collection efficiencies differ.
Put the largest bandgap at the illuminated top and the smallest at the bottom:The top absorber captures high-energy photons while transmitting lower-energy photons to the subsequent layers. Placing germanium first would absorb photons that the higher-gap cells could use at higher voltage.
The absorption edges are approximatelyFor ideal sharp, complete absorption without reflection, the available plotted spectral bands are therefore the visible region below for the top cell, – for the middle cell, and – for germanium. Photons beyond pass all three ideal absorbers. The source plot begins around , so it does not supply an ultraviolet integral below that point.
Using coarse readings of the provided curve, the band integrals are of order , and in plotted-ordinate-units times nanometers, respectively. These are only approximate areas under a low-resolution graph, not calibrated radiances in SI units: the ordinate gives no physical unit or spectral normalization. The robust result is the band allocation; precise photocurrent matching needs a calibrated spectrum and each junction's external quantum efficiency,Thus the diagram and band boundaries establish the intended stack, while the plot cannot justify precise watt-per-area or current values.
The dimensional material figure of merit and its common dimensionless form areHere is the Seebeck coefficient, the electrical conductivity, the electrical resistivity, and the total thermal conductivity. has units ; is dimensionless.
Seek a large thermoelectric power factor and low thermal conductivity. Optimize carrier concentration and band structure to balance thermopower and conductivity. Alloy disorder, complex unit cells, grain boundaries or suitable nanoscale features can scatter phonons and reduce lattice heat transport.
The properties are coupled: increasing carrier density often reduces , electronic heat conduction grows with electrical transport, and boundaries that scatter phonons may also scatter carriers. Evaluate the net change and the operating-temperature range, rather than maximizing each favorable term independently.[ref]
Complex thermoelectric materials by G. Jeffrey Snyder and Eric S. Toberer. Carrier-concentration tradeoffs and strategies for reducing lattice heat transport
Conducting organic materials can be attractive for flexible, lightweight and near-ambient heat harvesters; inorganic materials offer a wider established range of high-performance and high-temperature options. The appropriate comparison includes device geometry and durability as well as peak .
Conducting polymers can have low lattice thermal conductivity, be solution processed and accommodate mechanically compliant large-area devices. Their carrier concentration and ordering can be modified through doping and processing. Contact resistance, environmental stability, reproducibility and obtaining stable complementary p- and n-type materials can limit practical modules. Their organic character does not imply that they remain stable at high temperature.
Inorganic thermoelectrics can provide high power factors, temperature stability and mature transport data over application-specific ranges. Some compositions are brittle, dense, expensive or contain elements requiring careful environmental management; they are not all interchangeable. Interfaces, thermal cycling and interconnects can dominate device lifetime.
An experimental example of organic optimization controlled the oxidation level of a conducting polymer to balance transport and its low thermal conductivity, showing that organics are not categorically excluded from thermoelectric performance improvements.[ref]
Optimization of the thermoelectric figure of merit in PEDOT by Olga Bubnova and others. Nature Materials10, pp.429–433, abstract: oxidation-level control and low thermal conductivity
Material selection should use measured properties across the actual temperature interval and the achievable thermal gradient, not a blanket organic-versus-inorganic ranking. Articles by others on the same topic
There are currently no matching articles.