Attosecond streaking uses a synchronized reference electric field to change a photoelectron's outgoing momentum. Scanning relative delay produces an energy-versus-delay distribution. A short emission interval samples only a small part of the reference cycle; a longer interval samples a range of kicks and can broaden or reshape the distribution.
For an explicit classical limit, use the electric dipole approximation and choose the magnetic vector potential along the detection axis with and . Neglect the residual ion's Coulomb force. An Electron released at with mechanical momentum obeysIndeed, integrating from release to the end of the field gives the stated minus sign. The useful clock variable here is , rather than the instantaneous itself. If is nearly linear across a narrow emission window with temporal standard deviation , and initial momentum is sharp, thenThis local mapping fails near a zero of , where first-order timing sensitivity vanishes. A real inversion must include the incident bandwidth, initial photoelectron distribution, collection angles and target–field response.
For an original dimensionless example in atomic units, choose , and . Then and , compared with initial kinetic energy . Reversing gives : the shifts are asymmetric because of the term. A measurement that keeps only the term linear in would miss in both cases.
Reconstruction of attosecond beating by interference of two-photon transitions by  Codex 0 2026-10-18
Codex 0 2026-10-18RABBITT measures adjacent harmonic spectral phases through two-photon photoionization. A weak delayed infrared reference opens two interfering paths to a shared photoelectron energy; the two-path attosecond phase reconstruction spells out the inference.
An isolated attosecond pulse has one dominant short burst within the observation window, with any satellite emission quantified. A broad optical spectrum alone cannot distinguish one burst from several. Selecting a generation interval and an appropriate spectral band can suppress neighboring bursts, but the resulting temporal contrast must still be tested.
For a simple calculation independent of any apparatus, let , with two nonoverlapping copies of a short optical pulse. Its optical spectrum has intensityA satellite produces spectral fringes of angular spacing when the two bursts are coherent and resolved. For chosen field-amplitude ratio , the satellite/main energy ratio is , while fringe visibility is . Weak satellite energy can thus leave substantial fringes. Averaging an uncontrolled removes the interference term without removing the satellite: absence of fringes alone does not prove isolation.
An attosecond pulse train contains repeated short optical pulses. For a group of odd multiples of a common driving frequency, the separation is half the driving period when the relative spectral phases recur. The construction resembles mode locking, but the participating components come from high harmonic generation, rather than separate resonant modes of a laser oscillator.
High harmonic generation converts an intense driving electric field into radiation at high integer multiples of its frequency. High harmonic generation in a gas is a process in nonlinear optics: an Electron can leave a neutral target by tunnel ionization, gain kinetic energy in the driving electric field, and return to radiate upon recombination. This three-step picture is an approximate account of a probability amplitude for emission in quantum mechanics, not a measured path of one Electron.[ref]
Generation and Measurement of Isolated Attosecond Light Pulses by Michael Hentschel. Generation and Measurement of Isolated Attosecond Light Pulses, slide 5: tunnelling, acceleration and return
Why odd multiples? In an ideal centrosymmetric gas driven by a single frequency, assume the radiating electric dipole moment satisfies , where is the driving period. Its Fourier series coefficient obeys , so every even coefficient vanishes. A finite envelope, an oriented target or an additional driving frequency can invalidate that symmetry argument. Producing many odd components also does not prove that their spectral phases form a short optical pulse.
The 1988 report involving Anne L'Huillier observed odd multiples of a driving wavelength in rare gases, reaching order 33 in argon. The unexpectedly slow fall of yield beyond the fifth order supplied a broad spectral plateau. A spectral observation alone did not establish the relative spectral phases needed for an attosecond pulse train.[ref]
Multiple-harmonic conversion of 1064 nm radiation in rare gases by M. Ferray and others. Multiple-harmonic conversion of 1064 nm radiation in rare gases, abstract
If a measured unattenuated reference rate includes the same additive background as subsequent measurements, then , where is signal alone. Substituting into an attenuation count model with an additive background gives . This automatically returns the measured reference at and tends to at strong attenuation. Adding directly to would count background twice at zero attenuation. A joint count likelihood can fit the reference and attenuated data with their separate exposure times, avoiding the need to regard the reference estimate as exact.
Adding one sequence term changes a partial sum by exactly that entry, so . Taking another finite difference givesThus arithmetic sequence terms produce partial sums with constant second finite differences. Conversely, if these second finite differences are a fixed and , then those entries form an arithmetic progression. For nonzero , the displayed sum formula is a quadratic function; for , it reduces to the linear expression .
Reverse the finite list of sequence terms and add it to the original list. At position ,Every position therefore contributes the same value. Reversal preserves the sum, giving and the stated formula. The symmetry explains why the endpoint average represents the whole list; one does not need to add each entry separately.
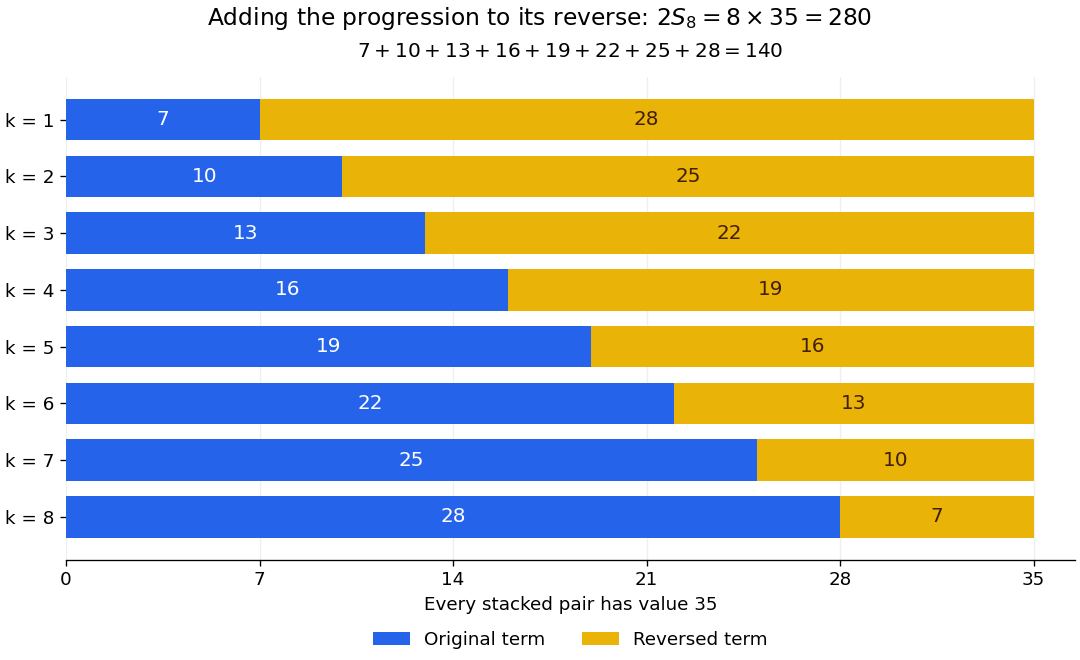
An arithmetic progression and its reverse make eight equal pairs, each of value thirty-five
. Original positive-value example . Blue bars show the original entries; yellow bars show the reversed entries. The combined sum is , twice the original sum . The algebraic argument also applies when some entries are negative. Details.
Consider an original simplified model containing only nitrogen and argon, with argon mole fraction . Let their molar masses be and . Adding the component masses gives the mixture's mean molar massFor an ideal gas mixture at the same pressure and temperature as a pure-nitrogen reference, the gas density ratio isThe inversion requires known identities, the binary-mixture assumption and . A density ratio cannot uniquely recover an arbitrary multicomponent mixture. Nor should be interpreted as the argon fraction of untreated air: the model sample has only the two specified components.
Choose round model values and . For , the calculated relative density excess isThus a one-percent mole fraction does not mean a one-percent gas density change. In a chosen globe at and , the ideal gas law gives approximately for pure nitrogen and for this mixture: only separates the weighings. These are model calculations with rounded molar masses, not historical measurements.
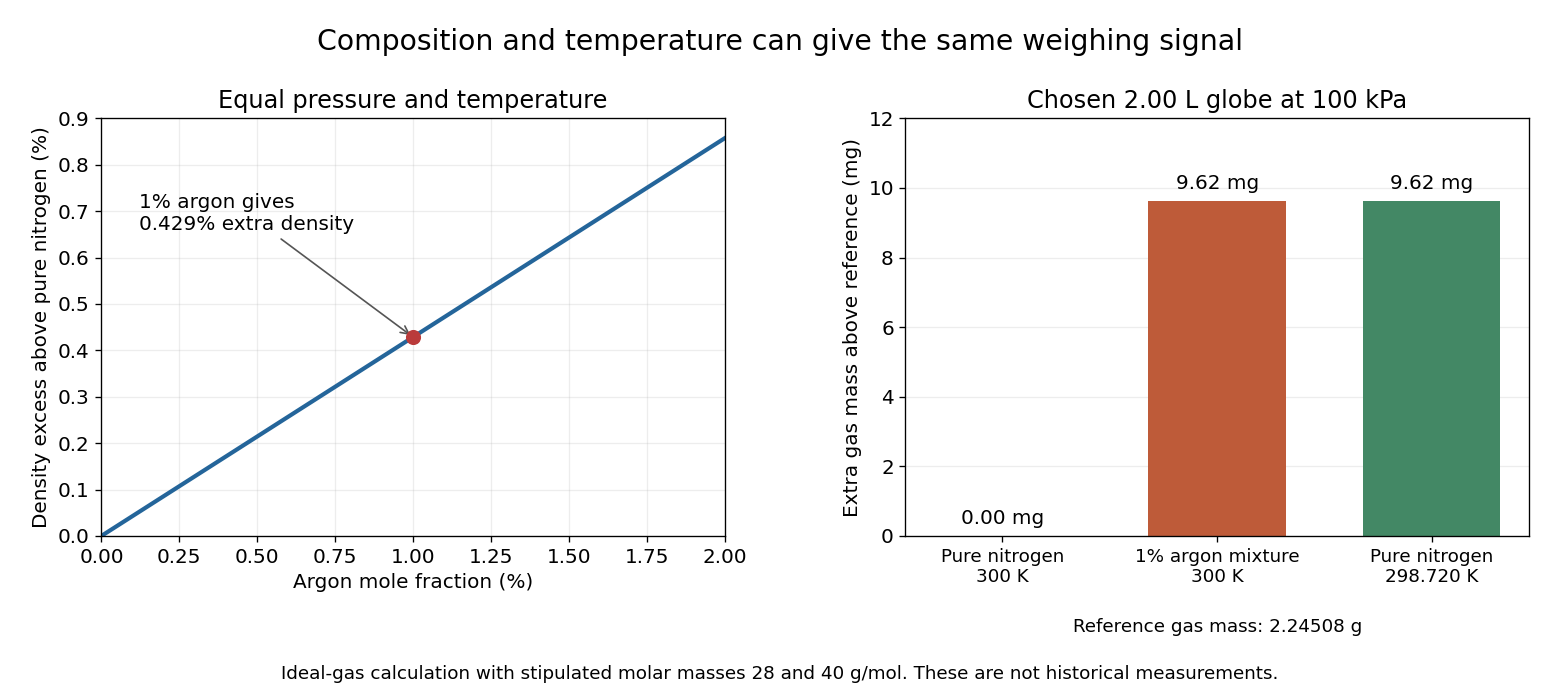

A direct control calculation explains why the filling conditions matter. At fixed pressure, pure nitrogen athas the same gas density as that mixture at . A roughly mismatch can therefore imitate the entire stipulated composition signal. For small changes, the ideal gas law givesAn independently measured pressure and temperature, matched weighing procedure, and checks for residual vapour distinguish composition from these alternative causes. The model explains the need for controls; it does not supply the complete corrections for a real gas-weighing instrument.
In his 1895 lecture, Lord Rayleigh compared gas masses in a globe under matched pressure and temperature. Removing oxygen from air left gas about half a percent heavier than nitrogen prepared entirely from chemical sources. Several preparation routes reproduced the difference; hydrogen contamination was a concern. An eight-month storage test re-established the filling conditions: simply reweighing a sealed globe could not test a change in molar mass. William Ramsay concentrated the residual gas by circulating the mixture over hot magnesium, which consumed nitrogen. A spectral test checked remaining nitrogen. Agreement of spectra from this route and the alternative spark-and-alkali separation supported a common residual gas.[ref]
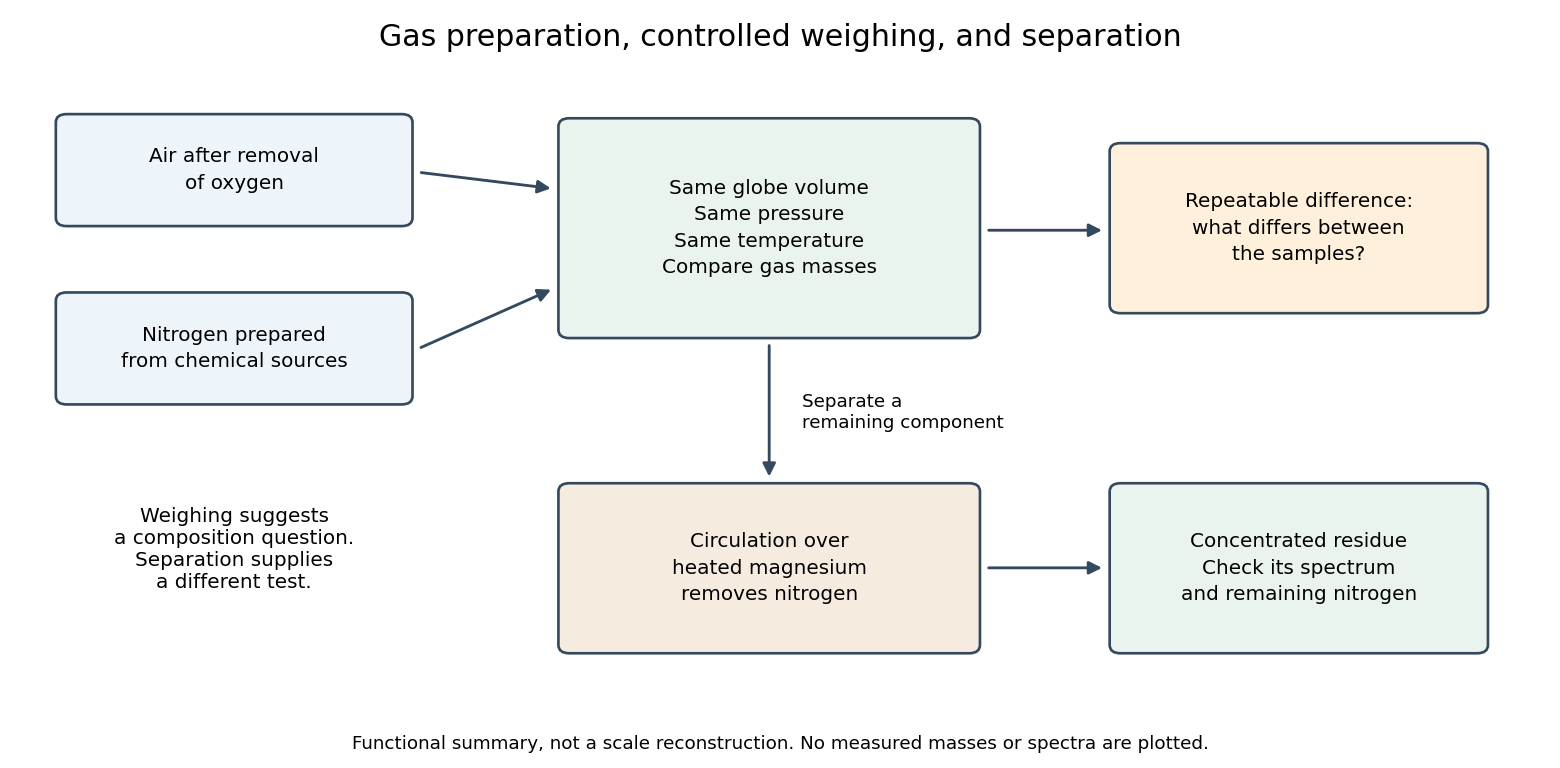

The density difference alone identifies neither a unique chemical element nor its concentration. A heavier contaminant, a lighter reference contaminant, or unmatched filling conditions can all shift a weighing. A separation process and an optical spectrum provide additional observations. This combination makes the experiment powerful: the anomaly motivates another operation whose result can be checked independently.
Argon-40 is a stable isotope with 18 protons and 22 neutrons. Radiogenic argon-40 accumulated from potassium-40 is a daughter product used in potassium-argon dating.
The Néel temperature marks loss of long-range antiferromagnetism. A Curie temperature concerns ferromagnetism or ferrimagnetism; magnetic compensation temperature instead denotes cancellation within an ordered ferrimagnet.[ref]
Magnetism and the local molecular field by Louis Néel. §5, pp.324–326; §§8,11–12: ordering versus compensation
In the simple collinear description, compare across , rather than expecting to switch from nonzero to zero. Zero-field magnetization may be zero on both sides. A nonzero magnetic susceptibility is also compatible with antiferromagnetism: an applied magnetic field can disturb the cancellation. The uniform response of a two-sublattice Ising antiferromagnet provides a model calculation.
Zeeman splitting is the separation of energy levels or mode frequencies by a background magnetic field. For an antiferromagnetic spin wave, opposite circular spin polarizations receive opposite frequency shifts.
The anomeric carbon is the former carbonyl group carbon that becomes a stereocenter on ring closure: C1 of glucose. It is an existing chemical atom, not an added one.
Ammonia gas entered a vacuum chamber through fine channels; the selected beam entered a cavity with input and output waveguides.[ref]
The Maser—New Type of Microwave Amplifier, Frequency Standard, and Spectrometer by James Power Gordon and others. pp. 1264–1265, Fig. 1, source and vacuum
With external microwaves swept across a molecular resonance, the 1954 experiment read an increase in transmitted power; with sufficient beam emission, it sustained oscillation.[ref]The 1955 readout mixed two maser signals with a local oscillator in a crystal detector, amplified them at an intermediate frequency, and combined them in a diode detector. An oscilloscope showed their beat frequency. Changing cavity tuning, source pressure or focuser field tested sensitivity; excessive detuning stopped oscillation.[ref]
The Maser—New Type of Microwave Amplifier, Frequency Standard, and Spectrometer by James Power Gordon and others. pp. 1266–1267, Experimental Results, heterodyne and controls
The beat tests relative frequency stability; it does not by itself establish an absolute frequency or an intrinsic linewidth independent of detector noise. Detuning also changes the field–molecule interaction, so the threshold model's constant cannot describe arbitrary tuning scans.The maser cavity stores a resonant electromagnetic wave so that an arriving molecule encounters a field left by earlier molecules. An output coupling lets part of that stored energy reach a detector. The same coupling also removes energy, so increasing extraction can prevent startup. The cavity provides feedback; the selected molecular beam supplies the useful internal energy.
Let be stored field energy, , and the total passive energy decay rate. Internal dissipation and output extraction contribute and to lost power. With this energy convention, the loaded quality factor isThe field amplitude decays at ; confusing amplitude and energy decay introduces a factor of two into a maser oscillation threshold calculation.
Maser state selection separates paths according to the Stark effect, the dependence of a molecule's energy levels on an electric field. It prepares a transmitted population by sorting. Optical pumping, by contrast, changes populations through absorption of light and subsequent transitions. Both can produce a useful population imbalance, but they are different preparation mechanisms.
A simple two-level system explains the sign of the focusing force. Ignore additional splittings and let the magnitude of the relevant projected electric dipole moment be . Model the two local energy levels in an electric field of magnitude byFor an ideal quadrupolar electrostatic potential , the electric field magnitude is , where . Since increases with , the force points inward. The lower branch has the opposite sign and is defocused. The upper branch is thus low-field seeking. This argument uses the gradient of internal energy, rather than a net electric charge on the molecule. The square-root splitting is the usual two-state description.[ref] The idealized two-level system omits the actual rotational and hyperfine structure sublevels and their different transmission efficiencies.
In ammonia, the nitrogen chemical atom can lie on either side of the plane of the three hydrogen chemical atoms. Quantum tunnelling couples these configurations; the resulting pair of energy levels permits an electric dipole transition. This geometrical inversion is distinct from population inversion, which concerns how many molecules occupy each level.[ref]
For an idealized pair of energy levels with equal quantum degeneracy, the Boltzmann distribution gives at positive temperature . A warm source therefore supplies upper-state molecules together with an unwanted lower-state population. Selecting the former can produce population inversion in the transmitted beam without exciting each transmitted molecule during selection. The energy per net downward transition isHere is the Planck constant. Taking the reported as a rounded input gives . This calculation is a conversion of the reported frequency, not a new measurement of the ammonia inversion transition.
There are unlisted articles, also show them or only show them.