Source paper: www.whatdotheyknow.com/request/oxford_physics_past_papers_2/response/2340696/attach/9/Physics%20Papers%202020.pdf?cookie_passthrough=1 (ordinary sitting, 8 June 2021; the public bundle's filename does not give this paper's examination year).
Notation. The source uses for both the hypothetical dry surface pressure and the actual surface pressure after evaporation. Distinguish them as and , respectively, and interpret the specified pressure thickness as fixed. This conserves the original hydrogen inventory and permits to vary. Reading both occurrences as one fixed number would be inconsistent with adding water vapor to a closed atmospheric column mass budget.
Let denote the saturation pressure of water, let be the mole fraction of water vapor in the mixed layer, and let be the molar masses of hydrogen and water. Surface phase equilibrium and the ideal gas law giveBecause the layer has constant temperature, its relative humidity isThus every level strictly above the surface is subsaturated: hydrostatic balance makes , whereas the saturation pressure stays constant. The result does not require a dilute water vapor approximation.
The Clausius-Clapeyron relation, neglecting the specific volume of liquid water and treating the water vapor as an ideal gas, givesHere are the triple point values, is the specific latent heat, and is the molar gas constant. All temperatures in these expressions are absolute. As throughout the question, this is a constant-latent heat, ideal gas model, not an extrapolation valid through the real critical point of water.
For a well-mixed ideal gas mixture, its mean molar mass and water vapor mass fraction areBy hydrostatic balance, the mixed layer has total mass per unit area , of which is water vapor. The remaining atmosphere contains no water vapor. Consequently conservation of hydrogen mass givesEquivalently the requested quadratic equation isFor each , calculate , take the positive root of this quadratic equation, and retain it only if and . The last condition leaves a nonempty dry layer. In particular the dry constituent's surface partial pressure is not generally : measures its column weight, and the hydrogen and water vapor have different molar masses.
A convenient parameter is the water vapor mole fraction itself. The mass conservation calculation yieldsBoth functions increase for . At the endpoint,Therefore the physically admissible hydrogen–water vapor mixture requiresBeyond this bound, the formal positive quadratic equation root requires , equivalently a negative hydrogen partial pressure. It is the physical constraints, rather than loss of real roots, that end the solution branch. For a concrete example, put in consistent pressure units, , and . The positive root of is about , giving , which is impossible.
The limiting temperature is obtained from :This finite limit exists above if . The upper qualification matters mathematically: the stipulated constant-latent heat formula has a finite limiting saturation pressure as , so for an arbitrarily large unspecified the printed assertion of a finite breakdown temperature is not unconditional. For a concrete formal counterexample, choose : with the usual triple-point constants the model has , so it never reaches the proposed inventory limit. This is a counterexample inside the stipulated equations, not a physically credible high-pressure ideal gas ocean. Actual liquid water also ceases to exist above its critical point, before such an extrapolation would make sense.
Physically, the imposed finite-pressure-thickness layer can hold no more than of water vapor per unit area. As , it expels all its hydrogen into the dry upper layer. A still larger surface saturation pressure cannot coexist with this geometry. The layer must deepen, the temperature profile must change, or the assumed phase equilibrium must fail. If , the additional restriction can also exclude the low-temperature end of the branch.
At the interface the pressure is continuous. Immediately below it the temperature is and mean molar mass is ; immediately above it the dry hydrogen has temperature . The ideal gas law therefore givesAn infinitesimal interchange is unstable to convection when the lower fluid is less dense than the upper fluid. HenceEquality gives neutral interfacial buoyancy; reversing the inequality gives a stable density jump. This is an interfacial criterion, not a claim that the whole dry upper atmosphere is stable. Its vertical temperature profile has not been specified. Also, , so infinitesimal displacement at the interface initially involves no condensation or release of latent heat.
There are two competing effects. Increasing directly reduces the lower density, favouring convection. Increasing the mole fraction of heavy water vapor increases its mean molar mass, opposing convection. With , the criterion is approximately . With , it tends to : substantial surface heating need not overcome the compositional stabilization in hydrogen.
For a specified , solve on the admissible branch to locate the transitions. Its derivative is , so there is no universal monotone trend: rapid growth of the saturation pressure can suppress an instability that was present at lower . Without numerical parameter values, neither the number of crossings nor a unique interval of unstable temperatures can be asserted.
Write , where is the specific gas constant and the specific heat capacity at constant pressure. Conservation of potential temperature on a dry adiabatic process givesLet be the absorbed stellar irradiance, and let , with the Stefan-Boltzmann constant. The transparent gas contributes no thermal radiation. For a cloud with emissivity , Kirchhoff's law of thermal radiation gives thermal absorptivity ; assume thermal transmissivity and negligible thermal reflection, as in the usual one-layer grey body model. The outgoing radiant flux is the transmitted surface emission plus upward cloud emission:ThusNo factor of four is needed: is the incident irradiance of the specified column, rather than a stellar-beam irradiance that still needs a spherical average.
For fixed , increasing monotonically warms the ground when . At , ; at , and . A cloud at the surface, , produces no such warming. Comparing with a genuinely cloud-free column also requires including its different albedo: relative to , the ratio is . Reflection can outweigh the greenhouse effect.
The governing balance here is the whole-column radiation budget. Imposing an additional purely radiative surface balance would incorrectly remove the convective heat transfer that the prescribed dry adiabatic process may require.
The cloud absorbs from below and emits from each face. It absorbs no stellar radiation. Its net radiative heating per unit area is thereforeFor , a cloud with warms in the absence of other energy transfers; one with cools. For the thin pressure thickness , its initial temperature tendency is approximately if its sensible heat capacity dominates. Latent heat and changing condensate modify that conversion from heating to temperature change, but not the sign of the radiative input.
With fixed, pure radiative equilibrium requiresThis equals the ambient dry-adiabatic process temperature precisely whenFor ordinary dry air, , so the ratio is about . If , the cloud exchanges no thermal radiation and its radiation budget does not select any equilibrium temperature.
At fixed ground temperature, warming the cloud increases its downward radiant flux , giving a positive contribution to the ground's radiative heating. That is the immediate radiative effect. A self-consistent final answer must also remove the convective heat transfer used to pin the original cloud to the dry adiabatic process.
For pure radiative equilibrium of both bodies, with no net nonradiative energy exchange, their two balances areFor this givesThe limit gives the selected limiting cloud temperature; at exactly , only is fixed radiatively. The maximum greenhouse effect at fixed occurs at :The pinned dry-adiabatic process case instead has maximum factor . It exceeds for a high, cold cloud with , equals it at the level found in part b, and is smaller for a low, warm cloud.
In particular, for the final purely radiative ground is cooler than the pinned solution, even though a warmer cloud increases downward radiation at fixed . To see why these statements are compatible, let be the net upward nonradiative energy transfer from the ground to the cloud in the pinned state. Its conservation of energy equation requiresFor the cold cloud, : maintaining it on the assumed dry adiabatic process requires removing its net radiative heating and returning energy elsewhere. Setting changes that energy redistribution. It is therefore incorrect to infer the final ground temperature by changing only the downward radiant flux. Indeed the final cloud is warmer than the pinned one for and , while the final ground is cooler. At the cloud temperature is in both whole-column equilibria.
Fixed cloud properties are an artificial constraint. Warming a saturated cloud increases the saturation pressure, tending to evaporate its cloud droplets; the released water vapor, changing latent heat budget and altered buoyancy can change its altitude and emissivity. Cooling favours condensation and potentially atmospheric precipitation. A warm perturbation that survives evaporation can rise by convection, but neither a unique vertical displacement nor survival of the cloud follows without moisture supply and an environmental temperature profile. Finally, pure radiative equilibrium of the two bodies does not require the intervening transparent gas to remain on the original dry adiabatic process; imposing that extra constraint is generally inconsistent except at the matching level in part b.
Before condensation, assume a closed parcel with fixed atmospheric mixing ratio, constant specific heat capacities, and negligible irreversible heating. The first law of thermodynamics for a dry adiabatic process isThe parcel remains in approximate pressure equilibrium with a hydrostatic environment. With the standard approximation that parcel and environmental densities are close, , henceThis is the dry adiabatic lapse rate, about for air. More precisely the environmental hydrostatic balance gives ; the familiar constant dry adiabatic lapse rate uses their ratio close to one.
Let be the parcel's water vapor partial pressure. Fixed mole fraction before condensation means is constant. Its dew point is defined by , where is the saturation pressure. The Clausius-Clapeyron relation givesThe last approximation uses hydrostatic balance, the ideal gas law, and an environmental temperature close to the parcel's. Rearrangement yieldsFor a modest initial dew-point depression, in absolute temperature, soWith , , and , . This dew point scale is much longer than the atmospheric pressure scale height.
The exponential function is an approximation, not the exact consequence of a dry adiabatic process. Retaining gives and the useful comparisonIt also shows explicitly that expansion lowers the dew point even before any water vapor condenses.
At the lifting condensation level, the parcel temperature first equals its dew point. For , the first-order Taylor expansion gives . Equating this with the dry-adiabatic process result givesNear terrestrial surface temperatures, –, whereas . ConsequentlyUse absolute temperature for . The temperature difference can be evaluated in kelvins or degrees Celsius, whose increments agree. The coefficient is an approximate near-surface terrestrial value, not independent of composition or ambient conditions for all atmospheres.
The dew-point depression is , soKeeping , and gives approximately , consistent with the rounded estimate.
The real cloud base can differ because entrainment changes the parcel's atmospheric mixing ratio and temperature, surface humidity varies, and the environmental pressure profile need not match the assumed parcel profile. Finite cloud-droplet activation requires some atmospheric supersaturation, so the first visible cloud droplets need not occur exactly at the thermodynamic lifting condensation level. A parcel must also actually be lifted that far; environmental static stability can prevent this. The constant-latent heat and first-order Taylor expansion approximations produce smaller numerical differences.
A rising parcel cools, lowering the saturation pressure. Once its water vapor supply exceeds that value, atmospheric supersaturation develops. Homogeneous nucleation of pure water is strongly inhibited at the small atmospheric supersaturations typical of clouds; existing aerosol particles provide cloud condensation nuclei. Their dry sizes and composition, together with the parcel's ascent rate, determine how many cloud droplets activate.
Köhler theory combines the Kelvin equation, which raises equilibrium vapor pressure over a curved surface, with Raoult's law, which lowers it for a chemical solution. In a dilute diameter convention, with dry diameter and wet diameter ,Here is atmospheric supersaturation, is surface tension, and measures aerosol hygroscopicity, not the dry-adiabatic process exponent. The maximum of the Köhler curve is the critical supersaturation. Larger or more hygroscopic particles generally have lower thresholds. Cloud-droplet activation requires overcoming that maximum; total aerosol number is not the activated number.
Given an observed aerosol number size distribution for composition classes , first assign each class a hygroscopicity and compute its critical supersaturation. If the parcel reaches maximum atmospheric supersaturation , the equilibrium-threshold estimate isFor each fitted lognormal distribution, this is its upper-tail integral; it can be evaluated analytically with an error function or numerically from measured bins.
The value must be calculated, not guessed from the aerosol distribution alone. Prescribe parcel upward velocity , initial pressure, temperature and humidity, then integrate expansion cooling, latent heat release, conservation of total water, and diffusional cloud droplet growth. Schematically,where , includes water vapor diffusion and thermal conduction, and is liquid mass fraction. Rising motion produces atmospheric supersaturation; growing particles consume it. Their competition selects the peak and which particles cross their activation barriers. Assume a well-mixed closed parcel, liquid water, soluble spherical particles, specified mixing state, and negligible collision-coalescence and fallout during activation. Slow kinetic growth, weakly soluble particles or entrainment require a more detailed treatment than the threshold integral.
The optical telescope supplies collecting area and spatial selection, the spectral selector supplies a passband, and the photodetector converts received radiant flux into a measured signal. For an extended source, a useful schematic photon count iswhere is the etendue, the integration time, the net transmission and quantum efficiency, and the spectral radiance. An illustrative independent-noise model givesHere and denote background and dark counts, and is readout standard deviation. This makes the roles of the three components explicit.
A larger optical telescope collects more photons at fixed angular pixel size and improves the diffraction-limited resolution. Its limits include optical aberrations, alignment, launch size, stray light and pointing. Conservation of etendue constrains simultaneous collecting area and angular acceptance. Increasing spatial resolution by narrowing a pixel's solid angle reduces its photons.
A narrower spectral passband or higher spectral resolving power separates diagnostic features and rejects unwanted background, but usually reduces photons per channel and hence signal-to-noise ratio. Selector transmission, leakage, slit width, detector format and the required time cadence limit the trade. A wider band helps only insofar as it adds useful signal rather than mostly background.
The photodetector's quantum efficiency, dark current, read noise, dynamic range and response time determine conversion losses and added noise. Cooling can suppress thermal background and dark current, but cannot remove photon shot noise. Longer integration improves a stationary signal's signal-to-noise ratio until motion, saturation, drift or required cadence becomes limiting.
A geostationary orbit provides continuous viewing of approximately the same terrestrial region, favouring fast cloud evolution, storm tracking and the diurnal cycle. The large range makes fine spatial resolution demanding, high latitudes have poor viewing geometry, and a single platform has no global coverage. A polar orbit gives much smaller range and broad latitude coverage as Earth rotates beneath it, favouring detailed global mapping; any one location is sampled intermittently. A Sun-synchronous orbit can hold approximately fixed local solar time for comparing observations, but that sampling can miss much of the diurnal evolution. The science therefore sets a trade between spatial coverage, spatial resolution and temporal sampling.
The Moon's very slow, tidally locked rotation makes a lunar stationary orbit fundamentally problematic. Let its orbital angular velocity around Earth be , approximately also its spin rate. For lunar mass , terrestrial mass , and separation , the two-body estimates giveThus lies outside the lunar Hill sphere. Earth's tidal perturbations prevent the desired simple stable, lunar-centred stationary orbit. This is stronger than merely saying that the required orbit is high; specially maintained three-body orbits are a different construction.
For a prograde equatorial synchronous circular orbit, equate gravitational acceleration and centripetal acceleration. With planetary radius , , and rotation period ,The tabulated is a gravitational acceleration; its printed unit must be read as , rather than . Using givesThe orbital altitude is measured from the surface, rather than the centre.
At the visible horizon, the line of sight is tangent to the spherical surface. The limiting central angle satisfies . The visible spherical cap has area , givingAbout of the whole surface is geometrically visible, with . This is a surface-area fraction, not an apparent-disc area ratio. Useful imaging near the horizon is further limited by foreshortening and the long atmospheric path.
Interpret the stated detector width as one square spatial sample. At the point directly below the spacecraft, the small-angle approximation gives pixel angular width . ThusThere is a definition error in the source: the usual focal ratio, or f-number, divides focal length by the entrance-aperture diameter , whereas the printed parenthesis divides by detector width . Reporting both avoids silently changing the question:The actual optical design is therefore approximately f/1.36, a fast optical telescope, not an optically slow f/34000 instrument. Such a focal ratio is demanding but possible in principle: optical aberrations, obscuration, field coverage, stray light and alignment need careful design. The single-sample angular width is . Spatial sampling alone does not guarantee true resolving power; diffraction, pointing and signal-to-noise ratio also matter. At large viewing angles, the same angular pixel covers a larger, distorted surface footprint. If the detector is literally one element, scanning is additionally needed to form a map.
A calibrated multispectral filter radiometer is a natural choice for rapid thermal mapping: a few selected bands provide higher photon throughput and faster imaging than spreading the light over many spectrometer channels. Several bands can help separate temperature, dust emissivity and atmospheric effects. A spectrometer would be justified if identifying composition or resolving spectral structure were a central additional objective; one broadband radiance alone cannot generally determine both temperature and unknown emissivity.
Thermal infrared radiation is preferable to reflected visible light for measuring temperature. The Rayleigh criterion setsA band near is therefore a reasonable compromise between useful planetary thermal emission and the required diffraction-limited resolution. At that wavelength, the nominal surface Rayleigh criterion separation is about ; at it is about and fails the target. The exact bands must avoid or model strong atmospheric absorption and account for the dust spectrum. The sampling pitch is still not a guarantee of faithful reconstruction of arbitrary features: detector sampling and the point spread function must be considered together.
Take a Northern-Hemisphere cyclonic vortex, with positive relative vorticity. For a fixed-depth incompressible layer, conservation of absolute vorticity givesThe anticlockwise flow on the east side moves parcels northward, increasing their planetary vorticity and creating negative relative vorticity anomalies. On the west side it moves parcels southward and creates positive relative vorticity anomalies. Initially,so the positive anomaly grows on the western flank while the eastern flank loses positive vorticity. The cyclonic pattern consequently shifts westward. The induced anomalies themselves drive meridional flow and further relative vorticity anomalies, transmitting a Rossby wave pattern through the surrounding fluid. The restoring process is this exchange between planetary vorticity and relative vorticity, rather than a parcel executing a permanently westward translation.
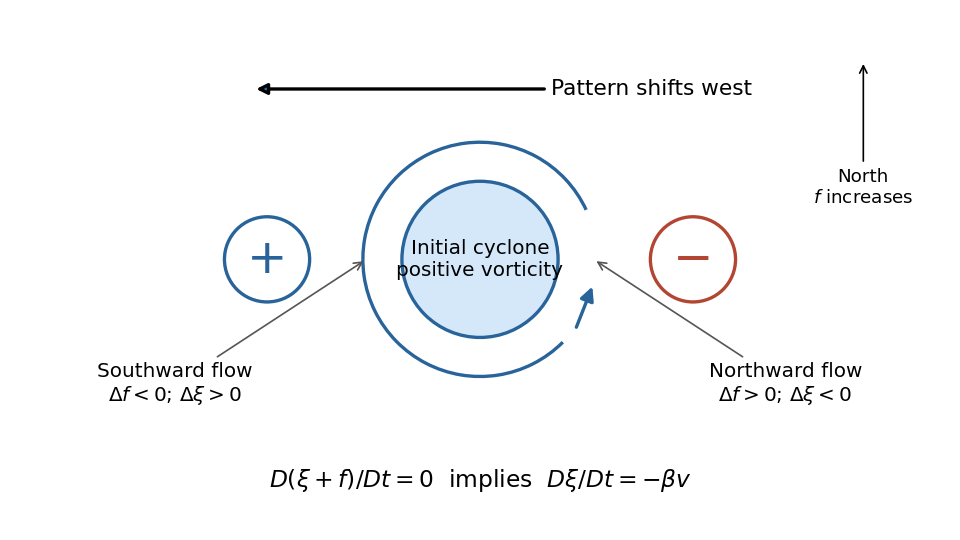
The sketch shows the initial tendency, with the generated signs separated from the initial positive core. An isolated disturbance contains many wavevectors and disperses; westward phase velocity does not imply that all its wave energy travels westward. A Southern-Hemisphere cyclonic vortex reverses the signs of the initial and generated relative vorticities, while the same beta plane mechanism remains.
Write , , and , with constant. Discarding products of perturbations in the vorticity equation givesIntroduce the streamfunction conventionIt enforces incompressibility identically. The linear partial differential equation isFor the plane wave , put . Substitution yieldsThe first term is the Doppler shift by the background flow; the second is the intrinsic Rossby wave frequency. The source's convention selects representatives of real waves, rather than making this expression nonnegative for arbitrary . For and , nonzero positive frequency requires ; the conjugate mode has opposite signs of and describes the same real field.
For and fixed , completing the square in the dispersion relation givesThese Rossby-wave isofrequency circles lie in the half-plane and touch the origin, where the dispersion relation is undefined. Their radii decrease as frequency increases. The zero-frequency line is .
The group velocity is normal to the constant-frequency curves, toward increasing frequency:At , the group velocity is eastward; close to it is westward. For the positive-frequency circles its arrows point inward toward the circle centre. Its meridional component is southward in and northward in .
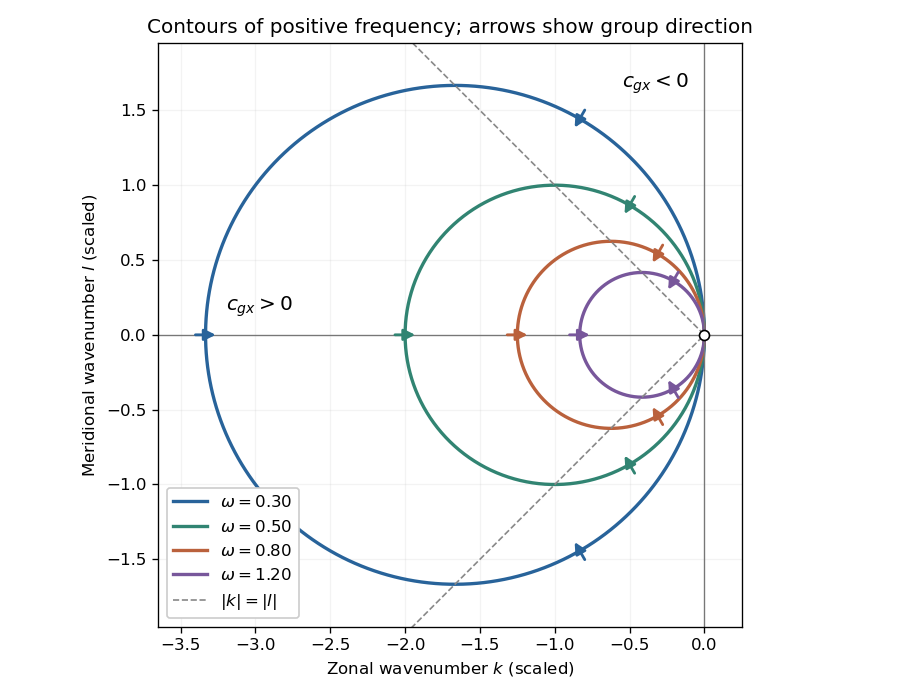
Positive-frequency Rossby-wave isofrequency circles and group velocity directions in dimensionless wavenumber coordinates
. Details. For , the zonal phase velocity, meaning propagation at fixed , isIt is westward everywhere it is defined. The zonal group velocity is eastward for , westward for , and zero on . There is no region of eastward zonal phase velocity. At , is undefined, though its continuous limiting expression is westward and . Using instead the normal-to-wavecrest phase velocity vector gives ; its zonal component is also westward for , but is not the same scalar as .
For a nonzero zonal wavenumber , stationarity requiresA real propagating solution therefore requires a westerly . For there are two meridional wavenumbers:The source's assertion of two stationary solutions needs these qualifications: at they coincide, and at there is no real meridionally propagating solution. For example gives . Modes with are a separate zonally invariant degeneracy and do not have a defined zonal phase velocity.
Adding to the zonal group velocity and imposing stationarity givesThus a localized midlatitude disturbance radiates stationary Rossby wave activity downstream, along one poleward and one equatorward branch. For in the Northern Hemisphere, gives the northeastward branch and the southeastward branch. With strictly constant , these wave rays are straight. Changing latitude cannot bend them within that constant-coefficient model.
To discuss a planet, extend it locally to slowly varying and possibly . The conserved zonal wavenumber in a locally zonally uniform medium then hasFor constant and northward propagation in the Northern Hemisphere, decreasing reduces until : the wave ray becomes zonal at a turning latitude and can refract equatorward. The equatorward branch initially encounters larger allowed and becomes more meridional. This local midlatitude description eventually needs replacement near the equator or wherever the background varies rapidly.
Orographic forcing by a mountain range or persistent spatially localized heating can supply such a disturbance. Its steady forcing selects the ground-stationary part of the response. The corresponding local total wavelength isFor fixed it increases toward the pole as decreases. Locally the zonal integer scale has upper bound , so fewer planetary-scale zonal waves fit around higher-latitude circles. This is not an unconditional trend in actual weather: changing , its curvature, stratification and the forcing spectrum can change the dominant Rossby wave wavelengths.
The first equation expresses horizontal incompressibility. The other two express steady balance of the Coriolis force, a geopotential gradient, linear drag and a prescribed zonal acceleration ; nonlinear advection has been neglected. The parameter is an inverse drag time, so the frictional acceleration is . On the equatorial beta plane, .
Use the streamfunction conventionTake of the meridional momentum equation minus of the zonal one. The mixed geopotential derivatives cancel, andHorizontal incompressibility removes the first term, leavingThe right side is the vertical curl of the imposed acceleration, with units . The left side balances planetary vorticity advection and frictional removal of relative vorticity. The streamfunction has units , since it describes horizontal velocity, rather than depth-integrated volume flux.
Put . With , Sverdrup balance givesAt an impermeable eastern wall, . Continuity impliesEquivalently,satisfies the impermeability condition with the boundary streamfunction set to zero.
At a second wall , this solution has , generally nonzero. A useful integral proof of the obstruction isfor two impermeable walls, whereas the proposed interior gives , which varies with . Friction or another departure from the inviscid model is needed for a return flow that closes the circulation.
Seek , with . The ordinary differential equation isIts constant particular solution and characteristic exponents areBoth are positive; the two homogeneous solutions are and . Their product satisfies . At small ,For the rectangular basin, choose zero streamfunction on its connected impermeable boundary. The factor already gives zero at . Enforcing yields the exact resultwhereThe narrow Stommel boundary layer approximation requiresThen is negligible, and , givingIt is an asymptotic formula: at the remaining mismatch is of order . Expanding the eastern exponential as well gives the familiar leading Sverdrup balance interior plus western correction,Printed inequality. The original PDF explicitly has as well as . The first sign is reversed for the requested small-friction limit. This can also be disproved directly: if and , the printed approximate bracket at the western wall is , while at the eastern wall it is . The latter is of the same order as the retained basin-scale signal, violating the boundary condition at leading order. The exact expression above remains available without imposing the erroneous inequalities.
The streamlines are contours of . Since , the exact streamfunction is negative inside the rectangle and zero on its perimeter. It has one interior minimum, with closed anticlockwise streamlines: a broad northward interior flow returns southward along the west wall; flow is westward near the north edge and eastward near the south edge. The western parts of the streamlines are closely packed because the western boundary current is much faster.
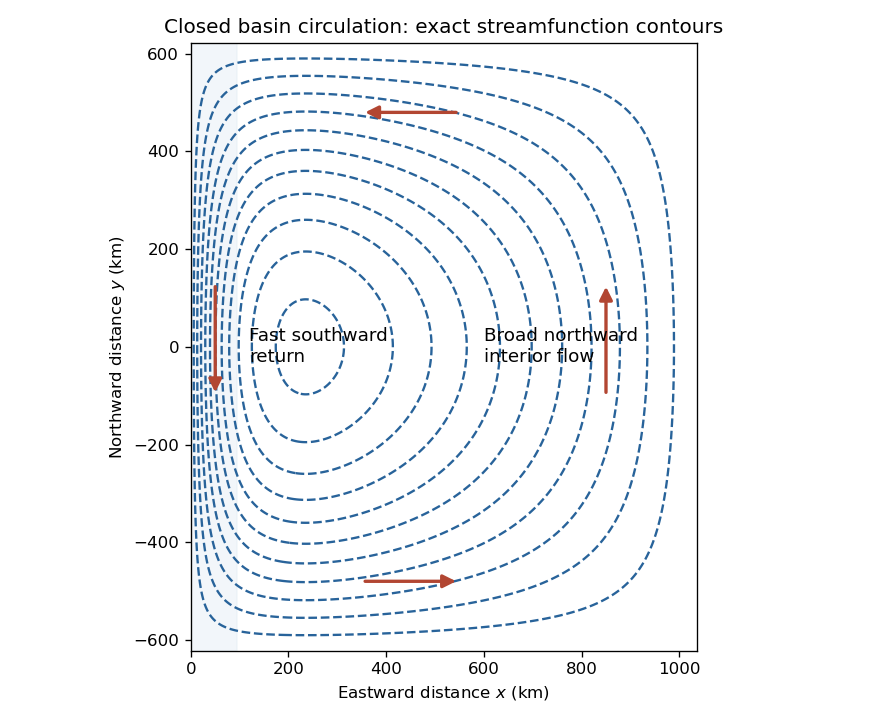


The figure uses the exact ordinary differential equation solution, so it also remains consistent with both wall conditions when the asymptotic scale separation is only moderate. It depicts the stipulated dynamical model, not observed winds or a reconstruction of the source illustration.
Along , differentiating the approximate streamfunction givesin the leading small-friction limit. Hence the velocity is strongly southward at the west wall, crosses zero after a few Stommel boundary layer widths, and approaches a much weaker northward interior value . The leading zero is when .
For plotting or finite-friction evaluation, use the exact derivativeIt increases monotonically from its negative western value to its positive eastern value because . Moreover , as required for a closed basin.
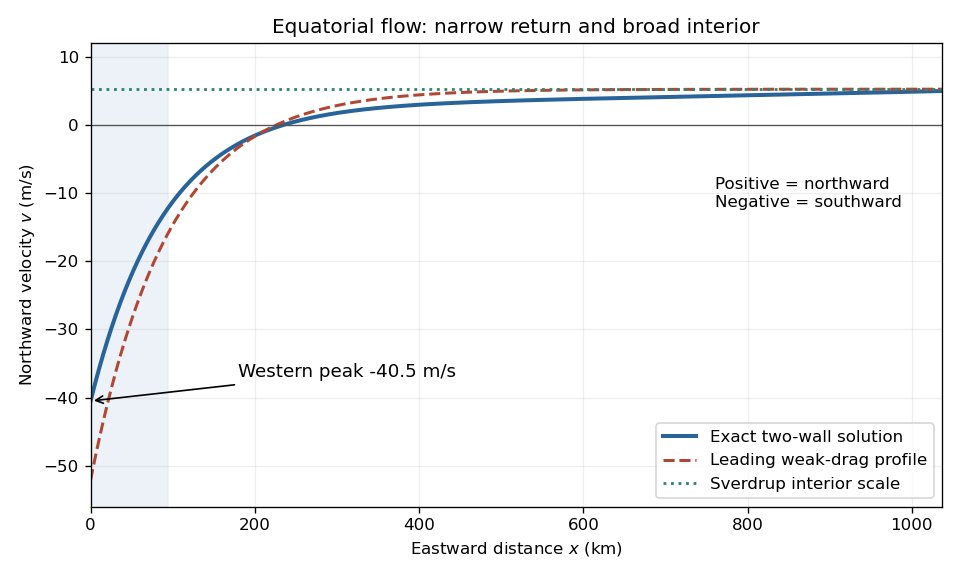
Equatorial northward velocity profile: exact linear-drag solution and leading Stommel boundary layer approximation
. Details. 
Use the positive rotation-rate convention implicit in the northward planetary vorticity gradient. One Pluto day is . At the equator,The width of the western boundary current is thereforeHere is the full meridional scale, and . For these data the exact exponents give , and . The western layer is narrow, but is only marginal. The leading estimates below should therefore be distinguished from evaluation of the exact linear model.
In the open-basin Sverdrup balance approximation,The maximum is at . Evaluating the exact finite-friction solution instead gives its largest northward velocity at the eastern side of the equator, about . Thus the requested scale is roughly northward; the exact model also resolves variation across the open basin.
To return the broad interior transport, the western boundary current has opposite sign and characteristic peakThe leading exponential profile retains the smaller interior offset, . Because is not very small, the exact two-wall solution gives a more accurate linear-model peak:All three evaluations identify an intense southward western boundary current, with peak at , of order tens of metres per second. They are predictions of the stated steady linear barotropic model. Nonlinear advection, stratification and the actual basin geometry could alter them substantially; the calculation does not establish that real Pluto winds attain these values.
Articles by others on the same topic
There are currently no matching articles.