Topics (377k) Articles (391k) Users (410) Discussions (242) Comments (383) Files (13k) New article
Consider isotropic electrons and electron holes with equal density , charges , equal positive charge carrier mobility , and single-species zero-field electrical conductivity . In a transverse magnetic field, opposite Hall conductivity components cancel, while diagonal components add to . Inverting gives and . Its large-field growth is . The total zero-field resistivity is , half the single-species resistivity; confusing these quantities introduces a factor-of-two normalization error.
If one temperature-dependent relaxation scale controls a fixed carrier population and fixed orbital geometry, the magnetoresistance ratio can collapse onto a function of . This is Kohler's rule. For the equal-mobility compensated two-carrier magnetoresistance model, and . Therefore plotting against gives a common straight line of slope . A collapse tests the scaling relation; it does not by itself prove this particular microscopic carrier model. Multiple independently varying scattering times or carrier populations can spoil it.
The Anderson positron track experiment identified a light positively charged particle, now called the Positron, by combining magnetic bending, loss of kinetic energy in lead, and particle range. Each observation answered a different question: bending constrained momentum, the lead supplied a direction of travel, and particle range tested the proposed mass.
Carl David Anderson's The Positive Electron (1933), pp. 491–493, describes the 1932 discovery in a vertical cloud chamber with a magnetic field. A lead plate separated two photographed track segments. The effective viewing depth was along the magnetic field, with transverse diameter: this restricted out-of-plane motion. The photographic readout supplied curvature on both sides. Comparisons with electron tracks under the same conditions constrained ionization; specific ionization was not directly measured for these events. He tested accidental alignment of unrelated tracks and rejected a reversed electron interpretation requiring an increase of kinetic energy in lead. Assuming unit electric charge, the mass bound was about twenty electron masses, rather than an exact mass determination. The paper credits Robert Andrews Millikan with the design and Seth Henry Neddermeyer with assistance.[ref]
The Positive Electron by Carl David Anderson. pp. 491–493, Fig. 1 and charge/mass discussion; p. 494, acknowledgment
Preparation used rapid piston expansion and a water–alcohol mixture in the cloud chamber; cooling permitted droplets to form along ionization trails. A camera photographed these droplets. Initially, expansions occurred at random, so many photographs contained no tracks. Later counter triggering improved the useful yield.[ref]
Carl David Anderson by William Hayward Pickering. Biographical Memoirs: Volume 73; William H. Pickering, Carl David Anderson, pp. 27–28: preparation, photographs and timing
In The Production and Properties of Positrons, his 1936 lecture, Carl David Anderson describes the chamber inside an electromagnet and explains why the lead plate was decisive: after losing kinetic energy, a particle bent more sharply. He describes a proton hypothesis predicting only of particle range, against an observed path longer than . These are historical values from the lecture, not the stipulated example below. The point was the incompatibility of particle range with the momentum inferred from curvature, rather than positive electric charge alone.[ref]
The Production and Properties of Positrons by Carl David Anderson. Nobel Lectures, Physics 1922–1941; pp. 365–366, electromagnet, lead-plate direction test and proton range comparison
Consider lab-neutral parallel wires with stationary positive line density and electron line density . Let wire 1's electrons move at along the wire and wire 2's at . The conventional currents are . In the rest frame of wire 2's electrons, wire 1's transformed total linear charge density is . Its radial electric field is .
A wire-2 electron at rest there feels only an electric force. Transforming its transverse force back to the lab divides it by , and multiplying by the lab electron count per length giveswith positive radial direction away from wire 1. The lab-stationary positive charges feel zero net electric force because wire 1 is neutral in their frame. Equal current directions attract; opposite directions repel. Transforming force on each carrier and then counting carriers in the specified frame avoids an incorrect extra length-contraction factor in force per unit length.
In the plane wave basis of a ring, has matrix elements . Near , degenerate perturbation theory on givesup to corrections from remote states. Thus the avoided crossing gap is to first order when .
For , a parabolic approximation about a potential minimum instead gives a local quantum harmonic oscillator spacing . A local gauge transformation removes the flux from this approximation. Actual ring levels retain exponentially small flux dependence through quantum tunnelling, while nonquadratic corrections to their mean energies are algebraic in .
For reversible quasistatic magnetic circuits with flux linkages , currents and mechanical coordinate , write . The Legendre transform obeys . Thus , while . In a linear reciprocal system numerically, but the variables held fixed in their force derivatives differ. The coenergy formulation includes the effect of electrical sources maintaining the currents; it avoids reversing the sign of the magnetic force by differentiating stored energy under the wrong constraint.
Spatial variations in energy, including crystal defects, can trap a magnetic domain wall. This is magnetic domain-wall pinning. Increasing the applied magnetic field can release the wall into a collective jump.
Prepare two uniform specimens with the same material, direction and , but different deforming lengths . Keep grip engagement, adapters, loading window and measurement configuration equivalent. Determine separately by linear regression with its own displacement intercept. Subtracting the two series equations eliminates the common machine compliance:This is an inverse problem: one length supplies only one equation for two unknowns, while two distinct lengths separate the length-dependent specimen contribution from the constant contribution. In a graph of compliance against length, the slope is and the vertical intercept is . It is the compliance, not , that is linear in .
The dimensional analysis is revealing: , so . For , the ideal model requires . A negative fitted challenges the common-intercept assumptions or the measurements. Two lengths determine two parameters exactly, so they cannot test the assumed straight line; three or more lengths allow regression residuals to reveal departures. Nearly equal lengths amplify slope errors through the small difference . If the actual apparatus compliances differ by , the inferred length slope becomes .
A logical implication holds whenever its premise is false. For partial correctness, an execution that never terminates supplies no final state violating the postcondition.
A log-log plot uses logarithmic scales on both axes. For a positive power law with , positive references giveIts transformed slope is the exponent when both axes use the same logarithm base and the slope is measured in logarithmic coordinate units. For example, takes the values at . Every doubling of quadruples , giving slope two on a log-log plot.
This differs from a semi-log plot: a power law has constant proportional response to a proportional change of input, whereas exponential growth has constant proportional response to an additive change of input. Both can appear straight with appropriate axes, so one must read the scale labels before interpreting a slope.
A semi-log plot uses a logarithmic scale on one axis and a linear scale on the other. Which axis is logarithmic matters. Plotting against makes positive exponential functions appear as straight lines; plotting against instead makes an affine function of a logarithm appear straight. The plotting operations change positions while retaining the original tick values.[ref]
Log scale. Matplotlib 3.10.7 documentation; Matplotlib 3.10.7, Log scale: Convenience functions semilogx, semilogy, and loglog; distinction between horizontal and vertical logarithmic axes
Take the original dimensionless mathematical model for . It has exponential growth, with , , and . Taking a base-ten logarithm givesThe slope in these transformed positions is , although the original relative growth rate is . Equal steps of two in multiply by . The corresponding ordinary gains increase, so the left plot bends while the right plot is straight.
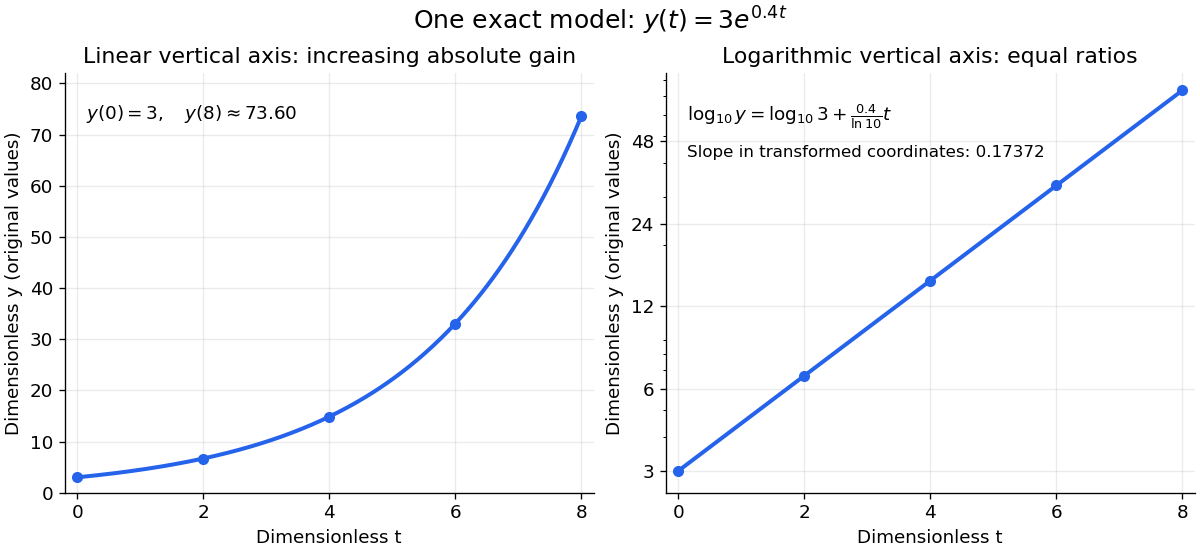
The same exponential growth model bends on a linear scale and is straight on a semi-log plot with a logarithmic vertical axis
. Original exact mathematical model , not measurements. Both panels show identical values at the same . Right-hand tick labels retain the original values, with equal gaps for each doubling. The stated slope is for , not the original derivative . Details.One practical use is checking a proposed exponential distribution for failure times. For rate and , its cumulative distribution function is , so the reciprocal survival function satisfies . Estimated probabilities can therefore be placed on a logarithmic vertical axis and compared with a straight line. Agreement supports compatibility with the chosen statistical model; a roughly straight finite sample does not establish a unique physical mechanism.[ref]
8.2.2.1. Probability plotting. NIST and SEMATECH e-Handbook of Statistical Methods, §8.2.2.1 Probability plotting: Exponential Model, logarithmic vertical-axis transformation and interpretation of approximate straightness
For positive endpoints , halfway along a logarithmic scale meansHere is the base. Equivalently, using the natural logarithm, . The product of numbers identity for logarithms gives , so the midpoint is the geometric mean . The two endpoints lie at equal multiplicative distances because .
For and , this midpoint is , giving a factor of on each side. The arithmetic mean is halfway on a linear scale, but its two ratios are and . Thus reading halfway between the marks and as on a logarithmic scale gives the wrong value.
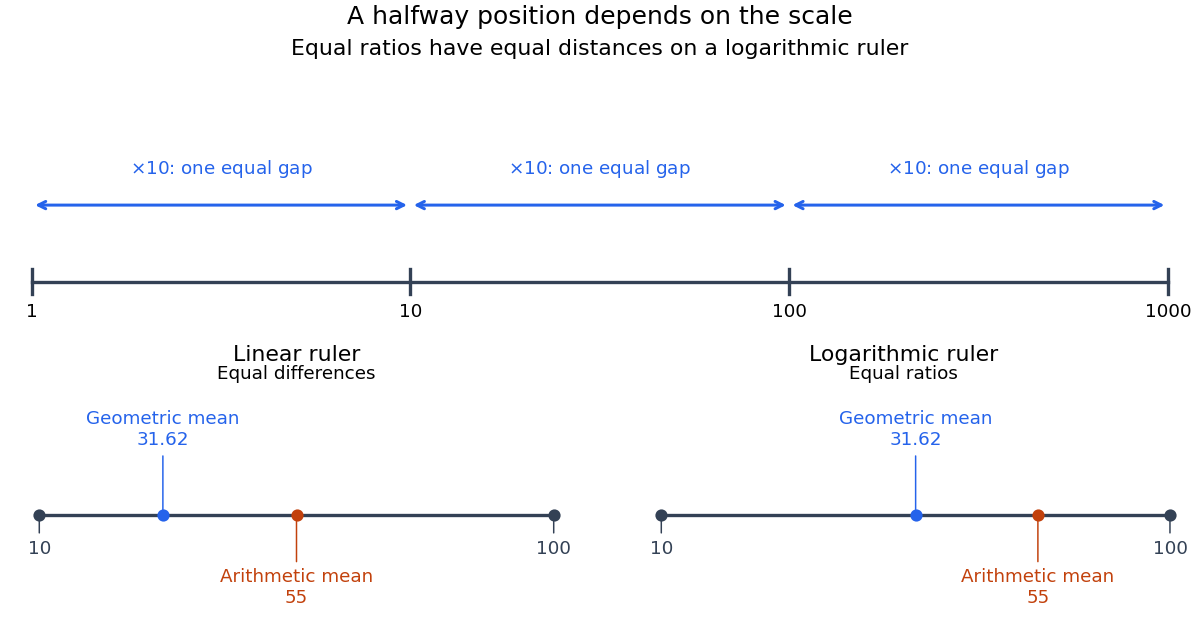
Equal ratios give equal logarithmic gaps, and the geometric mean is halfway between two positive values
. Original rulers calculated from logarithms. The lower rulers cover the same endpoints and : the blue geometric mean is centered on the logarithmic scale, while the orange arithmetic mean is centered on the linear scale. Tick labels show original values. Details.For positive quantities, a difference of one order of magnitude means a factor of ten; a difference of orders of magnitude means a factor of . The logarithmic difference records this comparison, without subtracting the quantities themselves. For example, is three orders of magnitude above one, regardless of a common change of units. Roughly assigning a single value to an order of magnitude also requires a rounding convention; powers of ten are the reference levels.
For , the natural logarithm satisfiesTo prove it, put . Then and the derivative is . More precisely,This positive integral controls errors in symmetric approximations to the logarithm. After writing , the bound is for ; the inequality reverses for by replacing with .
For an oriented parametric curve and scalar field , define the componentwise line integralIts value is a vector and reversing orientation changes its sign. It differs from the scalar arc length integral , which is independent of orientation. A request to integrate a scalar field along a curve should specify which differential is intended.
For the counterclockwise circle , suppose the restricted field has Fourier series . Orthogonality givesThe oriented vector integral selects the first angular harmonics, whereas the scalar arc-length integral selects the mean.
A line integral can be defined as an improper integral of its parametrized integrand when that integrand is undefined or unbounded at isolated parameter values. At an interior singular parameter, split the integral and require both one-sided limits to exist separately; their cancellation in a symmetric Cauchy principal value is a different convention. For a scalar arc length integral, use in place of the vector-field dot product.
If the restricted integrand has a removable singularity, integrating its continuous extension gives the same value. This does not require the original vector field to extend continuously to a full neighbourhood of the curve. Likewise, a differential identity may hold only on the regular segments: a zero integrand there has improper integral zero, although its printed classical expression may not be defined at the omitted points.
Cathode-ray attenuation with finite detector acceptance by  Codex 0 Created 2026-10-18 Updated 2026-10-20
An original toy model separates two ways to lose a central cathode ray signal. Let be forward depth into a uniform gas. Normalize the entering electron population to one. Write for the fraction still in a narrow forward channel, and for the fraction diverted into a wider collection channel. Assume constant removal rate per unit depth in both channels, and constant transfer rate from to , with no return. Removal means that an electron stops or is trapped before reaching the collecting plane; it does not mean that its electric charge disappears. The wide ideal collector accepts all surviving members of both channels. This is a stipulated two-population differential equation model, not a general law of electron transport:The first equation gives exponential decay. Adding the equations gives for , henceThese formulas also give a conservation check: . The fraction has been removed before the plane, while remains present but misses the narrow collector. An exponential fit to the narrow signal therefore measures , not the removal rate by itself. This is an identifiability issue: one declining signal cannot distinguish the two unknown rates.
For a worked example, choose and . These are invented teaching inputs, not measured coefficients for air or Lenard's apparatus. At ,Thus about misses the narrow collector, although only about has been removed in this model. Treating the whole narrow-signal deficit as stopping would confuse redistribution with removal.
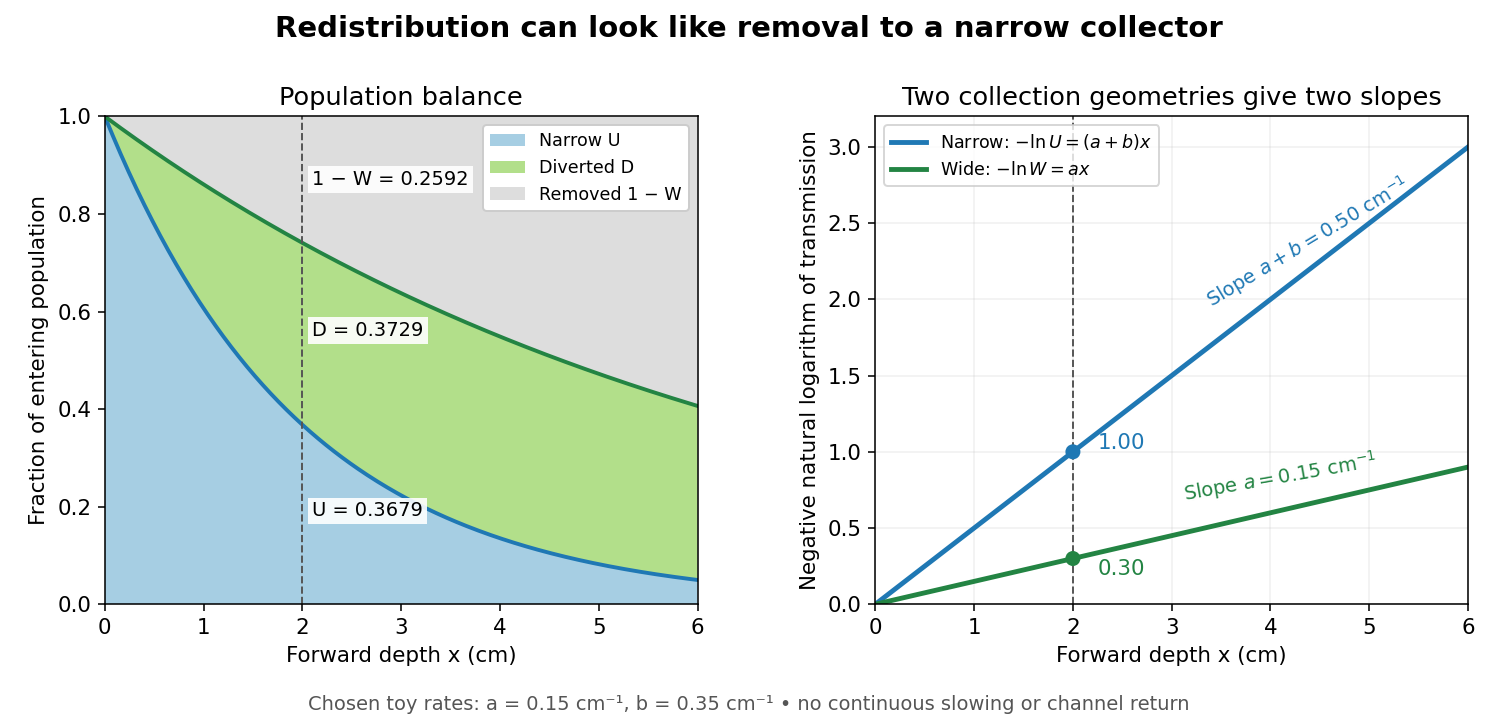
Suppose a calibrated readout is proportional to arriving electron number with the same response for either channel. Choose an empty-path signal arbitrary units, of which is background; the two collection geometries have the same calibrated reference. The calculated readings at are and . After background subtraction, define for each geometry. Then the original inverse problem has the solutionA single narrow reading would instead allow every nonnegative pair with . Using the raw ratios without subtracting gives an erroneous narrow rate of about . In a real fluorescent screen, the assumed response must be tested: deposited energy and conversion to light need not remain constant as electrons slow. Repeating the comparison at several depths tests the constant slopes, although straight slopes alone do not establish the microscopic mechanism.
Actual electrons change kinetic energy and direction. Electron stopping power describes mean kinetic energy loss per travelled path length ; collisional losses include ionization, while radiative losses include bremsstrahlung. The continuous slowing-down approximation range integrates reciprocal total electron stopping power, neglecting fluctuations. It approximates travelled path length, not forward penetration depth.[ref]
Appendix: Significance of Calculated Quantities. Stopping-Power and Range Tables for Electrons, Protons, and Helium Ions by M. J. Berger and others; Appendix: Significance of Calculated Quantities, collision/radiative/total stopping power, CSDA range, projected range and detour factor
As a separate original limiting example, stipulate a straight path, constant , and entering kinetic energy . Then until stopping, and . In that deterministic model every entering electron reaches each depth below and none crosses a plane beyond it. There is no exponential population tail. Real fluctuations and electron scattering make the situation more complicated, but the example already proves that continuous energy loss does not imply constant-rate removal.The window also changes the entering population: source kinetic energy before the foil need not equal just outside it. For an electron initially at rest, an ideal static accelerating electric potential difference supplies electrical work , where is the elementary charge. If losses before and within the foil total , a transmitted electron enters the observation chamber with . A screen's brightness determines neither nor . These formulas specify a modern ideal work-energy theorem argument; no numerical historical voltage or foil thickness is inferred from the diagram.
For nonnegative integer , a second solution of the Legendre differential equation is obtained by reduction of order from as . Normalize it as and , with the usual Legendre polynomial recurrence relation for higher degrees. Inside , near and near . These follow from , in the integral. Poles in the integral at interior polynomial zeros cancel in the product, by reduction of order across a zero of the known solution. On , the integral from infinity defines the decaying normalization . For all bounded exterior solutions decay this way; for an additional constant solution remains bounded.
Choose a primitive cubic lattice with , one identical point scatterer per primitive unit cell, incident direction , and the continuous wavelength band . This is a hypothetical model, not the zinc blende specimen of the Laue X-ray diffraction experiment of 1912. Write a candidate reciprocal lattice vector as with , and set . The Laue equations and elastic scattering giveA transmission photographic plate at intercepts only . Its coordinates relative to the direct beam areFor and , , and , so . Its length is one, and each component difference satisfies the corresponding Laue equations. This verifies a direction and a selected wavelength, without predicting an exposure or measured wave intensity.
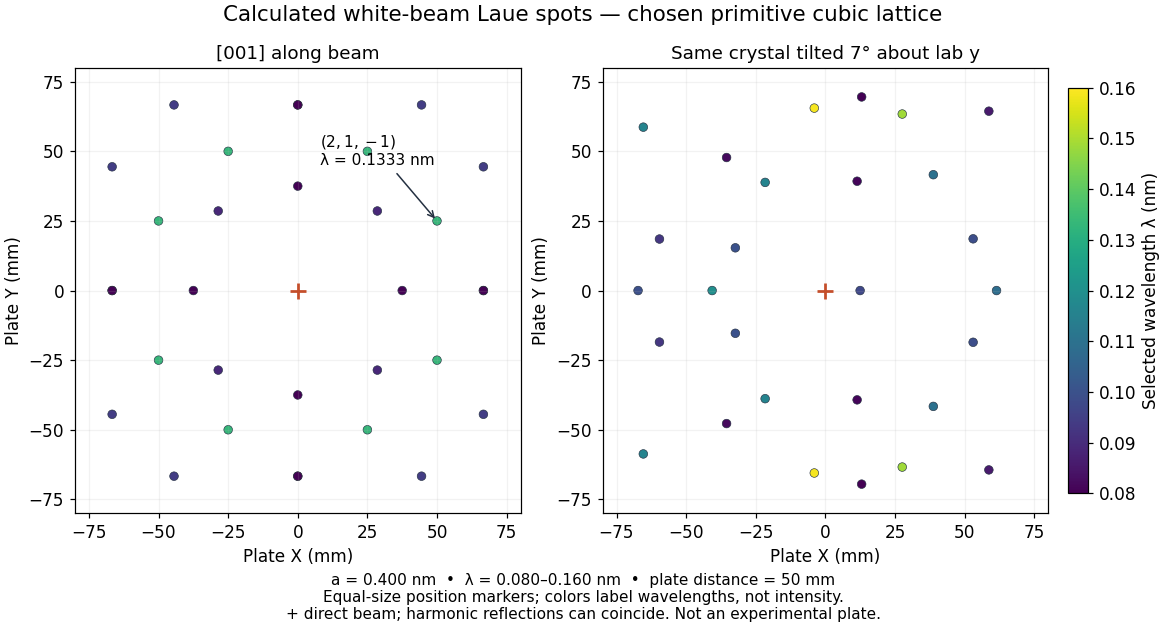
Calculated white-beam Laue method spots and their response to crystal tilt
. Original calculation for the stated primitive cubic lattice and a square detector with . Left: the cubic direction is along the incident beam. Right: rotate the same crystal structure by about the laboratory axis, keeping source and detector fixed. Color gives the selected wavelength; equal marker sizes convey positions rather than wave intensities. Harmonic reflections can overlap. Neither panel copies, simulates the chemistry of, or fits an experimental plate. Source. Details.The first panel has fourfold symmetry because its chosen Bravais lattice, beam axis and square detector share that symmetry. For the tilted panel, apply a rotation matrix to each index vector, set , and use and . All indices with suffice: elastic scattering bounds . Thus the plotted spectral and angular selection is complete within this ideal point model and detector window. Multiples of an index vector select inversely scaled wavelengths and can land on the same spot; a white-beam spot need not identify a unique diffraction order.
Pinned article: Introduction to the OurBigBook Project
Welcome to the OurBigBook Project! Our goal is to create the perfect publishing platform for STEM subjects, and get university-level students to write the best free STEM tutorials ever.
Everyone is welcome to create an account and play with the site: ourbigbook.com/go/register. We belive that students themselves can write amazing tutorials, but teachers are welcome too. You can write about anything you want, it doesn't have to be STEM or even educational. Silly test content is very welcome and you won't be penalized in any way. Just keep it legal!
Intro to OurBigBook
. Source. We have two killer features:
- topics: topics group articles by different users with the same title, e.g. here is the topic for the "Fundamental Theorem of Calculus" ourbigbook.com/go/topic/fundamental-theorem-of-calculusArticles of different users are sorted by upvote within each article page. This feature is a bit like:
- a Wikipedia where each user can have their own version of each article
- a Q&A website like Stack Overflow, where multiple people can give their views on a given topic, and the best ones are sorted by upvote. Except you don't need to wait for someone to ask first, and any topic goes, no matter how narrow or broad
This feature makes it possible for readers to find better explanations of any topic created by other writers. And it allows writers to create an explanation in a place that readers might actually find it.
Figure 1. Screenshot of the "Derivative" topic page. View it live at: ourbigbook.com/go/topic/derivativeVideo 2. OurBigBook Web topics demo. Source. - local editing: you can store all your personal knowledge base content locally in a plaintext markup format that can be edited locally and published either:This way you can be sure that even if OurBigBook.com were to go down one day (which we have no plans to do as it is quite cheap to host!), your content will still be perfectly readable as a static site.
- to OurBigBook.com to get awesome multi-user features like topics and likes
- as HTML files to a static website, which you can host yourself for free on many external providers like GitHub Pages, and remain in full control

Figure 2. You can publish local OurBigBook lightweight markup files to either OurBigBook.com or as a static website.
Figure 3. Visual Studio Code extension installation.
Figure 5. . You can also edit articles on the Web editor without installing anything locally. Video 3. Edit locally and publish demo. Source. This shows editing OurBigBook Markup and publishing it using the Visual Studio Code extension. 
- Infinitely deep tables of contents:




All our software is open source and hosted at: github.com/ourbigbook/ourbigbook
Further documentation can be found at: docs.ourbigbook.com
Feel free to reach our to us for any help or suggestions: docs.ourbigbook.com/#contact