
Let increase down the pipe, be its radius and the distance from its axis. For steady, fully developed laminar flow of a Newtonian fluid, the axial Navier-Stokes equations reduce toWrite . Integrating twice, regularity at excludes a logarithmic term, and the no-slip boundary condition gives the Hagen-Poiseuille flow profileThe volumetric flow rate follows by integrating over the circular cross-section:For the intended gravity-driven case with no imposed axial pressure gradient, . Substitution givesandThe corresponding mean speed is about and the diameter-based Reynolds number is , consistent with laminar flow. The original PDF does not specify inlet and outlet pressures. If they impose an additional pressure gradient, the general result with above applies; gravity alone does not determine that extra contribution.
Choose a coordinate measured from the sphere centre towards increasing distance from the block, so an atom in the sphere is at height . Summing the atom–block potential energy with the sphere's number density givesFor , a uniformly valid Taylor series over the sphere isThe odd moments vanish by reflection symmetry. The sphere volume is , and its second moment isConsequentlyThe first finite-radius correction is therefore . There is no relative correction because the first moment about the centre is zero. The leading term is just the number of sphere atoms times the potential at its centre; the correction increases the attraction because the nearer atoms contribute more strongly than the farther atoms lose.
This is the far-field sphere-plane dispersion energy, with Hamaker constant . It must be distinguished from the near-contact sphere-plane dispersion force, whose small parameter is the surface gap divided by the radius. Here is explicitly the centre-to-plane distance.
In the weak-field reptation regime of agarose gel electrophoresis, the electrophoretic mobility of a long linear DNA chain scales as , where is its number of base pairs. One way to see the scaling is that the constrained-chain diffusion coefficient scales as , whereas its effective electric charge scales as ; the drift response is proportional to . With the same electric field and running time, the migration distance is therefore . The time cancels from the ratio, givingHere “kbp” means a thousand base pairs, not a rate. The second gel band has traveled farther and corresponds to the shorter chain under this migration model. The inverse-length law applies only over an appropriate migration regime.[ref].
At very low agarose concentration the mesh becomes too open to sieve these chains effectively. In the free-solution limit the chain's electric charge and friction are both approximately proportional to its length, so both chains have nearly the same electrophoretic mobility and their gel bands cease to separate well. At very high agarose concentration the pores become small and transport is strongly hindered; over a fixed experimental time both chains migrate very little, so their absolute spatial separation again becomes small. Increasing gel concentration can improve resolution over an intermediate range, but not indefinitely.
The numerical result is conditional on the inverse-length reptation law. Actual gel electrophoresis size calibration often uses an empirical approximately linear relation between distance and over a specified range. One known band alone cannot fix that relation's slope. The PDF supplies neither gel concentration nor a calibration curve, so is the standard model estimate rather than a uniquely calibrated experimental size.
Stabilization and screening. Charge stabilization of colloids means suppressing aggregation through repulsion between similarly charged particles and their electric double layers. In DLVO theory, this repulsion competes with attractive Van der Waals forces. A substantial repulsive barrier compared with thermal energy can make aggregation slow, even when the dispersed state is only metastable.
The Debye–Hückel screening length is the characteristic range over which a weak electric potential is attenuated by rearrangement of mobile ions. It measures the thickness of a diffuse screening cloud, not a molecular diameter. For a plane, a weak potential decays as into the bulk.
Derivation and the source convention. Put a planar interface at , with electrolyte in , bulk potential zero, and absolute permittivity . For a symmetric electrolyte, let be the bulk number density of each ionic species. The Boltzmann distribution givesso the mobile charge density isSubstitution into the SI Poisson equation, , gives the Poisson-Boltzmann equationFor , linearize the hyperbolic sine. The Debye–Hückel approximation is thenHere is the ionic valence magnitude, the elementary electric charge, the Boltzmann constant, absolute temperature, the vacuum permittivity, and the solvent's relative permittivity. For several ionic species, the numerator is replaced by .
The original PDF includes an additional in the denominator. That factor does not follow from SI Poisson equation with number densities and the stated permittivities. The Bjerrum length provides a useful check: and the consistent result is . A Gaussian-unit convention moves factors of together with the charge and permittivity conventions; it does not justify inserting this extra factor while retaining all the given SI quantities. Both numerical interpretations are reported below rather than silently changing the source.
Conditions favoring stability. Increasing the surface-potential or surface-charge magnitude usually strengthens the electrostatic barrier. Lower ionic strength increases and generally makes repulsion longer ranged; added salt and especially multivalent counterions shorten it and can promote aggregation. Suitable pH can keep an ionizable surface charged, while conditions near an isoelectric state weaken charge repulsion. The solvent-dependent Van der Waals forces, charge regulation and particle geometry also affect the barrier, so a long screening length is not by itself sufficient. At fixed density and valence, the linear formula gives , but actual temperature changes can also alter the permittivity and surface chemistry.
Surface charge at small potential. Take the usual one-sided planar-interface model, with negligible electric displacement on the nonaqueous side. The solution decaying into the solution isThe electric field is . The electrostatic interface boundary conditions then give the surface charge densityOne can also derive it by integrating the diffuse charge density:Thus the diffuse layer neutralizes the surface charge. This is the planar Debye-Hückel double layer. If instead the object is an isolated sheet wetted by identical electrolyte on both sides, each side screens half its total charge and . The one-sided assumption is the conventional local model for the exterior of a large charged colloid; it must be stated because the question does not specify the material on the other side.
Numerical ion density. For , , and , the consistent SI result isThis is for each ion species, and hence also the salt concentration for a monovalent salt. The combined number density of both signs is .
Literal substitution into the formula printed in the PDF instead givesThese values are distinct consequences of the source's extra factor; they cannot both describe the same physical screening length in SI with the same definition of .
Surface potential and validity. The requested linear estimate in the one-sided model isHowever, the thermal voltage is , so . Thus the small-potential approximation is not self-consistent for the supplied surface charge. The boxed value is its formal extrapolation, not a reliable prediction of the actual surface potential.
For a valid nonlinear comparison within the ideal one-sided planar Poisson-Boltzmann equation, multiply the differential equation by and use zero potential and field in the bulk. This givesUsing the surface boundary condition yields the Grahame equation and its inverse:With the SI screening length, the latter gives . This is a nonlinear mean-field estimate under explicit assumptions, not a unique experimentally determined potential: compact interfacial layers, finite ion size and surface chemistry were not supplied. The source's normalization problem and its use of a linear formula far outside the small-potential regime are separate issues.
Solvent quality. The Flory interaction parameter measures the free-energy cost of polymer–solvent contacts relative to like contacts. In the simplest lattice model,where is the coordination number and the values are contact energies. For lattice-site volume , the effective two-segment excluded volume is . Its sign determines the leading tendency of a long dilute flexible chain.
For , : a good solvent favors a swollen coil because segment encounters are effectively repulsive. For , the leading attraction and repulsion cancel, giving approximately ideal chain statistics. For , effective attraction favors contraction in a poor solvent, eventually producing a compact polymer globule under sufficiently poor conditions. This does not mean that every finite-chain solution with is automatically phase-separated; that also depends on composition and chain length.
The condition is the theta temperature condition for that polymer–solvent pair. For an energetic model , it occurs at . More generally, if , it occurs when . It is not the absence of all intermolecular interactions and does not require the polymer and solvent to be chemically identical.
Chain dimensions. Interpret as the root-mean-square end-to-end distance of a polymer chain. Let denote the supplied statistical step length, calibrated to the same count as the degree of polymerization. At the theta condition, random-walk statistics giveFor a good solvent, the Flory approximation balances entropic stretching and two-segment interaction:Minimization gives , henceThus the familiar good-solvent scaling is when its nonuniversal solvent-quality amplitude is suppressed. With the additional lattice estimate , the more explicit form is . This swollen-coil estimate is used away from the narrow theta crossover; it must not be extrapolated to predict as . The crossover occurs when is of order one. Nearer theta, the ideal-coil size supplies the appropriate limit.
Numerical sizes. The theta value isFor , the plain good-solvent scaling givesIf the solvent-quality amplitude is retained with , it instead givesThe distinction is an explicitly stated modeling convention: the question does not give a microscopic site volume or an absolute swollen-coil prefactor. Both estimates describe a coil larger than the theta coil. Here , so a swollen-coil estimate is reasonable. Neither result is an exact microscopic prediction from the supplied data alone.
Overlap concentration. The polymer overlap concentration corresponds to one chain per coil volume. Using the scaling convention givesThe first is chain number density; the second counts repeat units. Thus the repeat-unit molar concentration is approximately . If the lattice-site volume is taken as , this is equivalentlyFor a mass-concentration estimate, a polystyrene repeat unit has molar mass about , so this scaling convention givesThere is no sharp coil surface fixing an exact numerical prefactor. For example, using the often adopted geometric definition , with the ideal chain radius of gyration , gives . The invariant content is one chain per coil volume and the theta scaling ; the radius and coil-volume convention must accompany a numerical value.
Osmotic pressure. In the given lattice expression, is a dimensionless polymer volume fraction, not a dimensional number density, and is the mixing free energy per lattice site. Introduce to obtain a physical osmotic pressure. If is the number of sites and , differentiation of with respect to the solvent count at fixed chain count givesBalancing this change in solvent chemical potential against the pressure contribution gives . For composition-independent ,and therefore the osmotic pressure in Flory-Huggins solution theory isExpanding the logarithm as givesThe first term is with now denoting chain number density: a whole chain supplies one translational contribution. The sign of the quadratic correction reproduces the solvent-quality classification. It is positive for a good solvent, zero at the theta temperature, and negative for a poor solvent. This is the same two-segment interaction that swells or contracts a single coil. At theta, a positive third-order contribution remains; the chain is approximately ideal in its large-scale conformation, not a gas of segments with no interactions at all.
Diffusion and mobility. For a dilute isolated sphere in a Newtonian fluid, Stokes's law gives the drag magnitude , where is the dynamic viscosity and is the hydrodynamic radius. The mechanical mobility is therefore ; the translational hydrodynamic mobility matrix is .
To relate mobility to diffusion, put the particles in a weak external potential energy . Their drift speed is . For number density , the sum of drift and Fick's first law fluxes isAt thermal equilibrium, the Boltzmann distribution gives , and the net flux is zero. Substituting into yields . Thus the Stokes–Einstein relation isHere is the Boltzmann constant and is absolute temperature. The assumptions include a no-slip approximately spherical particle, a continuum fluid, a small particle Reynolds number, and negligible hydrodynamic interactions with other particles or boundaries.
Gravitational sedimentation. The buoyant force must be included, since the mass of displaced water is comparable to the protein mass. Using givesso the buoyant mass in the stated spherical model isThe drag coefficient is . At terminal speed, , soIgnoring buoyancy would give and would not use the supplied water density. This calculation treats the stated radius as both the hydrodynamic radius and the radius determining displaced volume; a real hydrated protein can require a separately measured partial specific volume.
Electrical drift. In the specified simple electrophoresis model, terminal force balance is . Thereforewhere is the electrophoretic mobility and the elementary electric charge. For the given positive beta-lactoglobulin charge,in the direction of the electric field. This exceeds the gravitational sedimentation speed by about .
Separation time. The two populations have equal drag coefficients because their radii are equal. Their difference in drift speed is therefore set by one elementary charge:Starting with coincident band centres, their separation is . HenceAt that time the original band has travelled and the mutant . Their masses do not enter this ideal electrical force balance: equal-radius particles with different masses but the same charge would have equal electrophoretic mobility in this model.
Practical discrimination. A one-charge difference is enough for the stipulated separation, so the method is sensitive to mutations that change effective charge or friction. It cannot distinguish every mutation: substitutions that preserve charge and hydrodynamic size need not separate. Buffer pH changes protein ionization, and realistic electrophoresis also involves the ionic atmosphere, electro-osmosis, walls or gel interactions, and finite band widths.
For example, the Stokes–Einstein relation at gives . For an initially narrow band, diffusive broadening of electrophoretic bands givesat the calculated separation time. Thus the centres are about diffusion standard deviations apart, rather than forming infinitely sharp bands. The stated centre-separation criterion is achievable in the model, but actual resolution also depends on the loading width and other dispersion mechanisms.
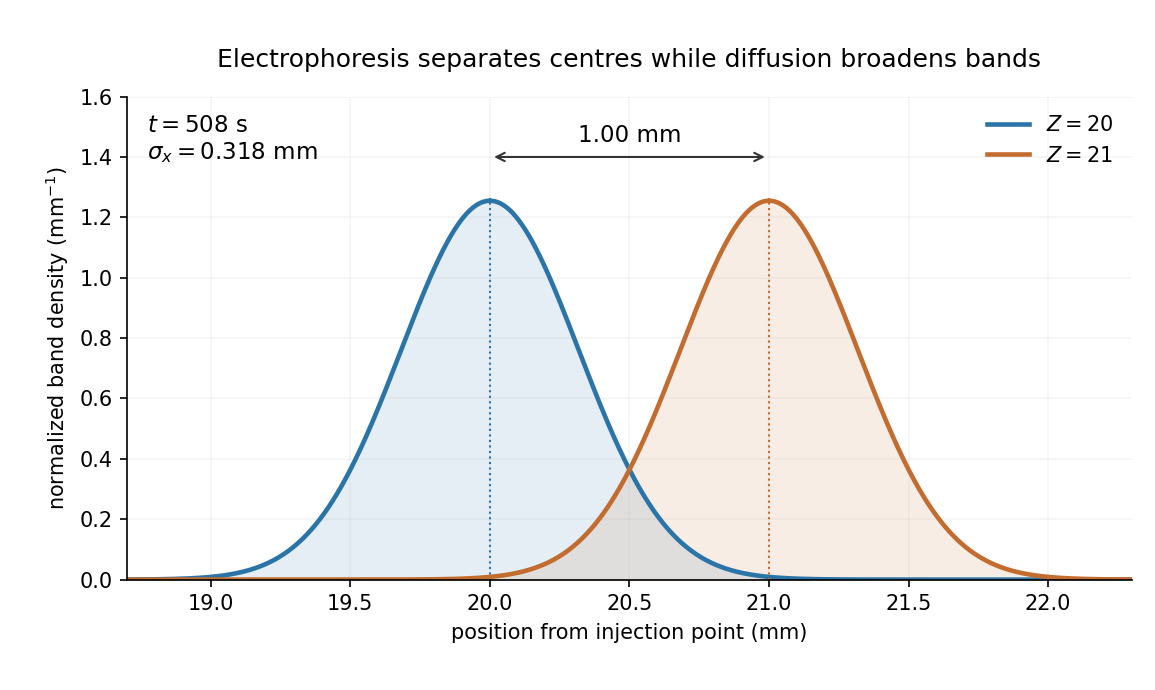
Equivalent centrifugal acceleration. For the original protein to attain its electrical drift speed by sedimentation, its buoyant centrifugal force must equal :ConsequentlyThis is the acceleration at the protein's position in the rotating solution; no rotation rate can be assigned without a centrifuge radius. If the intended comparison is instead the relative separation speed of the two bands, use , since their displaced volumes are equal. Matching then gives . In that separation experiment the heavier original protein moves faster centrifugally, whereas the more highly charged mutant moves faster electrically.
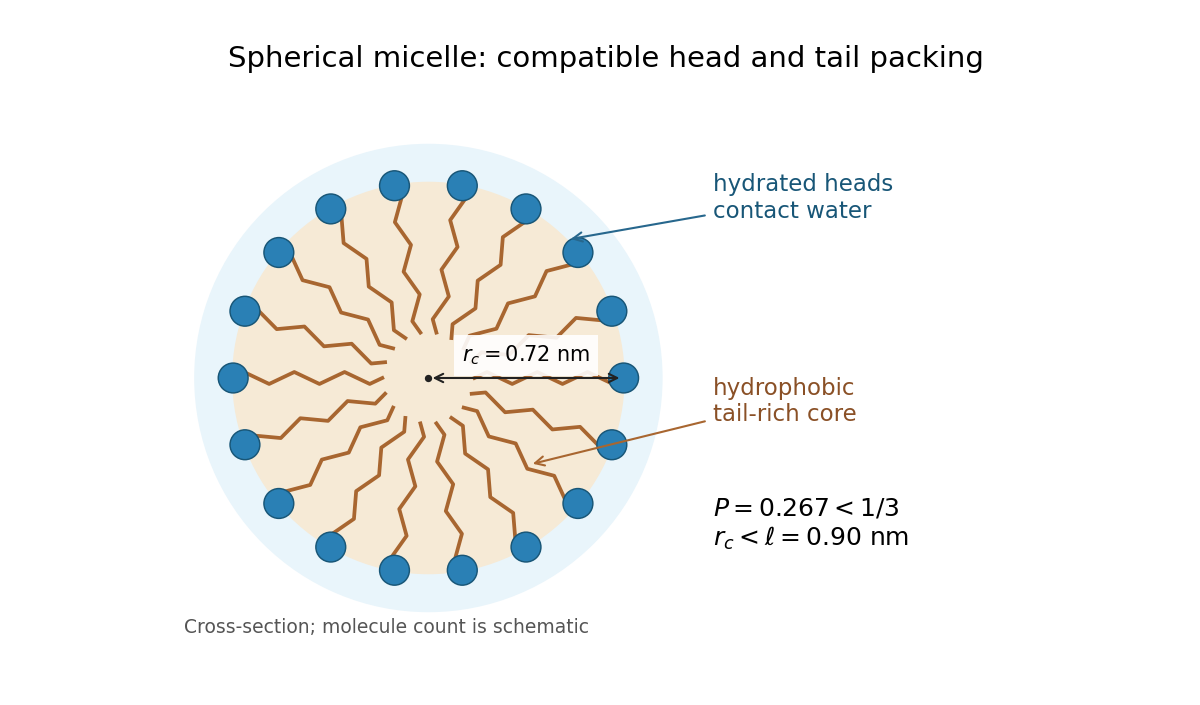
Two examples are sodium dodecyl sulfate, with a negatively charged sulfate head and a hydrocarbon tail, and cetrimonium bromide, with a positively charged ammonium head and a hydrocarbon tail. Both are amphiphiles: one region is hydrophilic and another is hydrophobic.
In water, the hydrophobic effect favors association of the tails into a core, reducing their exposed area while the hydrated heads remain outside. This can lower the total Gibbs free energy despite loss of translational entropy. Head-group repulsion, interfacial cost and chain-packing constraints oppose unlimited growth, so finite micelles are favored under suitable conditions above the critical micelle concentration.
The appropriate geometric measure is the amphiphile packing parameter:For a spherical micelle with tails and core radius , the volume and area relations are and . Dividing gives , so a sphere fits without overextending a tail if . Here andThus the packing model predicts spherical micelles. This is a preferred aggregate geometry, not a claim that concentration, temperature or ionic conditions can never alter the morphology.


There is a source error to resolve first. For a drag coefficient defined by , the velocity relaxation time is . The mass and drag coefficient in the PDF's exponential are interchanged: is dimensionless, whereas is not. The consistent mean relaxation law is therefore .
A mean relaxation law alone does not determine a variance. Use the usual thermal Langevin equation, with a bath at temperature and the fluctuation-dissipation relation for a Langevin particle:Here the calculation is for one component in Cartesian coordinates. With fixed initial position and velocity, integration gives the mean displacementIntegrating the stochastic part of the velocity once more gives the centered displacementThe delta correlation reduces its variance to a single integral:This is the integrated Ornstein-Uhlenbeck displacement for a prescribed initial velocity. Its short-time variance is ; at long times it is . Thus the diffusion coefficient isIf the requested mean-squared fluctuation instead refers to the conventional equilibrium mean squared displacement, the initial velocity is also averaged over its thermal distribution, with and . Its contribution adds , givingThis has the ballistic limit and the same diffusive limit . For fixed nonzero , the uncentered mean square instead equals the first boxed variance plus . In three independent spatial dimensions, the centered variances add, and the long-time result is . Stating the initial-velocity convention is necessary to distinguish these finite-time formulas.
The Reynolds number compares inertial and viscous effects:where is fluid mass density, a characteristic swimming speed, a characteristic body length, and the dynamic viscosity. Both swimmers are in the same fluid, so the fluid properties cancel from the ratio:For an order-of-magnitude estimate, take , , and . With water values and , these giveand henceThe dimensions and swimming speeds are estimates, so this ratio is not a universal species-independent constant. Its physical significance is robust: viscous forces dominate the bacterium's motion, whereas fluid inertia is crucial for the whale.
Ideal and self-avoiding walks. An ideal chain has independent isotropic coarse-grained steps and permits self-intersections in its mathematical model. For steps of length , the cross terms average to zero, so its root-mean-square end-to-end distance of a polymer chain obeysA self-avoiding walk excludes repeated occupancy or intersection at the segment scale. This represents positive excluded volume in a dilute good solvent. The nonlocal constraint correlates otherwise distant portions of the chain and swells it:The Flory approximation replaces this exponent by , by balancing stretching free energy with an interaction contribution . The result is a more extended and less internally dense coil than the ideal walk; self-avoidance changes the statistics, not merely the local step length.
Two ideal-chain regimes. At the theta temperature for a dilute polymer–solvent pair, leading effective segment attractions and repulsions cancel. Large-scale chain statistics are approximately ideal, even though microscopic atoms still have finite size. In a homogeneous polymer melt, surrounding chains screen long-range excluded volume interactions of a chosen chain, again making its equilibrium large-scale size approximately ideal. Local bond-angle correlations must be included in an effective statistical length such as the Kuhn length. Polymer entanglements can slow the dynamics without invalidating this leading equilibrium size law.
Semiflexible DNA. The nucleic acid double helix gives double-stranded DNA a bending stiffness and substantial local orientational persistence. Independent step orientations are therefore a poor description on short scales, while self-avoidance alone does not specify the energy cost of bending. The worm-like chain describes the molecule as a continuously bendable, locally inextensible curve parameterized by arc length , with unit tangent . Its bending energy iswhere is bending stiffness. In the free three-dimensional model, the persistence length is andThus is the contour separation over which tangent alignment falls by the factor ; it quantifies stiffness relative to thermal bending. The model bridges locally rod-like and globally coil-like conformations. It omits long-range self-avoidance in its simplest form, so sufficiently long dilute DNA can require excluded-volume corrections.
Flexible and rigid limits. Integrating the tangent correlation over the two contour positions gives the end-to-end distance of a worm-like chain:For a very flexible chain on the scale of its total length, , the exponential is negligible andThis is the ideal chain result with Kuhn length and effective step count . Many persistent sections have decorrelated orientations. The flexible limit means a large ratio within the continuum model's range, not an extrapolation of the persistence length below all molecular length scales.
For a nearly rigid chain, , the constant and linear terms in the exponential cancel those outside it. The Taylor series givessoThis is the expected rod limit: all tangents are nearly aligned, and the end-to-end distance approaches the arc length.
Helix–coil curves. A helix-coil transition model allows ordered helical runs and disordered coil regions. Use and with exactly the free-energy conventions defined in the paper. A negative gives and favors the helical state; a positive junction cost gives and penalizes starting new domains. The supplied helical fraction is the long-chain form associated with the Zimm-Bragg model.
Its main features follow directly without assuming a sharp transition. Put . For every ,and differentiating givesThus all curves rise monotonically and cross at . Increasing the boundary free-energy cost reduces , suppresses frequent coil–helix boundaries and makes longer runs favorable. The transition region becomes narrower and steeper: balancing against gives a width of order near .
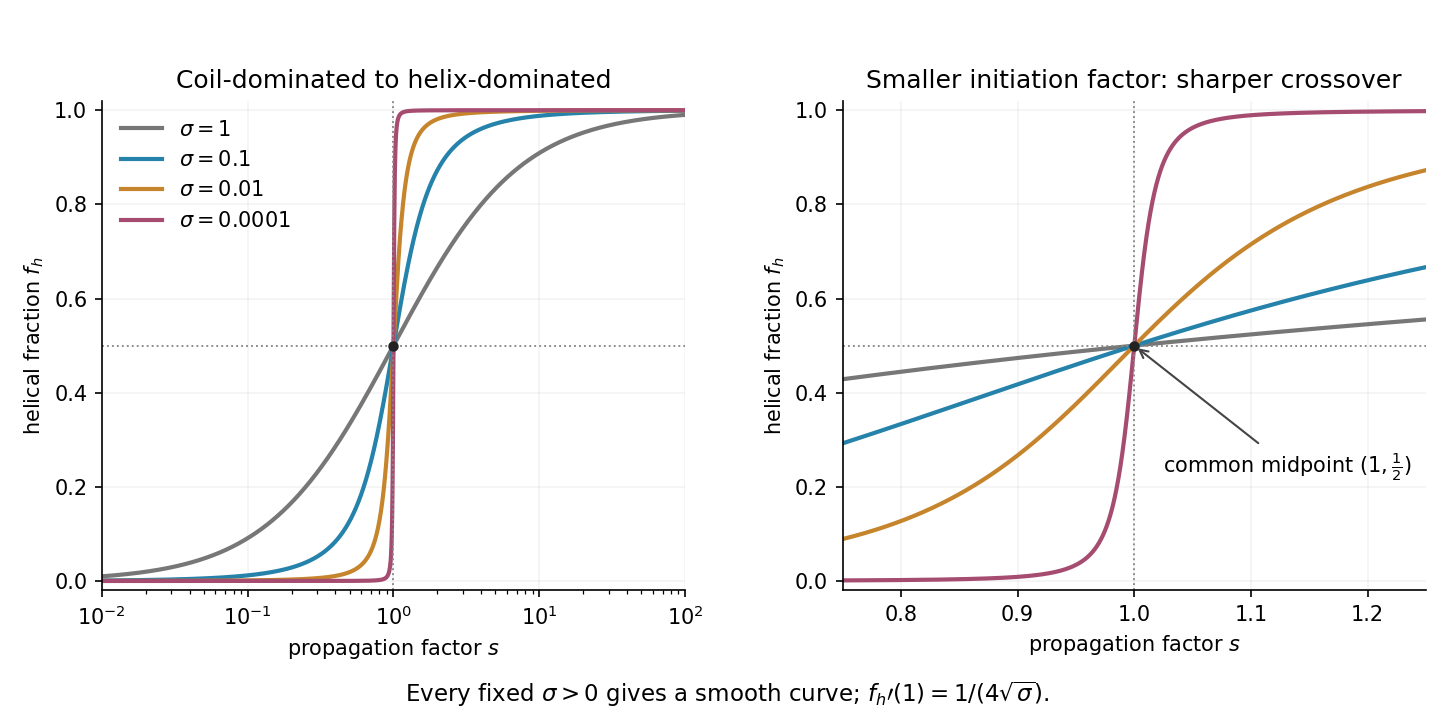

For , the fraction simplifies to , the noncooperative two-state result. For , the steep curve describes cooperative helix formation. In the singular limit , it approaches zero for and one for ; its midpoint remains when approached through positive . Setting directly makes the formula indeterminate at . For any fixed positive , the given long-chain curve is smooth: it is a cooperative crossover, not a true discontinuity. The plot varies at fixed ; in an actual temperature scan both parameters may change, and a finite chain can further round the crossover.
Oscillatory response. A material with viscoelasticity stores some deformation energy and dissipates some over a loading cycle. In small-amplitude oscillatory shear, represent the strain by . The shear-stress amplitude is related to the strain amplitude by the complex viscoelastic modulusHere is the storage modulus, the component in phase with strain, and is the loss modulus, the dissipative quadrature component. Both have units of pressure. The stress leads the strain by an angle , withFor this convention, a passive material has at positive frequency. Integrating over one period gives dissipated energy per unit volume , and the average input power per unit volume is . Thus the loss tangent compares the dissipative and elastic parts of the response. The frequency dependence reflects which internal relaxation processes can follow the imposed deformation.
Torsional measurement. Use for radial position inside the rod, reserving for its outer radius. A small angular displacement of one end relative to the fixed other end gives shear strainIn harmonic amplitude notation, the shear stress is . Its restoring torque is obtained by multiplying by the lever arm and integrating over the circular section:The factor is the polar second moment of area; it is not the disc's mass moment of inertia . The torsional spring constant becomes the complex stiffness . Angular Newton's second law therefore gives the paper's compact representationIts precise interpretation is a torsional measurement of a complex shear modulus. At a specified frequency, with complex angular amplitude , the driven response obeysSetting the external torque to zero supplies the free-mode condition, whose damped frequencies are generally complex. A dissipative free oscillator does not execute a sustained nonzero oscillation at a real frequency without driving. In real time, a general frequency-dependent complex viscoelastic modulus represents a causal memory response, rather than a complex instantaneous force on a real displacement. The derivation assumes a uniform slender circular rod, small twist, negligible rod inertia relative to the disc, and no additional bending, slip or external damping.
Frequency regimes and sketches. A permanently crosslinked elastomer has a low-frequency rubbery plateau . Slow chain rearrangements can follow the strain, so the network is relatively compliant but still elastic. At high frequency the relevant segmental motions are frozen, giving a much larger unrelaxed or glassy stiffness . Between these regimes the motions lag behind the loading and dissipate strongly.
A standard linear solid model supplies a consistent illustrative sketch of this process. Put , where is the stress viscoelastic relaxation time, and . ThensoAt very low frequency, , and . Through the relaxation region rises, has a maximum and has a loss peak. At high frequency, , and again. Real polymers usually have a spectrum of relaxation times, so these features are broader and can have further structure.
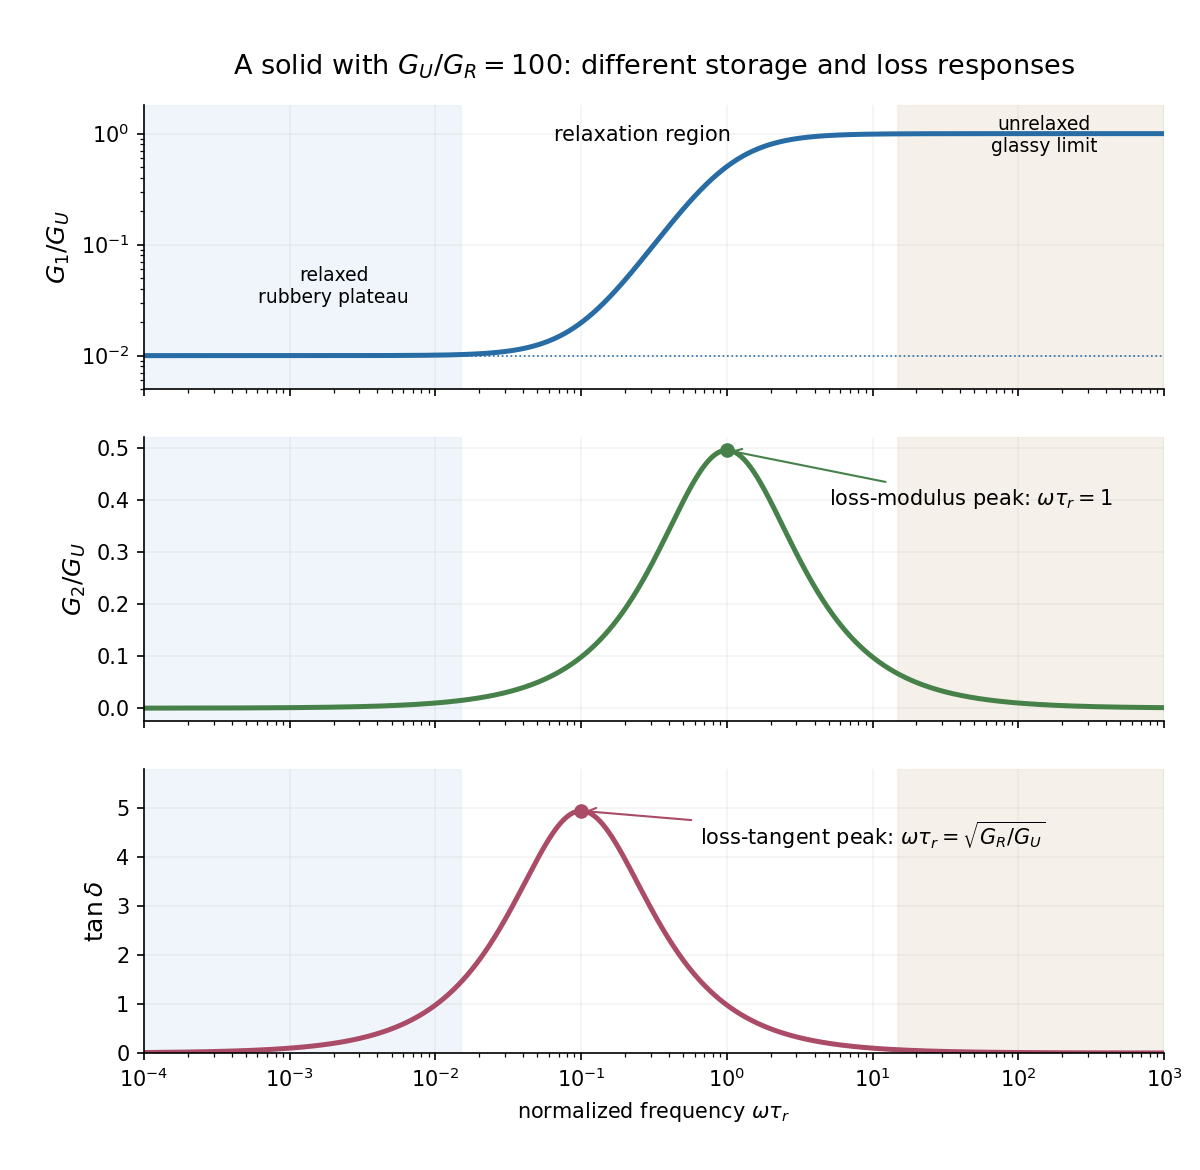

The two kinds of loss peak need not coincide. The peak frequencies in a standard linear solid areThe first follows by differentiating ; the second by differentiating . This is why the sketch marks the peaks separately. If the polymer is an uncrosslinked melt rather than a permanent network, there is an additional ultimate low-frequency terminal-flow regime, with and ; a permanent elastomer does not have that zero-frequency fluid limit.
Interstitial atoms in a metal. A suitable mechanism is the Snoek effect, a form of anelasticity. An interstitial defect distorts its local crystal structure anisotropically. Different site orientations become unequally favorable under an applied stress, so hopping atoms redistribute towards the preferred orientations and supply additional strain. The hopping time is thermally activated, approximately , with activation energy .
At low frequency, , the populations nearly equilibrate during each cycle. The defect contribution to strain is nearly in phase with stress, giving a relaxed compliance and little dissipation. At intermediate frequency, , redistribution lags behind the stress and energy dissipation is largest. At high frequency, , the populations are effectively frozen; the extra relaxation strain cannot develop, and the response approaches the stiffer unrelaxed elastic limit. For weak single-mode relaxation, the loss tangent is approximately proportional to . The metal remains a solid in the low-frequency regime: the extra delayed strain is recoverable, not unrestricted viscous flow.
Two stabilization mechanisms. Steric stabilization coats each colloid with adsorbed or grafted polymer layers. Bringing two particles close overlaps or compresses those layers, increasing their free energy through loss of chain conformations and, in a suitable solvent, increased local osmotic pressure. The resulting repulsion can keep the cores apart. A well-solvated nonionic coating can remain effective when added salt would screen electrostatic forces. Coatings can fail through desorption, poor solvent conditions or bridging, so simply adding arbitrary free polymer does not guarantee stabilization.
Charge stabilization of colloids instead uses similarly charged surfaces and their diffuse electric double layers. Their approach costs electrostatic and ionic free energy. In DLVO theory, that repulsion competes with attractive Van der Waals forces. It is particularly sensitive to salt concentration, counterion valence and surface ionization.
Bjerrum length. The standard Bjerrum length is the separation at which the Coulomb interaction energy of two elementary charges equals thermal energy:At and , this isIt compares ionic electrostatic coupling with thermal agitation. For ions of signed valences , . The standard reference length uses , not the whole colloid charge: assigning a colloid charge does not change the solvent's tabulated .
Screening and the printed normalization. In a symmetric electrolyte, is the ionic valence magnitude, the elementary electric charge, the bulk number density of each ionic species, the vacuum permittivity, the solvent's relative permittivity, the Boltzmann constant and absolute temperature. Mobile ions rearrange around a charged surface; the Debye–Hückel screening length sets the range of the resulting weak potential.
There is an SI normalization error in the original PDF. Combining the Boltzmann distribution with the SI Poisson equation and linearizing at givesThe extra in the PDF denominator is inconsistent with those SI charge, permittivity and density conventions. Keeping the printed algebra would make its screening length times the SI value at the same ion density. No numerical screening length is required here, and the qualitative dependence is the same in either normalization. Added salt shortens the range of repulsion, allowing the attractive potential to capture particles more readily.
Interaction-potential sketches. Let be the surface separation between two spheres of radius . A useful schematic DLVO theory potential has the formaway from the microscopic contact region. Here is a Hamaker constant; excluded-core repulsion and molecular details regularize contact. The exponential is the double-layer repulsion and the inverse-gap term the short-gap Van der Waals force contribution. A fixed illustrates the changing screening range; actual charge regulation can change the repulsive amplitude as well.
At low salt there is a high positive barrier between a deep primary minimum near contact and the dispersed state at . A shallow secondary minimum can occur outside the barrier and support weak reversible association. Increasing salt narrows the repulsive range and lowers the barrier. Thermally activated primary aggregation becomes appreciable when the barrier is only a few ; the idealized barrier-free condition defines the fast-aggregation threshold associated with the critical coagulation concentration. Above that threshold, collisions can result in rapid capture in the primary minimum.
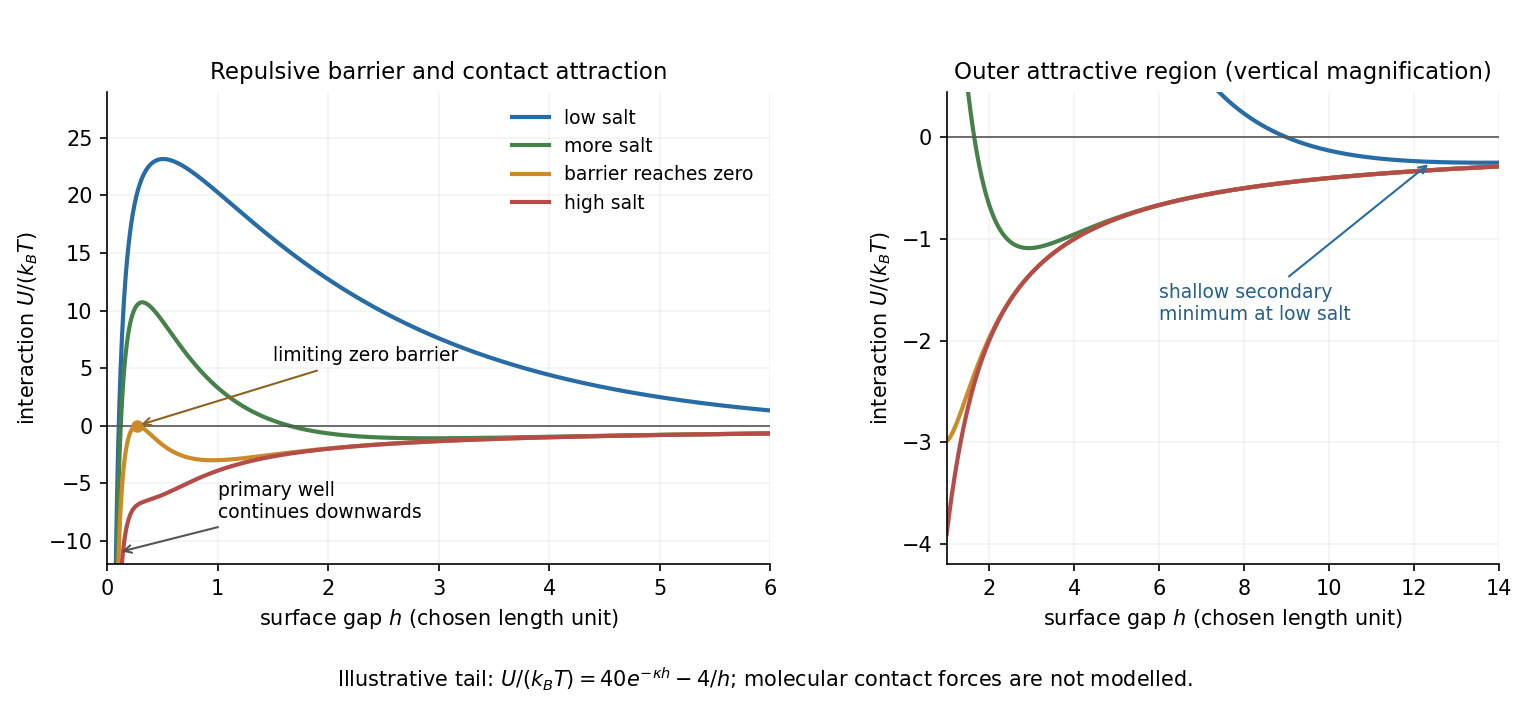
Original schematic DLVO potentials as screening increases
. Illustrative dimensionless amplitudes show the barrier and outer attractive minimum; the near-contact primary well extends below the plotted range. These curves do not determine a material-specific coagulation concentration. Details.
Aggregate structures. Well above the critical coagulation concentration, the sticking probability is close to one. In diffusion-limited cluster aggregation, the first encounter attaches particles or clusters at accessible outer branches before they can explore many alternative configurations. The result is an open, tenuous structure. Typical ideal three-dimensional cluster models have mass fractal dimension .
Near the threshold on its lower-salt, slow-aggregation side, a remaining barrier makes most encounters unsuccessful. Reaction-limited cluster aggregation then permits repeated approaches and orientations before attachment, commonly giving denser clusters with . Since particle count scales as , the larger exponent means more particles at a given large cluster size. This explanation does not require already formed bonds to rearrange: unsuccessful encounters themselves alter which configurations eventually bind.
The side of the threshold matters. At the ideal barrier-free threshold itself, or just above it, aggregation can already be diffusion limited; proximity to the critical coagulation concentration alone does not universally imply a denser reaction-limited structure. The quoted dimensions are typical of irreversible approximately isotropic cluster models, not exact values for every colloid. Strong bond rearrangement or anisotropic attractions can change this comparison.
Past exam of the soft condensed matter course of the University of Cambridge 2017 3 b Solution 2026-10-18
Diffuse-interface free energy. A sharp boundary assigns one mathematical surface to two uniform fluids. Molecular mixing instead changes composition over a finite distance. In square-gradient theory of a liquid interface, let be a dimensionless local composition and writeThe bulk free-energy density favors the equilibrium phase compositions, while the gradient term penalizes changing composition too abruptly. Since has units and is dimensionless, has units . The theory balances bulk mixing cost against this smoothness cost, rather than imposing a zero-width surface from the start.
At coexistence the two compositions have a common-tangent construction for phase coexistence. Subtract this tangent from to define an excess grand-potential density , zero at both bulk compositions. For a planar profile varying along , minimizing the excess free energy givesMultiply by and integrate using in the bulk:It follows that the interfacial surface tension isThis connects a continuous composition profile to a positive interfacial energy per area.
Broadening near criticality. Close to a symmetric mean-field thermodynamic critical point, an order parameter measuring departure from the critical composition has bulk densityThe coexistence values are , . The scalar quartic domain wall profile isThe curvature at either bulk minimum is , so the bulk correlation length is and this convention gives . As , the bulk distinction between phases weakens, its free-energy curvature and barrier decrease, and composition can vary gradually over an increasing distance at little bulk cost. The gradient penalty then favors a wider profile:The same model gives , which vanishes at criticality. The exponents here are mean-field results, not universal exact values for every real mixture.
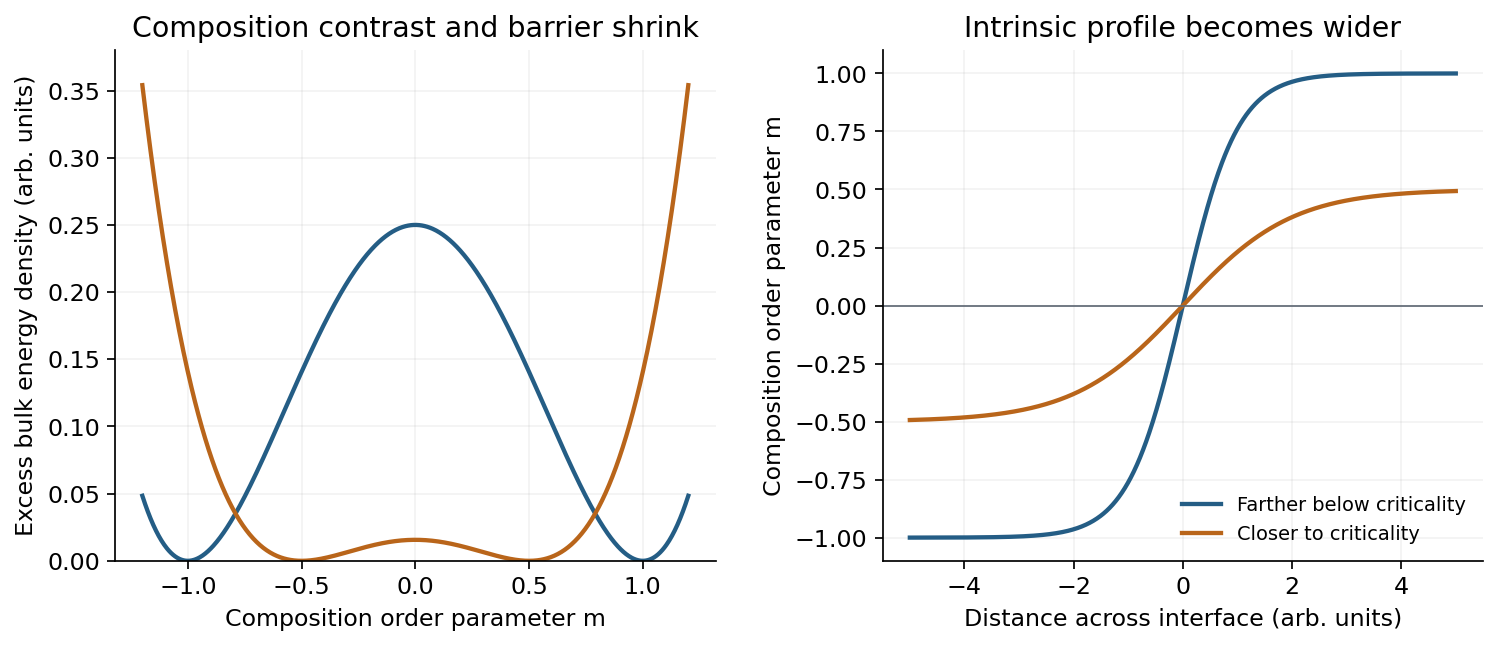
Approaching criticality reduces the composition contrast and broadens the equilibrium diffuse interface
. Details. 
The figure uses two illustrative parameter values in this quartic model, not experimental parameters supplied by the paper. In addition to the intrinsic gradient-theory width, thermal capillary waves move and roughen an interface. Their increasing amplitude as surface tension decreases can broaden the spatially averaged measured profile further. Thus a measured broad interface can include both intrinsic composition smoothing and long-wavelength interface-position fluctuations.
There are unlisted articles, also show them or only show them.