The goal of ecology is to explain where organisms live, how many there are, and how their interactions with one another and their surroundings change those patterns. Living partners include prey, predators and parasites; nonliving conditions include light, temperature and water. An ecosystem brings these interacting parts into one study system. See Clark, Douglas and Choi, Biology 2e, 44.1: the scope of ecology.
Start with an invented aquatic food web: photosynthetic algae feed zooplankton, which feed small fish, which feed large fish. That food chain has four feeding positions and three feeding arrows. Dead material also reaches decomposers through detritus, so the food web branches rather than forming a single ladder.
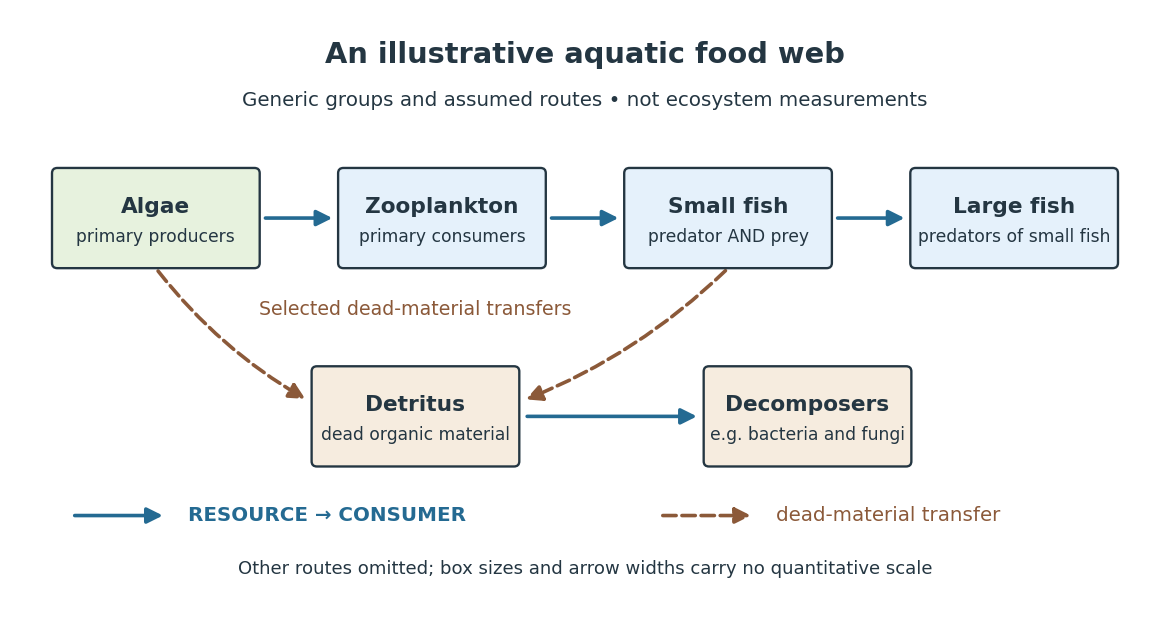

The appeal of ecology is that an organism's surroundings include other organisms that change those surroundings. Photosynthesis links light to living material; predation transfers that material between organisms; decomposers return its constituent chemical elements to forms that can be used again. These connections help explain why changing one part of an ecosystem can affect distant parts of its food web, although an arrow alone does not predict the size or even the direction of an indirect change. Population dynamics supplies quantitative tools when the question concerns changing counts.
In 1866, Ernst Haeckel's Generelle Morphologie der Organismen included a section titled Oecologie und Chorologie in volume 2, beginning on page 286. This places the terminology of ecology in an early systematic treatment of organisms and their relationships. See Haeckel, Generelle Morphologie der Organismen, volume 2 (1866), contents and p. 286. A later quantitative landmark is Raymond L. Lindeman's 1942 treatment of ecosystems through feeding relationships and energy flow. See Lindeman, The Trophic-Dynamic Aspect of Ecology, Ecology 23 (1942), 399–417.
A biological population is a set of organisms of a species occupying a specified area or experimental setting at a specified time. State the boundary for the question being studied: a flask, a breeding locality, or a wider region connected by gene flow. A biological population need not be perfectly mixed or isolated.
An ecosystem is a system of interacting organisms and their nonliving surroundings. A pond study might include algae, fish, bacteria, water, dissolved chemical compounds and incoming light. The useful step is to state the boundary and time interval: the pond surface, bottom and shoreline might enclose the study region, but water, organisms and energy can cross them. The chosen boundary specifies what counts as internal storage, input or output; it does not make the ecosystem sealed. See Clark, Douglas and Choi, Biology 2e, 46.1: ecosystems and their components.
For a toy pond water budget over one day, begin with , add crossing inward, and remove crossing outward. With all other transfers omitted by assumption, the final amount is . The same bookkeeping asks whether a change inside an ecosystem came from internal processes or exchanges with its surroundings. Changing the boundary to include an upstream reservoir changes which transfers are internal, while preserving the accounting.
A primary producer builds organic chemical compounds from inorganic sources. Photosynthetic algae, plants and cyanobacteria use light energy for this role through photosynthesis and carbon fixation. The role supplies new living material to a food web; it does not mean that the organism creates energy.
A consumer obtains organic material by feeding on other organisms or their products. A consumer feeding on primary producers is a primary consumer; one feeding on primary consumers is a secondary consumer. These names describe positions in a food chain, rather than permanent labels for a species.
A decomposer breaks down dead organic material and absorbs products of that breakdown; many bacteria and fungi perform this role. Decomposers connect detritus from different trophic levels to material recycling, so placing all decomposers at one final step of every food chain is misleading. See Clark, Douglas and Choi, Biology 2e, 46.1: grazing and detrital food webs.
An omnivore feeds on both primary producers and consumers. Its mixed diet explains why a trophic level need not be a whole number or a fixed label throughout an organism's life.
Detritus is nonliving organic material, including dead remains and organic wastes. It is a resource for decomposers, not itself an organism or a predator. In the illustrative food web, the dashed arrow from algae to detritus denotes a material transfer; the solid arrow from detritus to decomposers denotes resource use.
A trophic level describes feeding position relative to primary producers. Assign primary producers level 1; in the illustrated food chain, zooplankton occupy level 2, small fish level 3, and large fish level 4. Following a single feeding path adds one level at each step. The labels make dependence on the initial resource visible, but a branching food web can give an organism several feeding paths. See Clark, Douglas and Choi, Biology 2e, 46.1: feeding positions and branching food webs.
An omnivore can obtain food from more than one trophic level. As an explicitly assumed diet-weighted example, suppose an omnivore gets half its assimilated food energy from level-1 primary producers and half from level-2 consumers. Define its trophic level as one plus the weighted mean level of its food: . This computed position depends on the specified diet and weighting convention; it is not an immutable property of the species. A different life stage or diet can change it.
Energy flow tracks energy entering an ecosystem, passing through organisms and leaving its boundary. To see its quantitative effect, assume net production at one trophic level is and assume a transfer efficiency at each of two successive steps. Here measures the energy incorporated into new living material per unit area per day, after that level's own cellular respiration; it is not a count of organisms or a standing stock. The joule supplies the energy unit, with .
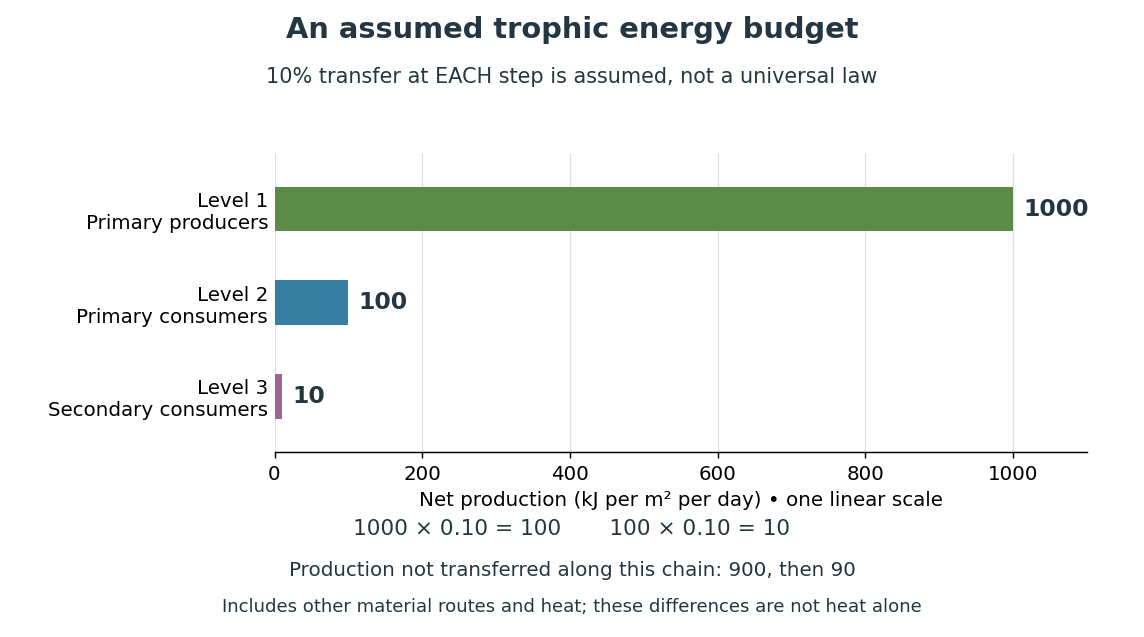

Only , or one percent, of the initial production reaches level 3 in this toy food chain. The first step leaves and the second outside the next level's new production. These differences can include uneaten material, wastes, and energy released as heat during cellular respiration; their separate amounts have not been assigned. Detritus can still carry energy to decomposers. The 10 percent efficiency is an assumption, not a universal law: transfer efficiencies vary with the organisms, food and conditions. The production ratio also differs from the fraction of an individual meal converted into growth. See Clark, Douglas and Choi, Biology 2e, 46.2: production and transfer efficiency.
The shrinking budget explains why supporting another trophic level requires enough production below it. It does not prove an exact maximum length for every food chain, particularly when a food web imports resources or has branching diets. Lindeman's 1942 paper grouped feeding relationships into trophic levels, compared transfers and cellular respiration, and emphasized the ecosystem as a unit connecting living and nonliving components. That viewpoint made different organisms comparable through a common energy budget. See Lindeman, The Trophic-Dynamic Aspect of Ecology (1942).
Material recycling and energy flow describe different bookkeeping. Carbon, nitrogen and phosphorus can be reused through chemical reactions and transfers between organisms and their surroundings. Energy transferred as heat is conserved, but is no longer the same store of chemical energy available to a consumer; photosynthetic primary producers need continuing light input. A decomposer helps recycle material and also releases heat through metabolism. Thus loss from one feeding budget means transfer into other forms or routes, never destruction of energy. See Clark, Douglas and Choi, Biology 2e, 46.3: material cycles. Conservation of energy applies to the whole accounting.
Zooplankton are drifting aquatic consumers, including small animals. In the illustrative food web, the chosen zooplankton feed on algae and serve as prey for small fish; this assumed diet is not a claim about every kind of zooplankton.
Endosymbiosis is an ecological association in which one organism, the endosymbiont, lives inside another. The definition specifies location, not that both partners benefit, nor that the internal partner has become an organelle. An intracellular association can remain an association between distinct organisms. Endosymbiotic theory addresses a different question: how particular ancestral bacteria became inherited, functionally integrated organelles during evolution.
The striking consequence is that a eukaryotic biological cell can combine histories: its nuclear lineage and its mitochondria need not have the same ancestry. Mitochondria have bacterial ancestry related to Alphaproteobacteria; the plastids of plants and many algae, including chloroplasts, have ancestry within cyanobacteria. These are ancestral lineages, not a claim that a named living bacterial species is the literal ancestor. Present-day bacteria and organelles have both evolved since their shared ancestors. [ref]
Origin and Evolution of Plastids and Photosynthesis in Eukaryotes by Geoffrey I. McFadden. Opening paragraphs and “The endosymbiont: when and who?”: bacterial origins and uncertainty about closest relatives
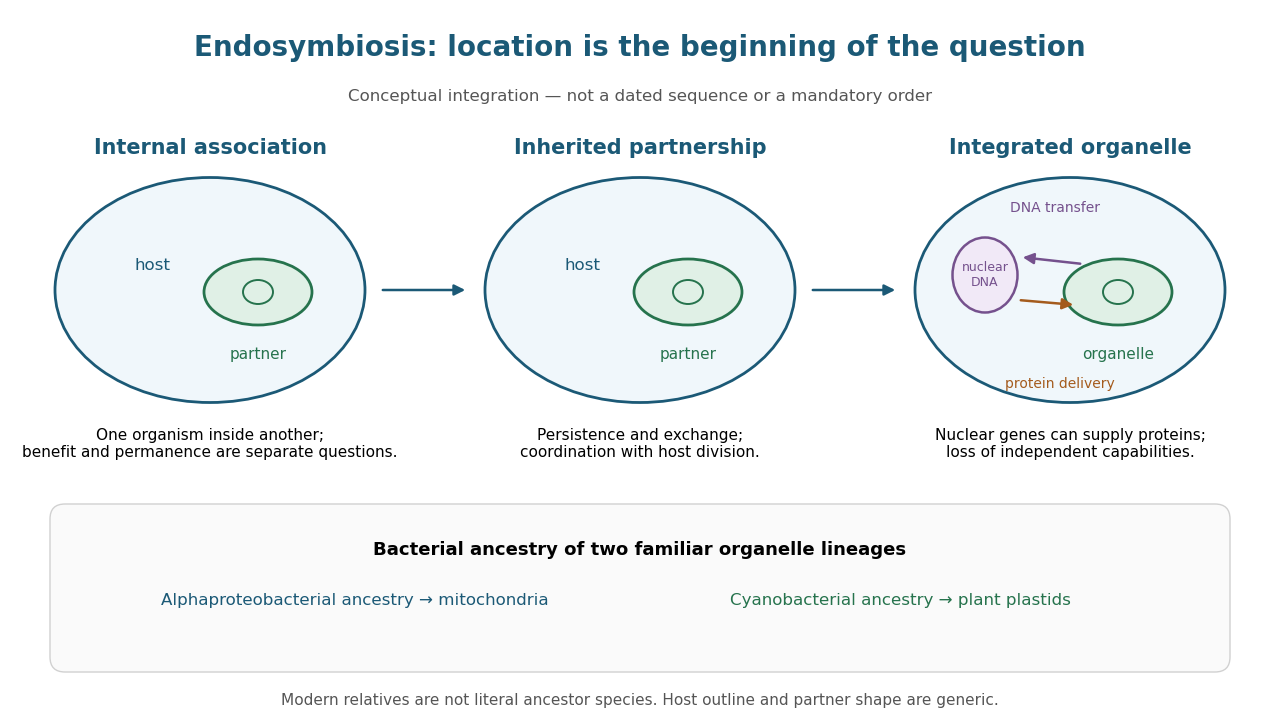
From an internal partner to an integrated organelle
. Original conceptual schematic, not an observed historical sequence. Persistence, metabolic exchange, endosymbiotic gene transfer, organelle protein import and coordination of division illustrate integration; they are not dated stages in a compulsory order. The illustrated partner is generic, and the host outline does not specify the ancestral host of mitochondria. The protein-delivery arrow abbreviates nuclear gene expression, biological translation in the cytosol and organelle protein import; it does not place protein synthesis inside the cell nucleus. Details.
An endosymbiont is the internal partner in an endosymbiosis. Calling an organism an endosymbiont does not by itself classify it as an organelle or imply an irreversible evolutionary transition.
Endosymbiotic theory explains the bacterial origins of mitochondria and plastids through enduring internal associations and subsequent integration. Survival inside a biological cell is only part of the problem: exchange through membrane transport, inherited division, gene expression and delivery of required proteins must work together. The elegance is evolutionary reuse of an existing cellular capability, followed by changes that make the partners operate as one system. [ref]
Origin and Evolution of Plastids and Photosynthesis in Eukaryotes by Geoffrey I. McFadden. Abstract and “How to tame your symbiont”: metabolic, genetic and division integration
The historical On the origin of mitosing cells by Lynn Sagan (1967, abstract and Introduction, pp. 225–226) synthesized a symbiotic account of eukaryotic origins and proposed tests using molecular evidence. Its Introduction explicitly acknowledged earlier proposals. It also hypothesized origins for other structures; the modern evidence for mitochondria and plastids should be assessed separately from the rest of that historical scheme.
Resemblance is a clue, not sufficient evidence of common descent. A small size, two surrounding membranes, division, retained DNA or bacterial-looking ribosomes does not uniquely identify an ancestor. Internal membranes exist outside these organelles, and a similar function can favor similar structures. The stronger question is whether independently examined molecular characters support the same historical relationship.
A concrete genomic observation is the mitochondrial sequence reported in 1997 for Reclinomonas americana: base pairs containing 97 identified genes, including four for a bacterial-type multisubunit RNA polymerase. This is a reported genome inventory, not a calculation from the pictured shape of a mitochondrion. Retention of such bacterial features strengthens the ancestry argument; a living Reclinomonas americana is not itself an ancestral eukaryote. The inspected abstract supplies these observations but not the detailed sequencing protocol or contamination controls, so those details are not attributed to this report here. [ref]
An ancestral mitochondrial DNA resembling a eubacterial genome in miniature by B. Franz Lang and others. Abstract, Nature 387 (1997), pp. 493–497: genome length, gene inventory and bacterial-type RNA polymerase
A sequence-based investigation obtains nucleotide sequences by DNA sequencing, identifies comparable genes, makes a sequence alignment and uses phylogenetics to infer relationships. The readout is a proposed relationship with support and uncertainty, not a photograph of an ancient encounter. Comparisons of plastid sequences with bacterial sequences support cyanobacterial ancestry, while the exact closest sampled cyanobacterial group has depended on the chosen data and inference. A bacterial affinity in one gene is weaker than coherent evidence across several genes and cellular systems. [ref]
Origin and Evolution of Plastids and Photosynthesis in Eukaryotes by Geoffrey I. McFadden. “The endosymbiont: when and who?”: alternative phylogenetic placements and lateral gene transfer
For such an analysis, useful checks include distinguishing organelle DNA from bacterial contamination, verifying sequence quality, comparing corresponding rather than unrelated genes, sampling several bacterial groups and testing sensitivity to the sequence alignment and evolutionary mathematical model. These are methodological requirements, not a claim that this article has rerun a particular published analysis. Horizontal gene transfer, gene loss and unequal evolutionary change can make an individual gene's history differ from a whole organism's history. A supported bacterial origin therefore need not identify an extant donor species, an exact date or the original mode of entry. [ref]
Origin and Evolution of Plastids and Photosynthesis in Eukaryotes by Geoffrey I. McFadden. “The endosymbiont: when and who?”: ancient origin and confounding lateral transfer
Endosymbiotic gene transfer moves genetic material from an endosymbiont or its descendant organelle into the host genome, notably the nuclear genome. A transferred DNA segment can remain silent. For a transferred gene to replace an organelle-encoded function, nuclear gene expression must work and its protein must reach the right compartment through organelle protein import. Transfer of DNA and transport of proteins are distinct processes in opposite directions. [ref]
Experimental Reconstruction of Functional Gene Transfer from the Tobacco Plastid Genome to the Nucleus by Sandra Stegemann and Ralph Bock. Introduction, p. 2869, and Discussion, p. 2875: transferred sequences and the additional targeting problem
Gene loss and endosymbiotic gene transfer are different: absence from an organelle genome does not by itself show that a functional nuclear copy exists. Conversely, an imported protein may derive from a host gene rather than a transferred gene. The surviving organelle genome is therefore a partial record, not a complete inventory of either ancestral bacteria or the modern organelle's machinery. [ref]
Origin and Evolution of Plastids and Photosynthesis in Eukaryotes by Geoffrey I. McFadden. “How to tame your symbiont”: losses, transfers, host recruitment and repatriation of proteins
Experimental Reconstruction of Functional Gene Transfer from the Tobacco Plastid Genome to the Nucleus by Sandra Stegemann and Ralph Bock (2006, Results, pp. 2870–2874) separated relocation of DNA from activation of a relocated gene. Engineered tobacco chloroplasts carried an nptII gene with nuclear expression signals beside an aadA gene with plastid expression signals. Selection on kanamycin recovered plants with the segment in the nuclear genome. Crosses then replaced the engineered chloroplasts with ordinary chloroplasts: the nuclear segment remained, but the plants were initially sensitive to spectinomycin and streptomycin. The transferred aadA gene was not yet functional in its new setting.
Leaf pieces were cultured on regeneration medium containing both drugs. Resistant regenerated plants supplied the functional readout. Using both drugs reduced selection of spontaneous plastid mutations conferring resistance mainly to one drug. Reciprocal crosses and selfing distinguished maternal plastid inheritance from nuclear Mendelian segregation; eight of sixteen initial candidates had the latter pattern. [ref]
Experimental Reconstruction of Functional Gene Transfer from the Tobacco Plastid Genome to the Nucleus by Sandra Stegemann and Ralph Bock. Figure 1, Tables 1–2 and Results, pp. 2870–2871: selection, eliminated candidates and inheritance controls
The molecular readout came from RNA hybridization and DNA sequencing. A Northern blot detected aadA messenger RNA in activated lines, with different transcript sizes. Thermal asymmetric interlaced polymerase chain reaction recovered upstream DNA; products present in activated lines but absent in original-line and ordinary-plant controls were sequenced. The mapped rearrangements connected aadA to the upstream nuclear gene promoter. Thus resistance, inheritance, RNA detection and changed nucleotide sequences supported activation of the transferred nuclear gene, rather than resistance alone. [ref]
Experimental Reconstruction of Functional Gene Transfer from the Tobacco Plastid Genome to the Nucleus by Sandra Stegemann and Ralph Bock. Figures 3–4, Results, pp. 2872–2874, and “PCR and DNA sequencing”/“TAIL-PCR”, pp. 2876–2877
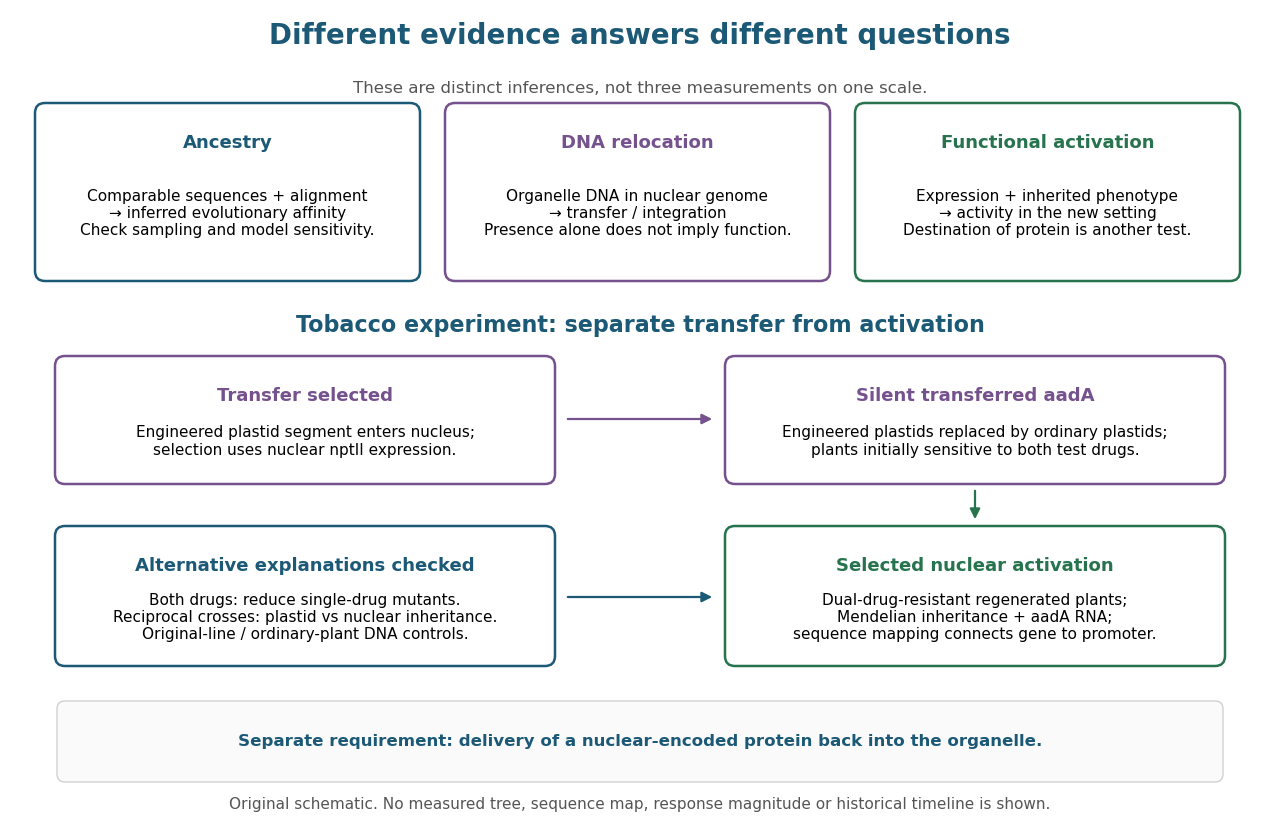

This engineered test demonstrates one route to functional nuclear gene expression after plastid DNA transfer. It does not establish a natural transfer rate, replay ancient endosymbiosis or demonstrate that the resulting protein is imported into a chloroplast. The authors explicitly identify acquisition of targeting information as an additional step not reproduced by this experiment. [ref]
Experimental Reconstruction of Functional Gene Transfer from the Tobacco Plastid Genome to the Nucleus by Sandra Stegemann and Ralph Bock. Discussion, p. 2875: antibiotic selection and missing transit-peptide acquisition
Parasitism is an interaction in which a parasite obtains resources from a host, reducing some component of the host's performance. Its demographic effects depend on exposure, within-host processes and transmission opportunities.
A parasitoid develops on or in a host and eventually kills it. Host-parasitoid transmission therefore has different offspring accounting from ordinary predation or a nonlethal parasite-burden model.
A biological host provides the environment or resources used by a parasite or other associated organism.
A parasite is an organism benefiting from parasitism. Microparasite and macroparasite distinguish useful transmission-model descriptions of within-host multiplication and distributed parasite burden.
A macroparasite is typically modelled using the number of parasites carried by each host. Adult parasitic worms illustrate why within-host parasite burden, developmental stages, mating and host exposure heterogeneity matter beyond an infected/not-infected classification.
The within-host parasite burden is the number of parasites, or a specified parasite-load measure, carried by one host. A population's mean burden and its infected-host prevalence are different summaries of the burden distribution.
A microparasite is typically modelled as multiplying rapidly within a host, so infection status rather than the exact organism count is the first between-host state variable. SIS model, SIR model and SEIR model descriptions are examples. Additional within-host structure can still be required.
Predation is the consumption of prey by a predator, affecting the demographic rates of both populations.
In the usual animal-feeding sense, a predator kills and eats its prey. This distinguishes the interaction from feeding on already-dead material and from the prolonged exploitation of a living host in parasitism. In the illustrative food web, a small fish eating zooplankton is a predator; a large fish eating that small fish makes the same small fish its prey. These roles belong to a particular interaction. See Clark, Douglas and Choi, Biology 2e, 45.6: predation and community interactions.
For a toy count, suppose 50 small fish begin a day and 8 are eaten by large fish. With births, other deaths and movement explicitly omitted, 42 small fish remain, and the fraction removed by predation is . This measures removal of prey, not production of new predators. Food intake can support survival and reproduction, but eight meals do not imply eight new predators; energy flow and life-history details intervene. Lotka-Volterra equations provide one idealized account of such population dynamics, rather than a guarantee that every interacting pair must cycle.
Prey is an organism consumed by a predator in predation. The name describes the receiving end of that interaction: a small fish can be prey for a large fish while being a predator of zooplankton. In a food web drawn with resource-to-consumer arrows, a feeding arrow goes outward from the prey toward its predator. This convention makes the route of food and energy easy to follow.
A predator is an organism that consumes prey through predation. A predator need not occupy the highest trophic level of an ecosystem, and the label does not specify its size or guarantee that it has no predators of its own. In the illustrative food chain, the small fish is a predator at level 3 and also prey for the large fish at level 4. Separating these relational labels from species names prevents a misleading division of the world into permanent predator and prey categories.
Articles by others on the same topic
There are currently no matching articles.