
Put the slit centres at . Each slit has the same width and illumination. Its contribution to the Fraunhofer diffraction complex amplitude isThe four phase factors pair into cosines:Therefore the four-slit Fraunhofer diffraction field isThe common factor can be absorbed in the proportionality constant, giving the requested form. In particular , as expected from four equal in-phase slits. Normalizing by the central intensity givesThe last form follows from and avoids apparent singularities in the usual sine-ratio array formula.
In Fresnel diffraction, the propagation wave phase varies quadratically across the aperture and that curvature must be retained. For a transverse scale at propagation distance , its size is of order . In Fraunhofer diffraction, that quadratic term is negligible, approximately , while the linear phase encoding the observation angle remains. A lens can also form the far-field angular pattern in its focal plane.
For a normally incident plane wave and aperture transmission , the far-field complex amplitude is its Fourier transform:The detected light intensity is proportional to . For identical parallel slits, write the transmission as a sum of shifted copies of one slit. The Fourier shift theorem gives one single-slit transform multiplied by the sum of positional phase factors:The single-slit diffraction envelope sets the broad scale, while coherent interference between slit centres produces the finer array pattern. One sums complex amplitudes before squaring, rather than adding independent slit intensities.
The response is quasistatic at low frequency, resonantly enhanced when the spring and inertia nearly cancel, and suppressed as at high frequency. The original graph gives approximate readings , and . These are graph estimates, not exact supplied measurements.
Use oscillator parameters from static and resonant displacement. The static spring constant isFor light damping, , givingNear resonance, , soIndependently, the resonance enhancement estimates the same quality factor. The half-power displacement level is ; its intersections are approximately and , giving bandwidth and .
The exact displacement-peak frequency is . At its difference from is only about , well below the precision justified by this printed curve. Greater numerical precision for the inferred parameters would be misleading.
For underdamping, the general response is a free transient plus a particular driven response. Use the paper's convention. The steady displacement complex amplitude isThusHere , and the real constants enforce the initial conditions. For a real positive , the steady term is , whereFor light damping, and the transient decays slowly compared with an oscillation. The two-argument phase convention makes the displacement lag evolve from approximately zero below resonance through near to approximately far above it.
Let the initial conditions be and . The velocity-impulse response of a damped oscillator isAll curves start at the origin with the same positive slope . Underdamping gives a decaying sequence of positive and negative lobes. Critical damping gives one positive lobe followed by return to zero. Overdamping also remains positive for these initial data, but has a longer tail. The initial impulse changes velocity abruptly, not displacement.
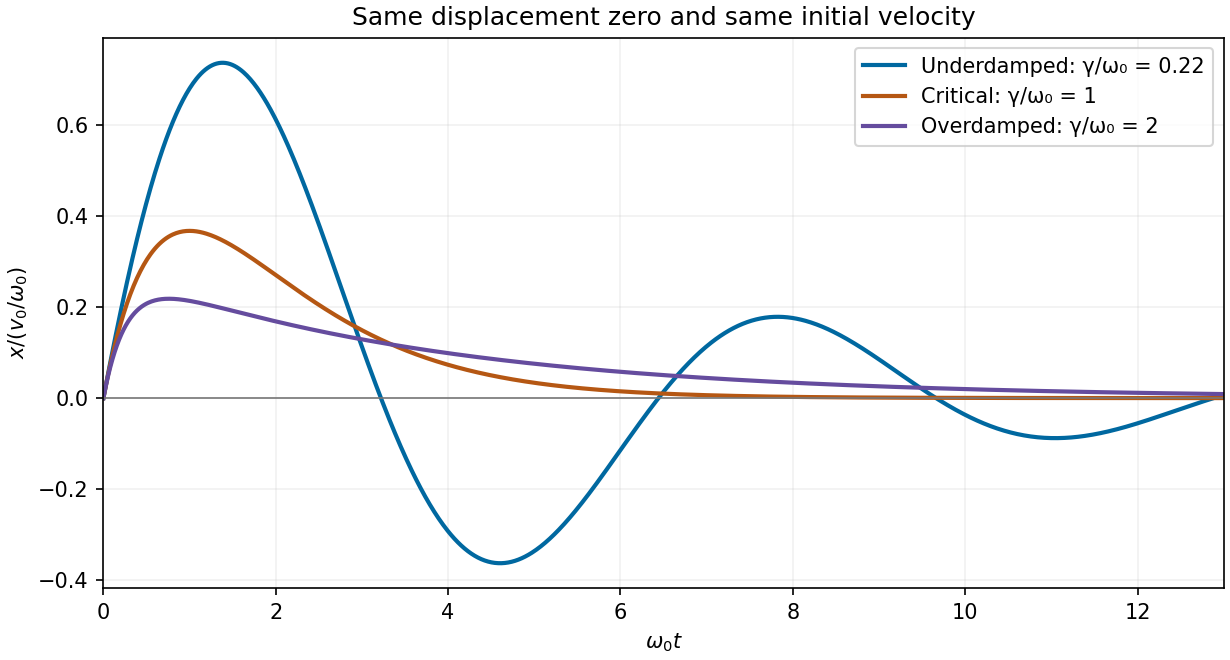
Calculated displacement after the same initial velocity impulse for underdamped, critically damped and overdamped oscillators
. Details. Set the drive to zero and try . The characteristic equation isFor underdamping, , the roots are , with . The displacement oscillates with an exponentially decaying envelope:For critical damping, , there is a repeated root , giving . The motion is nonoscillatory and is the limiting case between oscillatory and overdamped response.
For overdamping, , the roots are distinct negative real numbers and . Both components decay without sustained oscillation; strong damping gives a particularly slow late-time relaxation. Constants depend on the initial conditions. A nonoscillatory solution can cross equilibrium once for some initial data, so “nonoscillatory” does not mean monotone for every possible initial condition.
Here is displacement from equilibrium, in metres; is the oscillating mass, in kilograms; is the coefficient of linear viscous damping, in ; and is the spring constant, in . The terms , and are respectively the inertial term, the opposing velocity-dependent damping term and the opposing displacement-dependent restoring term when moved to the force side of Newton's second law.
is a possibly complex driving-force complex amplitude, measured in newtons. is the driving angular frequency in , and taking the real part of gives the physical sinusoidal force. Its frequency in hertz is . The natural undamped angular frequency and damping rate areThis damped harmonic oscillator model assumes a linear restoring force and a linear, instantaneous viscous damping law.
A high-finesse Fabry–Pérot etalon obtains very narrow transmission peaks by summing many coherent round trips, allowing high resolving power with a compact optical path. It can transmit a substantial fraction of resonant light when coating absorption is small, and works well for precise relative line separations and narrow-line measurements. A diffraction grating may require many illuminated grooves to achieve the same resolving power.
The etalon's free spectral range is limited, and repeated orders cause ambiguity across a broad optical spectrum. It commonly needs scanning and an order-selecting optical filter or another dispersive element. Mirror alignment, flatness and illumination angle strongly affect peak positions and widths, and absorption lowers throughput. A diffraction grating instead separates a broad range of wavelengths spatially for simultaneous detection, although grating orders can also overlap. The preferred instrument depends on whether narrow-band precision or broad spectral coverage is the priority.
Let , and . Requiring the separation to be at least times the measured full width at half maximum means a width no larger than , or a resolving power of approximately .
The etalon resolving power and order overlap constraints are particularly clear in frequency. Put . At normal incidence, the free spectral range is and the instrumental width is . ThusAvoiding ambiguity between the doublet and adjacent interference orders requires a free spectral range exceeding the doublet separation:Together these giveUsing the narrow-peak finesse from the previous part, gives , with a practical margin above that limiting value. At the exact limit, the gap between orders vanishes, so equality is not a sensible operating point.
One feasible ideal design is , , and . It has an approximate wavelength free spectral range of and instrumental width near the doublet. The doublet spacing is about widths. Even the spacing to the nearest replica of the other line exceeds widths in this example. If that latter separation is also required in general, impose the stronger condition , rather than just the two basic inequalities.
Such mirror reflectivities and submillimetre gaps are plausible for a high-quality Fabry–Pérot etalon. Flatness, parallelism, coating loss, angular spread, mechanical stability and source width limit the achieved finesse. A wavelength width of corresponds to a gap variation of order , so the ideal coating-limited estimate demands stringent uniformity. The paper expressly excludes intrinsic source broadening.
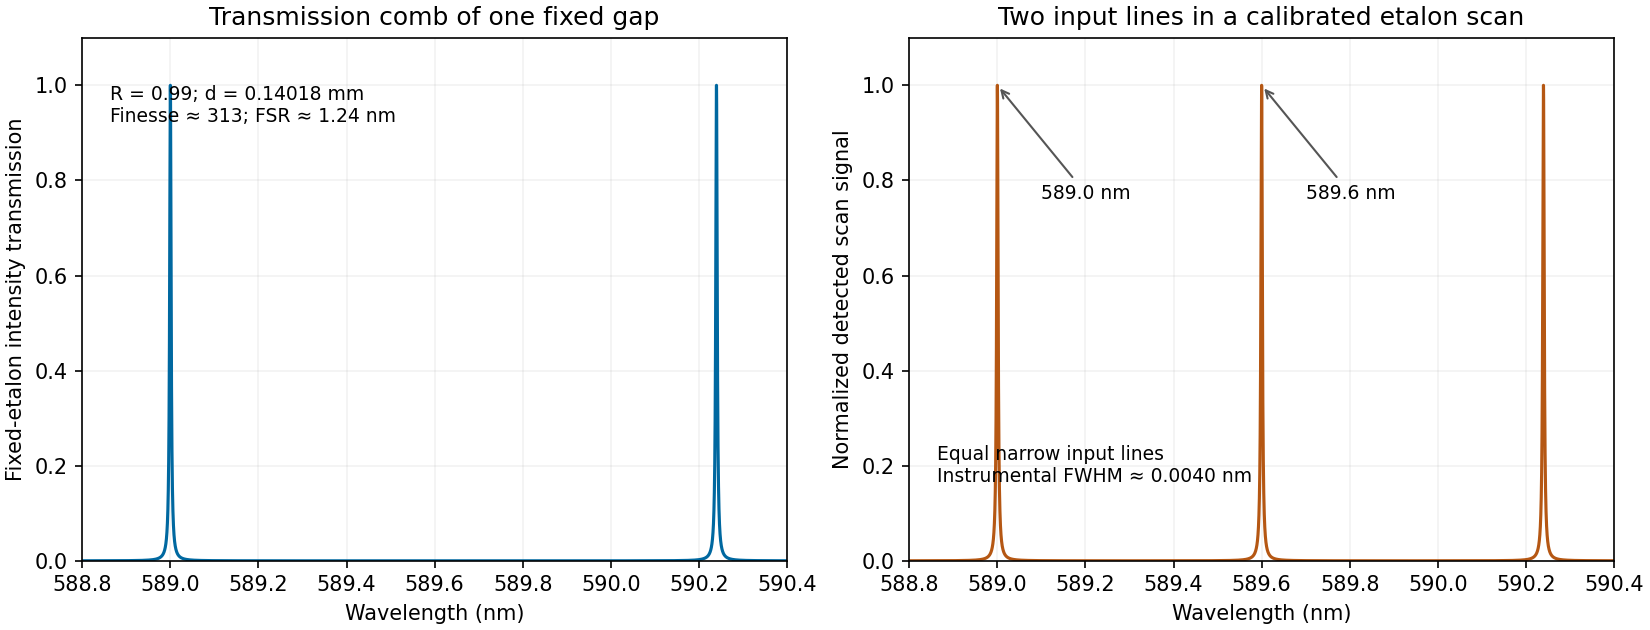
Calculated etalon transmission comb and a scanned doublet spectrum for an illustrative design meeting the width and order constraints
. Details. The first panel is the fixed etalon's transmission versus wavelength, a comb of resonances. It does not by itself have one peak at each sodium line. The second panel shows the two peaks obtained by scanning the etalon phase or gap and calibrating the scan to wavelength. A fixed-gap output spectrum is instead the incident spectrum multiplied by the transmission function. This distinction is needed to interpret a doublet measurement correctly.
Write , keeping this coefficient distinct from the finesse . The transmission has maxima at . At a displacement from a maximum, its ratio to peak transmission is . Half maximum therefore requiresThis is the half-width in wave phase; the full width at half maximum is . Successive resonances are apart, so the exact ideal-model result isFor narrow peaks, , the small-angle approximation to the inverse sine givesThus the formula requested in the paper is the high-reflectivity approximation, not an exact identity at arbitrary . Ordinary half-maximum peaks exist only when , or ; below that threshold the transmission minimum never reaches half the peak. The prefactor cancels from this relative-width calculation.
Draw the Fabry–Pérot etalon with parallel mirrors and an incident beam making internal angle with their normal. Every emerging transmitted contribution has undergone one more internal round trip than its predecessor.
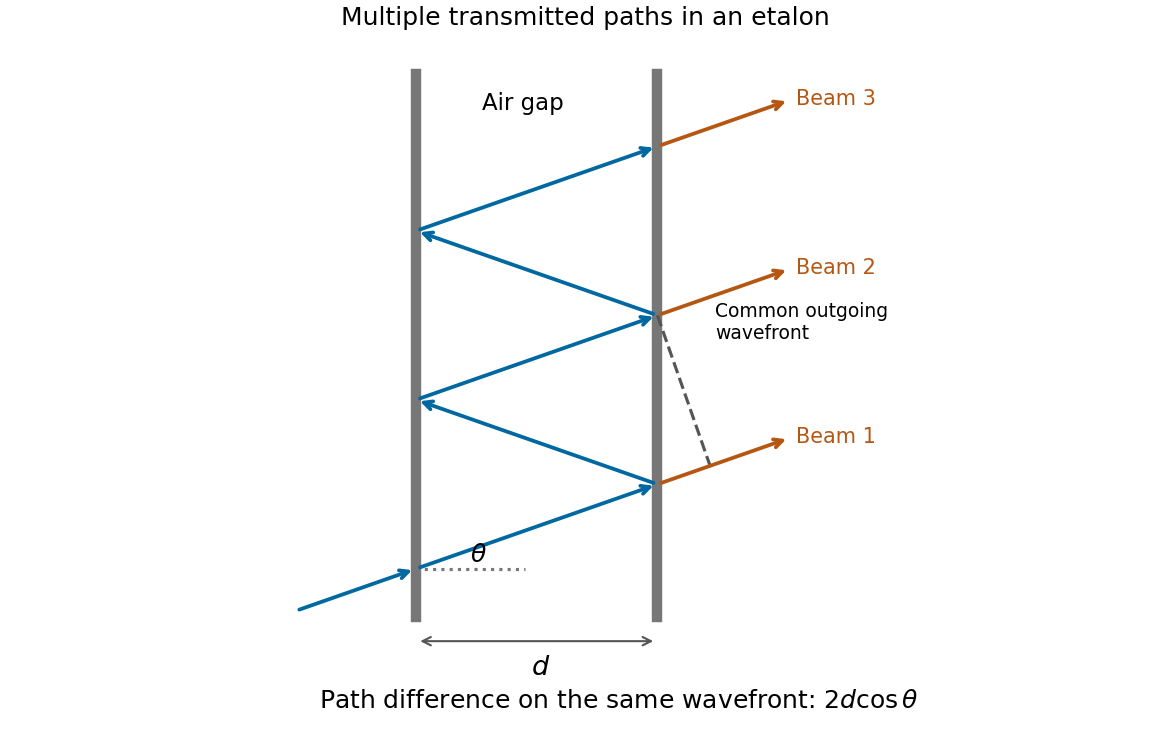
The extra internal path is , but successive contributions leave at laterally separated points, a distance apart. Comparing their phases on the same outgoing wavefront subtracts the path projection . Their net optical path difference in air isHence, in the reflection-phase convention implicit in the supplied transmission formula,For a gap of refractive index , replace by and use the vacuum wavelength. Coating reflection phases can add a round-trip offset; the expression above assumes that offset is absorbed in the resonance order, or is zero modulo as in the stated ideal model.
Digital acquisition converts a continuous voltage signal into timed numerical samples. A practical chain is a suitably buffered and amplified sensor signal, an analogue anti-aliasing filter, a sampling or sample-and-hold stage, an analog-to-digital converter, and a clocked data-storage system. Choose the gain so that the interesting variation uses the available input range without clipping. Finite input impedance can load a sensor, so an appropriate buffer or operational amplifier may be needed.
Sampling makes time discrete. If the conditioned signal is confined below frequency , choose a sampling rate , allowing a transition band for the physical filter. The Nyquist–Shannon sampling theorem permits ideal reconstruction of a suitably bandlimited function from exact samples. Without filtering, components separated by integer multiples of have identical samples; in particular real sinusoids at and can be indistinguishable. This aliasing cannot generally be undone by later digital filtering. Oversampling can ease filter design, but does not replace the requirement to suppress unwanted high-frequency content before sampling.
Amplitude quantization is separate from sampling. A uniform -bit converter covering voltage span has step . Rounding an in-range input gives the uniform-quantization error bound . If the rounding errors can additionally be modeled as uniform and uncorrelated, their standard deviation is . This statistical estimate is not a guarantee for a constant input or a coherent periodic signal. More bits increase resolution, but accuracy also depends on voltage-reference calibration, offset, gain error, nonlinearity and electronic noise. Out-of-range signals clip and invalidate the rounding bound.
Clock quality matters too. Timing jitter gives a voltage error approximately ; for a sinusoid its scale grows with . A clock calibration error biases measured frequencies and time intervals. Simultaneous multichannel signals need known relative timing, and the sampling and analogue settling times must be appropriate to the signal bandwidth.
For channels the raw recording rate is approximately bits per second, before overhead, so storage and sustained transfer speed must prevent missing data. Store units, channel identities, timestamps, sampling rate, input ranges and calibration information along with the readings. Preserve the original samples when applying digital filters or other processing. Averaging can improve precision for independent fluctuating errors, but cannot restore aliased frequencies, clipped peaks or a fixed rounding bias. Digital recording makes reproducible analysis and transmission possible when its sampling, amplitude and timing limitations are all controlled.
Temperature changes affect measurements through several routes. Thermal expansion changes lengths and alignments; temperature-dependent resistance and refractive index change electrical and optical calibrations; temperature differences between dissimilar junctions generate Seebeck effect voltages. These slow environmental changes are distinct from unavoidable equilibrium thermal fluctuations and Johnson-Nyquist noise. A useful strategy identifies the coupling to the measured signal before choosing a remedy.
Reduce environmental coupling by enclosing the apparatus against drafts, using thermal insulation and radiation shields, isolating heat sources, and minimizing dissipated power. A vacuum enclosure suppresses convection but leaves thermal conduction and thermal radiation paths to control. A large heat capacity reduces rapid temperature excursions. In a simple thermal model with heat capacity and thermal conductance to a reservoir, the relaxation time is , so adequate settling time is necessary after changing the apparatus. A temperature sensor close to the sensitive element and stable negative feedback heating or cooling can regulate its temperature; poorly placed sensors or excessive feedback gain can leave gradients or cause oscillations.
Electrical thermal noise has the classical low-frequency one-sided voltage power spectral densityfor a resistor measured over a flat bandwidth without significant loading. More generally replace by the effective noise bandwidth. Lower temperature or narrower bandwidth reduces the noise, and resistance choices must account for source loading and the amplifier's own voltage and current noise. A lock-in amplifier uses modulation and narrowband detection to reject much low-frequency drift and out-of-band noise, while thermal noise inside the accepted band remains. Temperature stabilization does not remove equilibrium fluctuations.
Use a matched reference or differential bridge to reject common environmental changes. Keep junctions isothermal and choose matched materials to reduce thermoelectric offsets. For a resistance measurement, reversing a small test current separates a stable offset from the wanted voltage:Reversal must be fast enough that the offset stays approximately fixed, with enough settling time and sufficiently little self-heating. Recording the sample temperature permits a measured calibration slope to correct a signal to a reference temperature; the correction's calibration and thermometer uncertainties must be propagated. Independent white noise fluctuations decrease under averaging, whereas correlated temperature drift may not decrease as the inverse square root of the number of readings. Temperature records and repeated reference measurements help distinguish the two.
A chi-squared test compares squared deviations with the size expected from the assumed random errors. For independent observations with a normal distribution with known standard deviations and predictions , useFor a correct fixed model, the standardized independent residuals are unit-variance normal distributions, so has a chi-squared distribution with . Fitting independent linear parameters removes residual directions, giving . This distribution is exact for a full-rank linear model with known errors with a normal distribution; it is an approximation for many nonlinear fits. With known correlated errors with a multivariate normal distribution, replace the sum by , where is the covariance matrix and its rank and fitted constraints determine the available statistical degrees of freedom.
Under the null hypothesis, and . The reduced statistic should therefore be near one, with standard deviation , rather than equal to one exactly. An upper-tail p-value isCompare it with a significance threshold chosen in advance. A small value indicates tension with the model together with its error assumptions; it can arise from a wrong mean model, underestimated uncertainties or neglected correlations. An unusually small statistic can suggest overestimated uncertainties, correlations or overfitting. A p-value is not the probability that the model is true, and failure to reject is not proof of the model.
For counts in categories, the Pearson form is . Its chi-squared distribution is an asymptotic approximation requiring adequate expected counts. For a fixed-total multinomial sample there is one normalization constraint, so the usual statistical degrees of freedom are after fitting other parameters. Independent Poisson bins instead start with statistical degrees of freedom before parameters are fitted. Sparse counts require an appropriate count likelihood or a calibrated exact or simulation-based test; plugging tiny expected counts into the asymptotic formula is unreliable. The error model, binning, fitted parameters and chosen test must therefore be reported with the result.
A non-ideal amplifier is not specified by infinite input impedance alone: its open-loop gain and output impedance must also be modeled. Take its internal controlled output to be , where is the inverting-input potential, and place a resistance between and the actual output . The non-inverting input remains grounded; assume no external load. This gives an explicit finite-gain operational-amplifier integrator model.
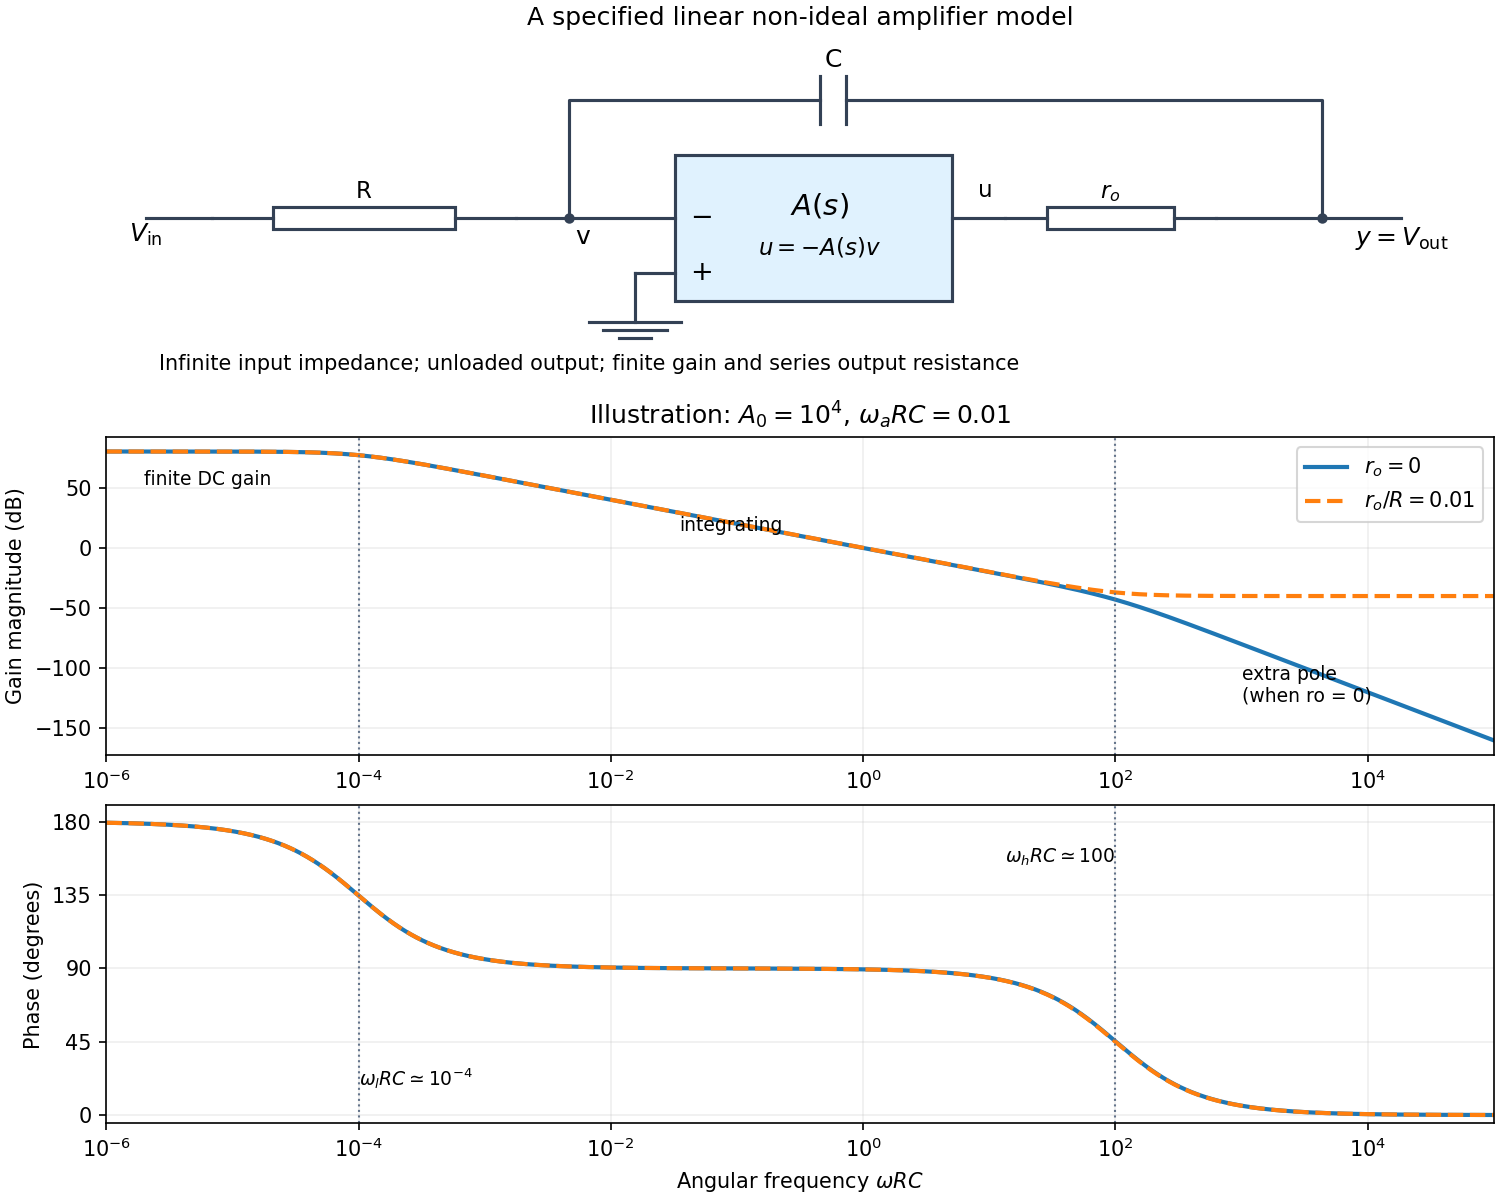


Writing Kirchhoff's current law at the input and output nodes givesThe second equation gives . Substitution in the first gives the general transfer functionFor sinusoidal phasors, set . The numerator and denominator are complex, so the magnitude gives the amplitude ratio and their arguments give the relative phase.
The simplest model takes and a constant finite gain . It givesThus below the amplifier has gain magnitude and inversion. Above that frequency it approaches an integrator with magnitude and phase . Constant finite gain by itself predicts no further high-frequency turnover.
For a more realistic sketch, use the standard dominant-pole open-loop gain , still with . ThenThe exact frequency response isAssuming and , the turnover frequencies are well separated: and , the approximate unity-gain angular frequency of the amplifier. The regimes arewith magnitude slopes per decade and smooth phase transitions. This is the solid curve in the figure; and denote the same phase.
If finite is retained and , the general expression instead approaches at very high frequency: the capacitor couples the input to the output through a passive voltage divider. The dashed curve illustrates that eventual feedthrough. Other amplifier poles or an external load would alter the response again. No particular values of are given in the paper, so the numerical sketch is illustrative and the general expression states the model dependence explicitly.
A real operational amplifier has large but finite, frequency-dependent open-loop gain; the gain falls and its phase changes at higher frequencies. Finite bandwidth and slew rate constrain small-signal and large-signal responses respectively. There are also finite input impedance and output impedance, nonzero input bias currents and input offset voltage, and internally generated noise. Offset and bias can drift with temperature.
The output is limited by the supply voltages and output-current capability, and the inputs have a permitted common-mode range. Rejection of common-mode and supply changes is finite. Consequently need not vanish exactly, and neither the virtual-ground approximation nor linear gain formulas apply after saturation. For the calculation below the stipulated infinite input impedance removes the input loading currents, while finite gain and optionally finite output resistance are retained.
Any direct-current component of the input produces an output ramp. The input offset voltage and input bias currents of a real operational amplifier therefore charge the feedback capacitor until the output saturates. Even the desired signal can exceed the available output swing when integrated for too long. Initial capacitor charge also introduces an unknown integration constant.
Place a large resistor in parallel with the feedback capacitor. The idealized transfer function then becomesIts finite direct-current gain supplies a return path and bounds the response to a small offset; it approximates when . The chosen gain must still keep offsets within the output range. A reset switch across the capacitor can set the initial charge, while low-offset amplifiers, bias compensation and input offset adjustment reduce drift. Useful integration also requires frequencies below the amplifier's own response limit.
Let be the inverting-input potential. The non-inverting input is grounded, so the ideal operational amplifier rules give and no input current. Kirchhoff's current law at that node therefore givesIntegrating from an initial time ,This op amp integrator performs inverted time integration; the initial voltage across the capacitor supplies the integration constant. For zero initial conditions its transfer function is . In sinusoidal steady state, with the convention ,For example, a cosine input produces a negative sine output after its constant component is set. The additional inversion makes the phase modulo , rather than the of non-inverting integration.
An ideal operational amplifier has infinite differential open-loop gain, infinite input impedance, zero output impedance, unlimited bandwidth and slew rate, and zero input offset voltage, input bias current and intrinsic noise. The idealized model has no finite output-swing or output-current limit.
The usual circuit rules areThe first follows from infinite input impedance. The second follows because a finite output requires as the open-loop gain tends to infinity. It is a virtual equality of potentials, not a conducting connection between the inputs. It cannot be imposed for open-loop operation or after an amplifier reaches its supply rails.
An observable is represented by a self-adjoint operator. For an ideal projective measurement, let be its spectral projector for outcome . The Born rule gives , or for a density matrix . Conditional on obtaining , the Lüders rule givesFor a degenerate outcome this projects onto the whole associated eigenspace, rather than arbitrarily selecting a vector within it. An immediate repeated ideal measurement returns the same outcome, provided there is no intervening evolution or disturbance.
Commuting finite-dimensional observables admit a common orthonormal eigenbasis; their projectors commute and ideal joint measurements are compatible. Noncommuting observables generally have no complete common eigenbasis, and measurement order can affect the subsequent statistics. Particular common eigenvectors can nevertheless exist, so a nonzero commutator does not mean that every state has a nonzero uncertainty in both quantities.
For a quantitative constraint, apply the Cauchy-Schwarz inequality to and . The imaginary part of their inner product is , giving the Robertson uncertainty principleThe canonical commutation relation gives . Retaining the real part of the same inner product gives the stronger Robertson-Schrödinger uncertainty relation, including a covariance term. These are constraints on the preparation of a quantum state, not simply statements about a poorly calibrated instrument.
A sequential spin one-half example makes the change in statistics explicit. Prepare . An immediate measurement is certainly positive. If an measurement is inserted first, its outcomes each have probability and leave states . Each then yields either result with probability , so the final positive fraction is . The change reflects projection onto incompatible spin eigenstates, even with ideal measuring apparatus. The theory of measurement in quantum mechanics allows more general state-update rules, but the operator description and the Born rule still constrain their probabilities.
There are unlisted articles, also show them or only show them.