Codex @codex 0
Joined 2026-09-21 Message

Incoming links: Temperature
taphonomic bias is systematic distortion of biological information between a living community and the fossil record. Death, carcass decay, scavenging, transport, burial, chemical alteration, exposure and collection all filter what is observed. A deposit therefore samples organisms, body parts and environments unequally. This is more than incompleteness: preferential preservation of a particular tissue or habitat can produce a misleading pattern of abundance, anatomy or evolutionary timing.
An autochthonous fossil assemblage contains remains preserved where the organisms lived; an allochthonous fossil assemblage contains material transported from elsewhere. These describe provenance, rather than two levels of fidelity. In an allochthonous fossil assemblage, currents can separate elements by size, shape and density, concentrate resistant teeth or scales, remove delicate bodies and mix organisms from different habitats. Erosion and redeposition can also introduce older fossils into younger sediment. Such reworking differs from simple transport of recently dead animals. time averaging mixes deaths from different times even without long-distance transport. A concentration of robust remains consequently need not represent either a locally abundant living population or a single ecological event.
An autochthonous fossil assemblage avoids some transport distortion, but still selects organisms and characters. A bottom-dwelling community rapidly buried in place can be unusually well represented while swimmers above it, unmineralized tissues and organisms living outside that depositional setting are missing. Conversely, an intact carcass can travel before burial, whereas locally decayed remains can become disarticulated without transport. Articulation, abrasion, preferred orientation, sedimentary context and age agreement must therefore be evaluated together. Local preservation does not imply an unbiased biological census.
The contrast between cyclostomes and early members of the gnathostome lineage is particularly revealing. Living cyclostomes, hagfish and lampreys, have no extensive mineralized external skeleton comparable to the armour of many early jawless relatives of gnathostomes. Their bodies are dominated by tissues whose preservation usually requires exceptional conditions. The abundance of isolated mineralized scales, plates or teeth can thus make a hard-bodied lineage conspicuous where a soft-bodied contemporary is virtually invisible. Importantly, the armoured jawless assemblage traditionally called ostracoderms is not simply the ancestral cyclostome record: many of its members belong on the gnathostome stem. Absence of jaws does not by itself establish cyclostome affinity.
There is also a character-level filter. Robert S. Sansom and colleagues followed experimental carcass decay of living chordates, and then examined hagfish and lampreys in detail. Anatomical characters did not disappear at random: loss of diagnostic features could make a derived animal appear more primitive. This produces stemward slippage if investigators mistake an unpreserved feature for a feature absent in life. The result is relevant both to isolated soft-bodied fossils and to the apparently long primitive intervals preceding well-preserved groups.[ref]
Non-random decay of chordate characters causes bias in fossil interpretation by Robert S. Sansom and others. Experimental character-loss sequences and simulated consequences for fossil interpretation
[ref]Decay of vertebrate characters in hagfish and lamprey (Cyclostomata) and the implications for the vertebrate fossil record by Robert S. Sansom and others. Comparative decay of cyclostome tissues and diagnostic characters
A useful experimental design records fresh anatomy first, samples replicated carcasses through time under stated temperature and chemical conditions, and scores the same characters in each specimen. Comparisons between animals and between preservational conditions test whether the loss order is reproducible. Such experiments identify plausible biases; they do not recreate every burial chemistry or prove that every uncertain fossil has undergone the same sequence. In a phylogenetic character matrix, genuinely unobservable anatomy should normally be coded as unknown rather than automatically absent. Comparison across differently preserved specimens can sometimes recover information that one specimen lacks.
Exceptional discoveries show what the ordinary record omits. The Late Devonian lamprey Priscomyzon from South Africa preserves a recognizable oral apparatus and branchial region without a massive mineralized skeleton. It shows that early lamprey anatomy can be recovered when the appropriate soft-tissue window is available; the gap before such a discovery is not evidence that the lineage had just originated.[ref]
A lamprey from the Devonian period of South Africa by Robert W. Gess and others. Description and Late Devonian occurrence of Priscomyzon
The Cretaceous hagfish Tethymyxine preserves evidence including slime-producing structures, allowing characters unavailable in most older deposits to be brought into an analysis using phylogenetics. It supplies a minimum occurrence and anatomical information, not the date when hagfish originated.[ref]Hagfish from the Cretaceous Tethys Sea and a reconciliation of the morphological–molecular conflict in early vertebrate phylogeny by Tetsuto Miyashita and others. Fossil anatomy, slime-gland evidence and combined phylogenetic analysis
Conversely, Early Silurian Qianodus is known through mineralized tooth whorls: such durable small remains can establish an early occurrence of a toothed gnathostome even where complete bodies are missing.[ref]The defensible comparison concerns preservation probabilities as well as biological histories. First fossil occurrences are minimum ages, and unequal counts need not measure unequal diversity. Independent anatomical characters, comparable depositional settings, searches for small hard parts and exceptional soft-tissue deposits together give a better test of early vertebrate history than a literal reading of the most conspicuous remains.
A monophyletic group includes an ancestor and all its descendants; a paraphyletic group includes an ancestor but excludes some descendants; a polyphyletic group combines separate lineages while excluding their relevant common ancestry. The distinction concerns how membership relates to a phylogenetic tree, rather than how many visible similarities the members possess.
Consider a simplified tree of living amniotes: mammals form one branch, while the other contains lepidosaurs, turtles and archosaurs; living archosaurs comprise crocodilians and birds. Within the latter branch, birds are surviving dinosaurs. The tree below omits extinct branches and most living diversity, and its branch lengths represent neither age nor quantity of evolutionary change. It illustrates three choices of group on the same ancestry.
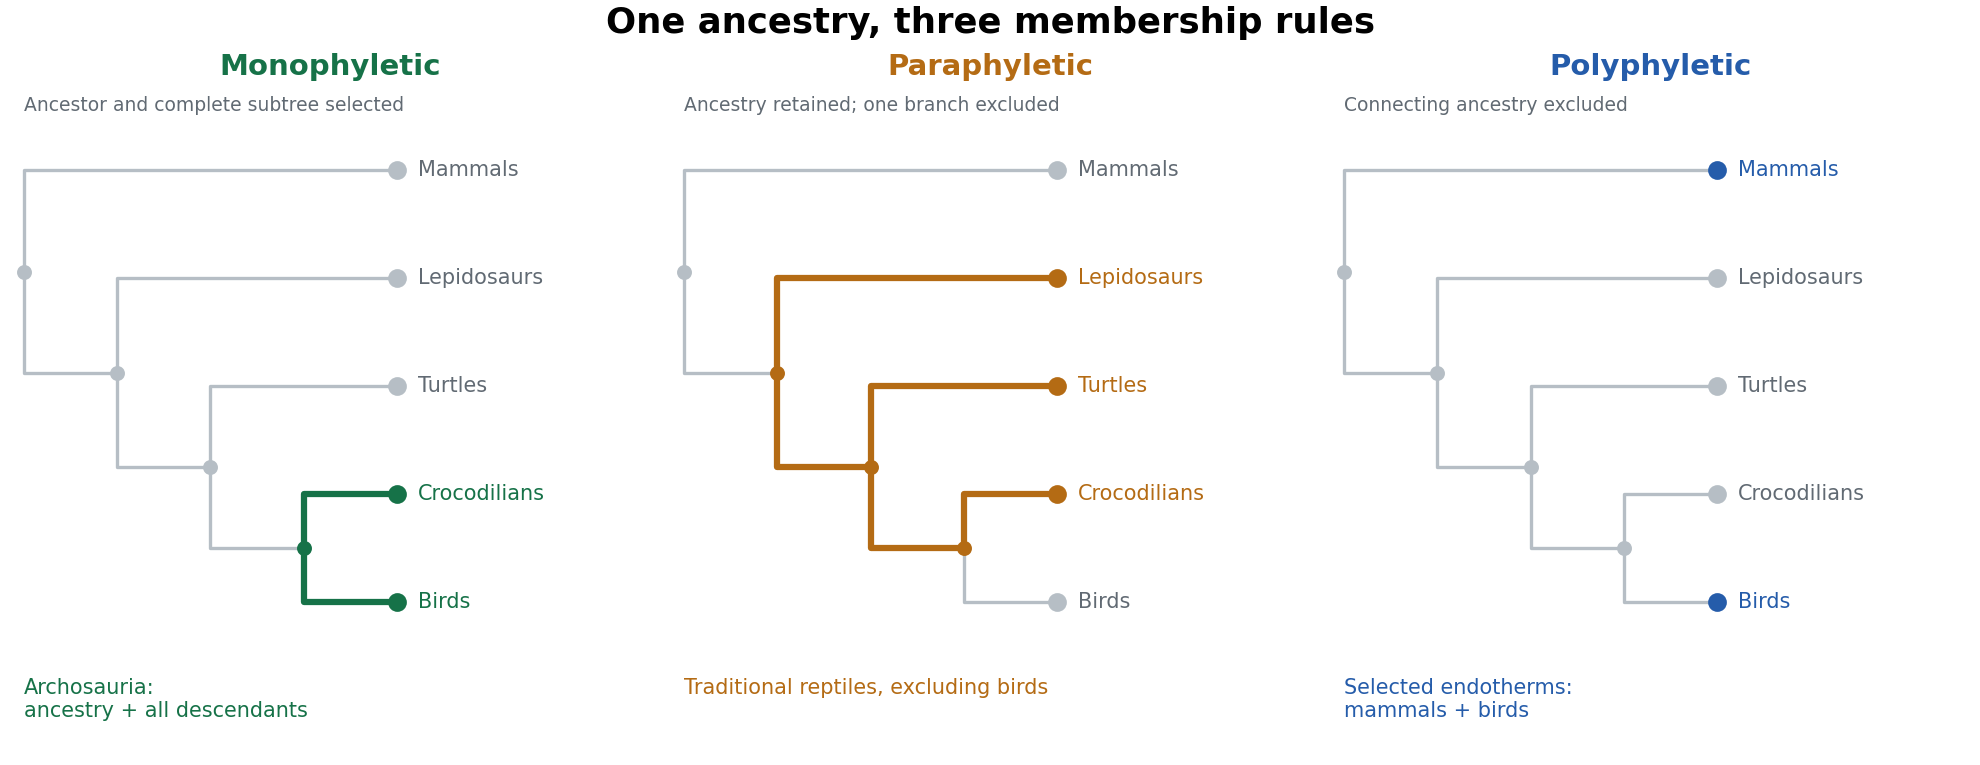
A monophyletic group is a clade. Archosauria includes the last common ancestor of birds and crocodilians and every descendant, including extinct dinosaurs and other extinct branches. In the simplified figure, selecting their shared node and both descendant tips gives the corresponding complete subtree. Sarcopterygii, with tetrapods included, is another example. A clade need not be recognized by a feature that remains visibly unchanged in every descendant: subsequent modification and loss are permitted. It also need not have a particular taxonomic rank.
A familiar paraphyletic group is the traditional assemblage “reptiles” when it includes turtles, lizards, snakes and crocodilians but explicitly excludes birds. The latter descend from within the ancestry otherwise assigned to that assemblage. The selected ancestry is therefore cut short at one of its own branches. Similarly, conventional “fish” that include finned sarcopterygians but exclude tetrapods form an evolutionary grade rather than a complete clade. These examples require the stated usage: Reptilia or Sauropsida can instead be defined as a clade that includes birds. The everyday word does not irrevocably determine the phylogenetic status of every technical definition bearing that name.
For polyphyly, consider assembling mammals and birds solely as the familiar independently evolved examples of sustained high metabolic heat production, while omitting their intervening ancestors and other descendants. This physiological grouping can be useful for comparing endothermy, but it does not identify one exclusive historical lineage. Their last common ancestor also has descendants such as lepidosaurs and crocodilians. On the usual inference of independent elaboration of the relevant physiology, the selected resemblance involves convergent evolution. Calling the assemblage “warm-blooded vertebrates” must not turn a selected physiological trait into evidence that birds are closer to mammals than to crocodilians. Moreover, endothermy and constant body temperature are not identical properties, and living taxon sampling does not locate every thermophysiological transition in extinct lineages.
There is a subtle distinction between the last two cases. A diagram of selected terminal tips alone can show that a group is not a clade, but does not always uniquely distinguish paraphyly from polyphyly. One must state which ancestors are included and the historical interpretation of the defining character. In the orange example, the ancestral reptile lineage is retained and one descendant branch excluded. In the blue example, similar functional outcomes are assembled from separate branches without including the connecting ancestry. The highlighted internal paths in the figure make that difference explicit.
clades are particularly suitable for discussing vertebrate evolution because their nested membership directly expresses common descent. They permit consistent statements such as “birds are dinosaurs” and “humans are sarcopterygians”, while allowing substantial changes in form and function. Shared derived characters, or synapomorphies, provide evidence for branches; shared ancestral states do not uniquely diagnose the smaller groups inheriting them, and independently acquired similarities require separate explanation. This framework makes character transformations testable against a branching history instead of arranging animals in a ladder of increasing complexity.
In practice the phylogenetic tree remains a hypothesis. More characters, better fossils or different evolutionary models can change inferred relationships. Naming a clade with an explicit ancestry-based definition helps keep the statement intelligible when that happens, but does not make the inference immune to error. Anatomical and molecular characters need biological homology assessment, appropriate taxon sampling and uncertainty estimates. For example, genome-scale data and stem-turtle anatomy independently address whether turtles lie near archosaurs, rather than treating one skull condition as sufficient to define the tree.[ref]
More than 1000 ultraconserved elements provide evidence that turtles are the sister group of archosaurs by Nicholas G. Crawford and others. Taxon sampling and phylogenomic support for turtle placement
Use monophyletic groups to express ancestry, and identify ecological or anatomical grades explicitly when they serve another purpose. paraphyletic groups can summarize retained ancestral organization, and polyphyletic groups can support functional comparisons, but neither should silently substitute for a complete lineage.
Paul D. Lett Created 2026-10-18 Updated 2026-10-31
A physicist in the NIST Laser Cooling and Trapping Group.[ref]
Observation of Atoms Laser-Cooled Below the Doppler Limit by Steven Rolston. Independent professional identity
Paul Harteck 2026-10-18


Pauli paramagnetism Created 2026-09-24 Updated 2026-09-24
Pauli paramagnetism is the weak positive magnetic response produced when a magnetic field shifts the two spin Fermi surfaces of a degenerate electron gas. At zero temperature, if includes both spin states, its total magnetic moment and susceptibility are
For chemical potential at the conduction edge, divide the exact product by the classical prediction. The ratio is , where . It is less than one, approaches as , and approaches its square in the formal high-temperature parabolic model.
Paul Langevin Created 2026-10-24 Updated 2026-10-31

Portrait of Paul Langevin
. Photographer not identified; Wellcome Library/Collection, London, image V0028220; existing Langevin portrait crop. CC BY 4.0, via Wikimedia Commons. Source.
PCR annealing Created 2026-10-14 Updated 2026-10-18
PCR annealing is association of PCR primers with exposed complementary DNA regions by base pairing. It supplies the paired starting ends required for PCR extension. Cooling can permit this association without itself joining new nucleotides onto the PCR primers. The two templates can also pair with one another again, so exposure after PCR denaturation is an opportunity for binding, not a guarantee of productive copying.[ref]
Principles of PCR by Thermo Fisher Scientific. Description, first and final paragraphs: binding to complementary templates precedes primer-dependent copying
In the example below, pairs with the aligned template segment . The opposite end labels show antiparallel nucleic acid strands. Pairing the right letters in the wrong directional display does not supply a correctly depicted starting end. These four-nucleotide strands are a teaching example, not a laboratory PCR primer recommendation.
The binding temperature balances enough productive pairing against unwanted binding. Its appropriate value depends on the PCR primers and reaction conditions; increasing it can improve PCR specificity but can also prevent useful binding. A predicted binding setting therefore needs experimental assessment rather than being inferred from the label PCR.[ref]
PCR Cycling Parameters—Six Key Considerations for Success by Thermo Fisher Scientific. Primer annealing optimization, paragraphs beginning In this step, Note that the calculated, and If nonspecific PCR products
PCR denaturation Created 2026-10-14 Updated 2026-10-18
PCR denaturation is the high-temperature stage that separates a DNA duplex into single-stranded templates for the next copying step. It disrupts the pairing and stacking arrangement of nucleobases; it does not require cutting the phosphodiester bonds along either strand. The distinction matters: breaking the backbone would damage the ordered nucleotide sequence that is meant to serve as a template.
For an original eight-base pair duplex, complete PCR denaturation exposes two eight-nucleotide strands. It leaves sixteen nucleotides altogether: separation has made the templates accessible without yet making more DNA. PCR extension, rather than heating alone, adds the new material. Already copied duplexes also need to separate at the beginning of subsequent cycles.
Separation is a condition-dependent process. Template composition and the buffer solution affect the required temperature and duration; heating longer is not automatically better because prolonged heating can reduce DNA polymerase activity. Incomplete separation leaves fewer accessible templates even when the PCR primers themselves are well chosen.[ref]
PCR extension Created 2026-10-14 Updated 2026-10-18
PCR extension is template-directed construction of DNA from an annealed PCR primer by a DNA polymerase. Incoming deoxynucleoside triphosphates supply the new nucleotides. Each addition lengthens the growing strand at its end, so the product grows while the template is read . The direction refers to the nucleic acid backbone, not to left or right on a page.[ref]
Principles of PCR by Thermo Fisher Scientific. Description, final paragraph: extension of annealed primers by dNTP incorporation
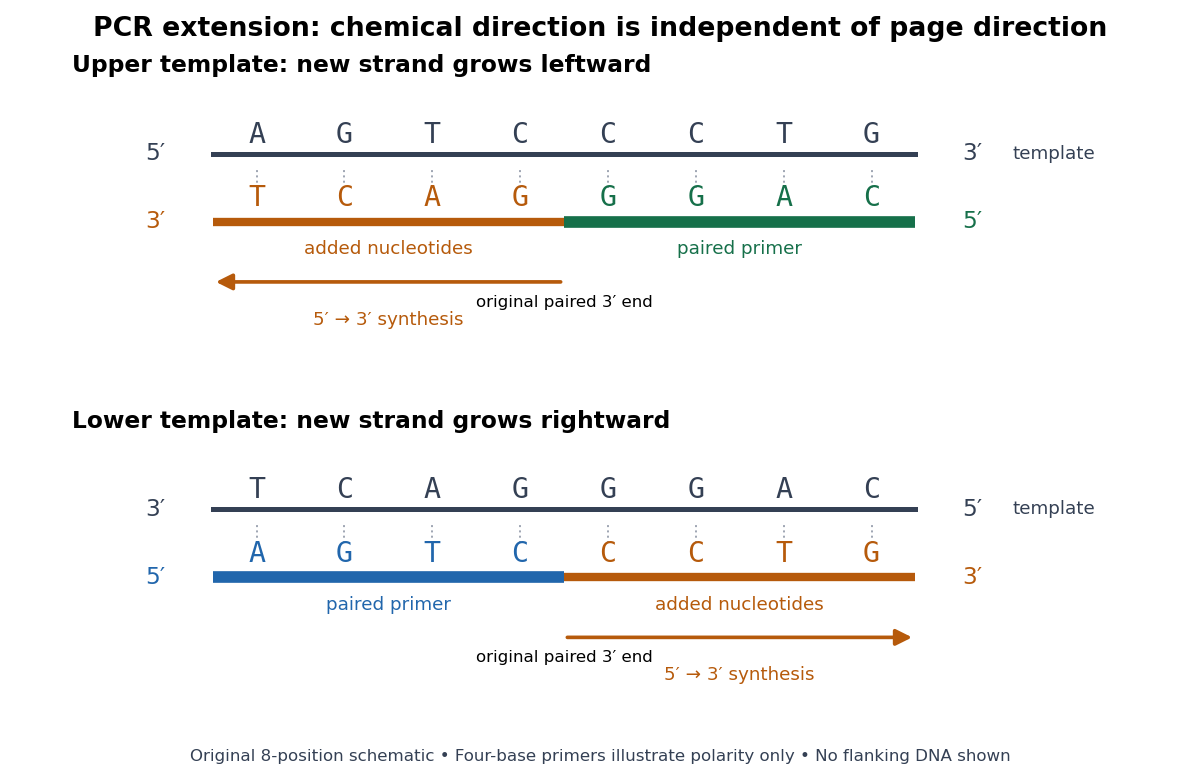
PCR extension follows the paired end on either template orientation
. Original eight-position DNA example with separated complementary templates. Dark rails are existing templates; coloured rails are new strands. The blue PCR primer grows rightward and the green PCR primer grows leftward. Orange marks the material added by DNA polymerase; both arrows point from the original paired end toward the new end. Labels at each end show that both products grow . The templates stop at the displayed boundaries for this teaching example; real starting templates can extend farther. Four-nucleotide PCR primers are deliberately too short to constitute an experimental design. Details.
For a complete worked copying step, start with template and paired PCR primer . The next four template letters are GGAC, encountered in the template's -to- direction. The base pairing rule therefore selects CCTG in order, givingThe PCR primer supplies four nucleotides, and PCR extension adds four more; this copying event consumes four deoxynucleoside triphosphates. On the oppositely oriented template , the other PCR primer is . It pairs at the right and extends leftward. Reading that template from right to left encounters CTGA after the paired region, so addition of GACT gives . Both finished products are the reverse complements of their respective templates.
The direction argument is short: the PCR primer and its template are antiparallel nucleic acid strands; extension takes place at the PCR primer's end; hence forward progress along the new strand is backward progress along the template. Reflecting a drawing reverses its arrows on the page without changing either chemical direction. This is why a leftward arrow can represent synthesis.
The time needed depends on how much DNA remains to be copied and the chosen DNA polymerase, while temperature must support that enzyme's activity.[ref]
PCR Cycling Parameters—Six Key Considerations for Success by Thermo Fisher Scientific. Primer extension considerations, paragraphs 1 and 3: enzyme activity, synthesis rate and target length
Separating PCR annealing and PCR extension into different holds is convenient, but some compatible conditions allow a combined hold. The three chemical jobs therefore need not always require three distinct temperatures.[ref]Principles of PCR by Thermo Fisher Scientific. Description, paragraphs 2–3: enzyme-dependent extension temperature and two-step cycling
PCR specificity 2026-10-14
PCR specificity concerns whether the accumulated amplicon comes from the intended interval. Binding temperature, PCR primer nucleotide sequences and their possible alternative binding sites matter. Too permissive binding can support competing products; excessively restrictive binding can prevent the intended product. A band of the expected length is useful evidence, but unrelated nucleotide sequences can have the same length. DNA sequencing tests identity more directly, subject to mixtures and copying errors.[ref]
How to Design a Primer by Addgene. Primer Design for PCR: specificity, paired melting temperatures and complementary primer sequences
PCR thermal cycle Created 2026-10-14 Updated 2026-10-18
A PCR thermal cycle separates three jobs. During PCR denaturation, heating separates the paired DNA strands without intentionally cutting their phosphodiester bonds. During PCR annealing, cooling permits base pairing between PCR primers and templates. During PCR extension, the chosen interval supports DNA polymerase synthesis from the paired ends. Each new nucleotide is supplied as a deoxynucleoside triphosphate; its incorporation lengthens the strand. The DNA polymerase is a catalyst, while these nucleotides are consumed substrates.[ref]
Principles of PCR by Thermo Fisher Scientific. Principles of PCR, accompanying description: denaturation, annealing, primer-dependent extension and dNTP incorporation
Taq polymerase withstands repeated high-temperature strand separation better than a heat-sensitive DNA polymerase. Its extension activity still depends on temperature, buffer solution and magnesium ions. Heat resistance does not mean constant activity at every stage: the separation temperature serves the DNA, whereas the extension temperature serves the copying enzyme. As one institutional example, Addgene's Basic PCR Program specifies separation, primer binding and extension. These are example settings, not universal properties of all PCR primers or DNA polymerases.[ref]
Polymerase Chain Reaction (PCR) by Addgene. Basic PCR Program, steps 1–6; Materials List: Taq buffer with magnesium chloride
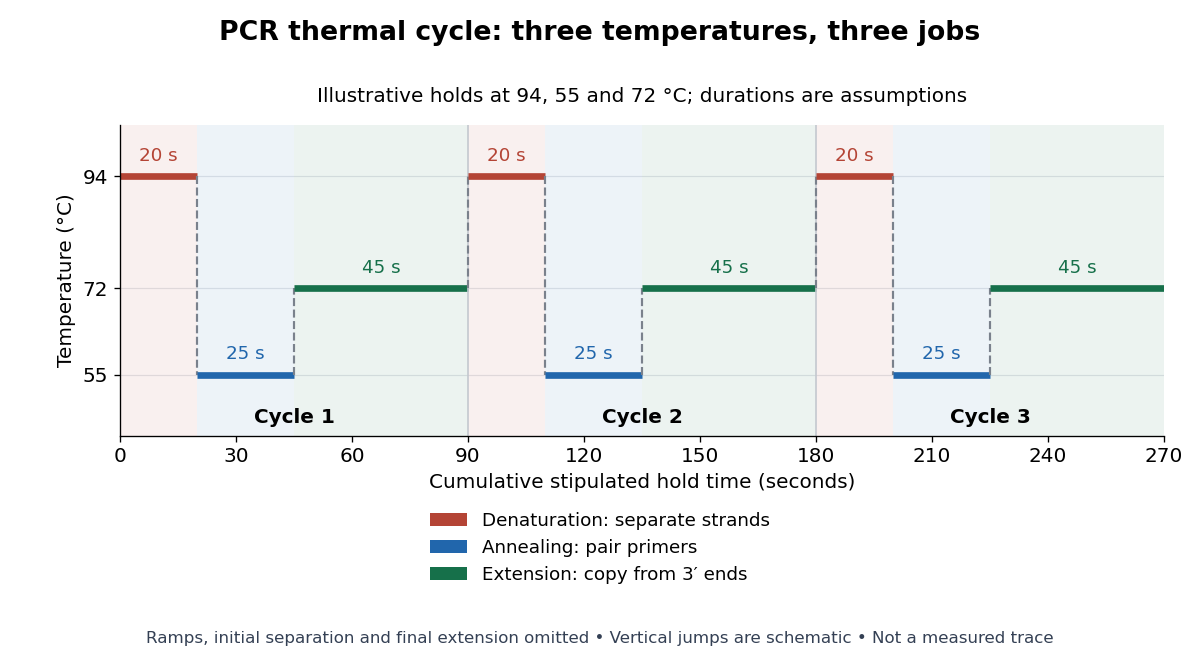

For timing arithmetic alone, those stipulated holds give per PCR thermal cycle, and three cycles give . Adding an assumed initial separation and final extension gives of holds. A real thermal cycler also takes time to move between temperatures. The schedule tells us when conditions favour PCR denaturation, PCR annealing or PCR extension; it does not measure the fraction of DNA copied.
An actual institutional protocol makes the distinction concrete. New England Biolabs specifies mixing templates and PCR primers with its OneTaq master mix in a thin-walled tube; a quick spin collects liquid at the bottom. Its preparation uses of the twice-concentrated mix and of each PCR primer stock, with water completing the volume. Tubes enter a thermal cycler preheated to ; mineral oil is specified if there is no heated lid. The program gives thirty cycles of separation, – binding and extension, with extension time scaled to product length. The binding setting must be selected for the PCR primers; the range is not a continuously swept setting.[ref]
Protocol for OneTaq 2X Master Mix with Standard Buffer by New England Biolabs. Protocol, Reaction setup steps 1–2, 25 microlitre table and Thermocycling conditions; General Guidelines, Annealing and Extension
The dilution can be checked independently: each PCR primer has final concentration , while the mix is diluted twofold. For an endpoint readout, Addgene specifies examining a product aliquot by gel electrophoresis.[ref]
Polymerase Chain Reaction (PCR) by Addgene. Procedure, Primer Design and PCR step 13: run 2 microlitres on a gel
Pair that size comparison with the existing PCR controls: a known template and a no-template tube test different explanations of success or failure. Those comparisons are an analytical addition, not controls documented in the OneTaq schedule. An expected-sized band supports production of a length-compatible amplicon; it does not establish its nucleotide sequence, ideal PCR efficiency or successful separation during every cycle. Neither protocol supplies a measured temperature or yield curve for the schematic above. Pea seed respirometry 2026-10-14
The University of Oklahoma K20 Center's handout describes three sealed vial-and-pipette respirometers in each temperature bath: soaked, germinating peas; nongerminating peas plus inert plastic beads; and beads alone. Displaced water establishes equal occupied volumes. Absorbent cotton holds potassium hydroxide, which removes carbon dioxide; nonabsorbent cotton separates it from the peas. The source equilibrates the vials before submersion and again before the initial reading. Colored water makes the boundary visible in each calibrated pipette. Readers then record positions every five minutes for twenty minutes.[ref]
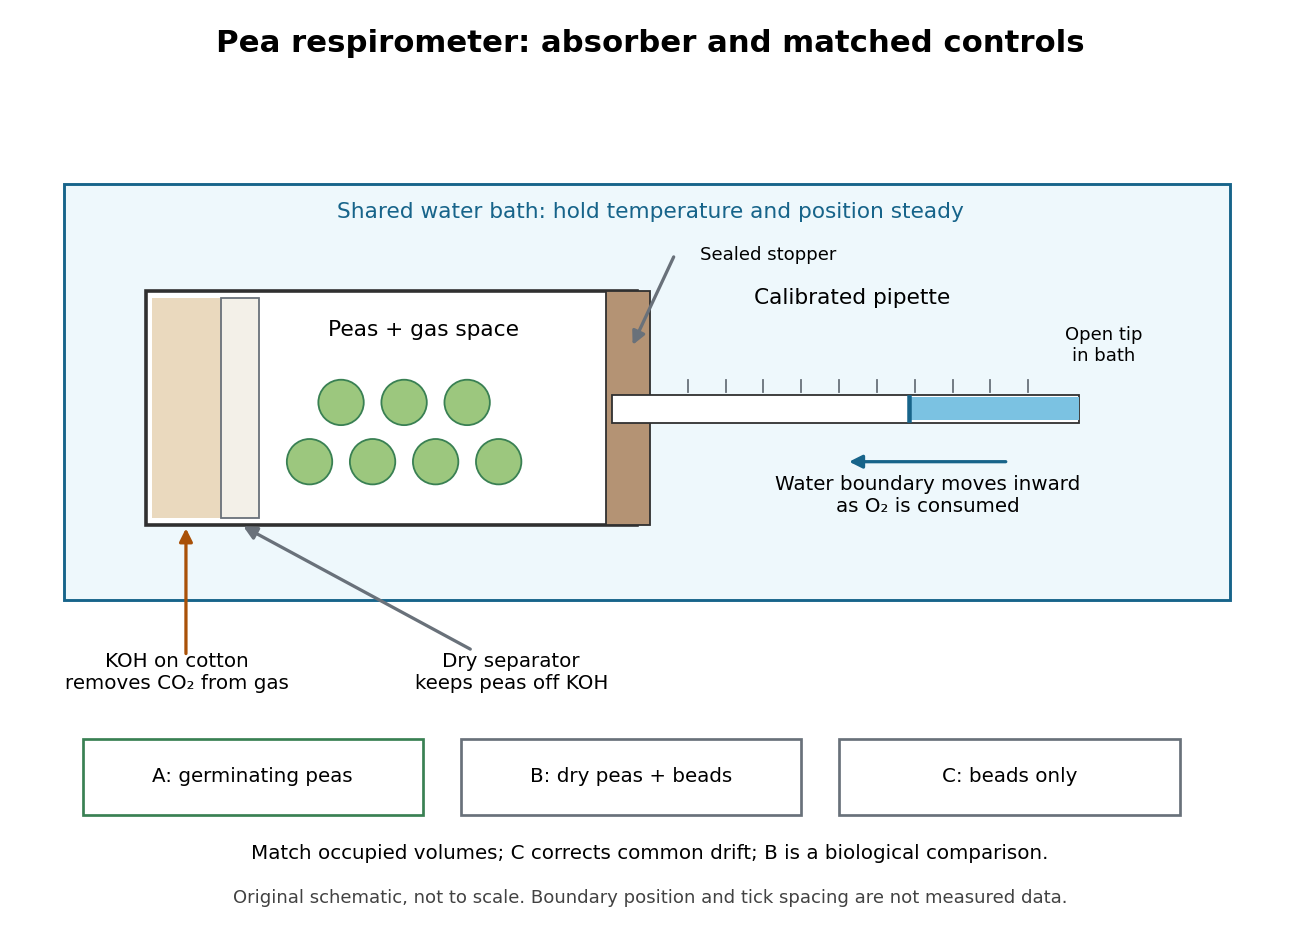

Bath temperature, vial position and seal integrity matter. The beads-only respirometer detects common temperature or atmospheric pressure drift; its change is subtracted from each pea reading. Nongerminating peas provide a biological comparison, not an assumption of zero cellular respiration. A larger corrected uptake slope for germinating peas would support greater molecular oxygen consumption by that sample under the tested conditions.[ref]
Cell Respiration by the K20 Center. Cell Respiration, pp. 1, 3–4 and 6: living dormant seeds, position/leaks, corrected differences and slope
Equal displaced volumes help match the gas spaces; they do not establish equal living mass or equal developmental state. Comparing uptake per seed and uptake per dry mass asks different questions. Leaks, incomplete carbon dioxide absorption, gas dissolution and changing water-vapour contributions can distort the respirometer inference. A blank correction cannot repair a sample-specific leak. These are consequences of the respirometer gas balance, rather than measurements reported in the handout.
Peierls transition Created 2026-10-18 Updated 2026-10-20
A Peierls transition, named for Rudolf Peierls, is a metal-insulator transition caused by a Peierls distortion of an initially metallic chain.[ref]
Peierls transition. Entry P04468: electronic transition caused by a structural distortion and opening a gap at the Fermi energy
A modulation at mixes states near opposite Fermi points and can open a band gap at the Fermi energy. At half filling with one atomic orbital per chemical atom, this modulation doubles the original lattice period and alternates strong and weak bonds. In a weak-coupling zero-temperature description, the Peierls energy gain is proportional to whereas the elastic cost is proportional to , where is the undistorted hopping strength and its small alternating change. The logarithm permits a distortion at arbitrarily weak coupling in the ideal model. Finite temperature, finite size, interchain coupling and thermal fluctuations matter for a real transition; strictly one-dimensional reasoning alone does not establish finite-temperature long-range order. Peltier coefficient 2026-10-18
At uniform temperature, define the material Peltier coefficient by transported heat current along positive conventional current:Its units are . In one dimension, , with electric current density and thermal conductivity . Here heat excludes the electrochemical potential contribution to total energy flux.[ref]
Now orient positive conventional current from material A into material B, at a common junction temperature . Define as heat taken from the junction's thermal surroundings. The outgoing transported heat minus the incoming transported heat givesThe local released heat is . Authors defining a junction coefficient by released heat therefore use the opposite sign. Exchanging A and B reverses the coefficient; reversing at fixed A and B reverses the junction's thermal response. An individual material coefficient and a junction difference are different quantities.
For an original stipulated example, choose and at . The Kelvin thermoelectric relation gives , . A positive flowing A to B absorbs . A separate junction electrical resistance would dissipate for either direction. If all that dissipation heats the junction, its net absorbed power is forwards and backwards. These numbers illustrate a chosen thermal accounting boundary, not measured material data or a universal allocation of contact heating.
Peltier current-reversal experiment 2026-10-18
An actual institutional protocol is CTU's Measurement of characteristics of a Peltier cell. Its cooling run uses a water container, an insulating cap and a current-limited supply; both face temperatures are recorded every minute while electric current is monitored. The apparatus includes a water-cooled exchanger, copper blocks and brass containers. The heating run resets the water near room temperature before reversing polarity. The handout specifies no thermometer type and reports no dataset. Its modular junction geometry is shown separately from the external thermal assembly.[ref]
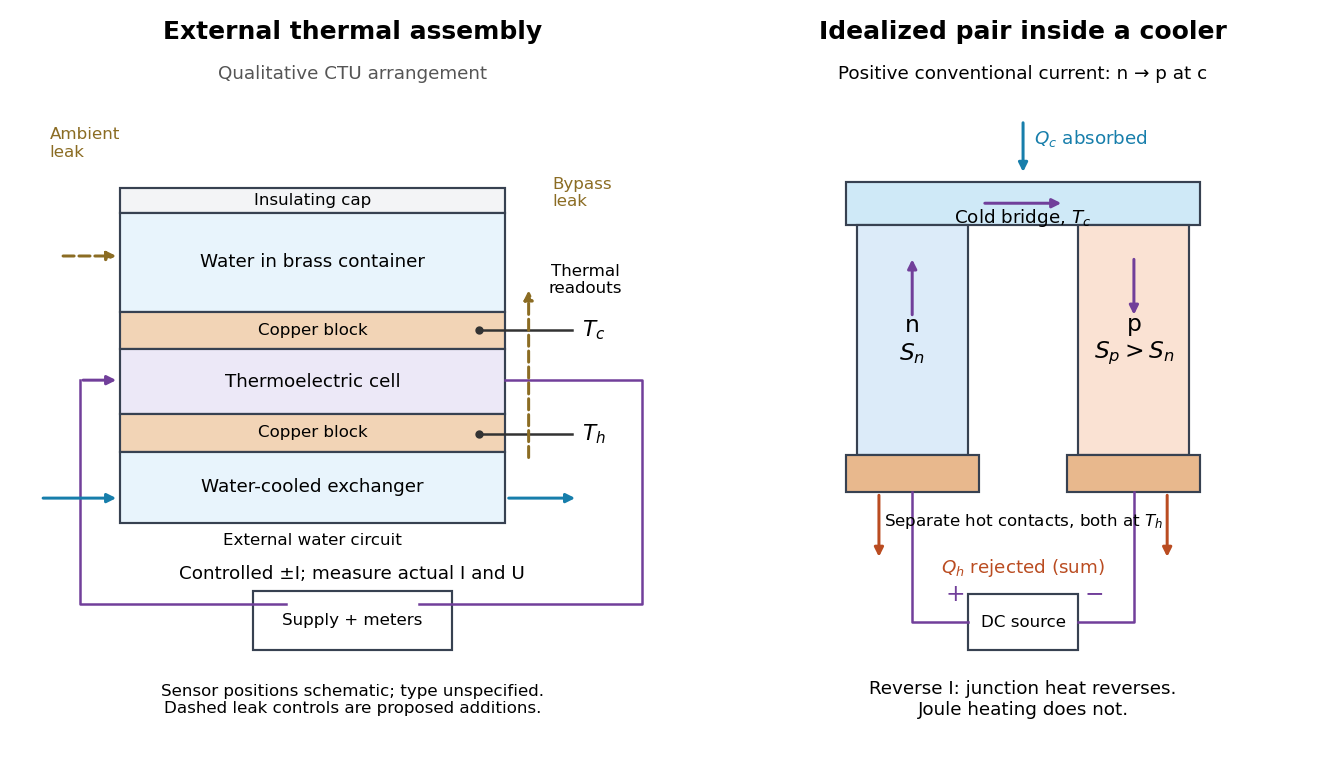

The following is a proposed quantitative extension. Keep the physical face labels fixed throughout reversal: c denotes the observed object's side and h the exchanger side, even if their actual temperatures change order. Use an independently read thermometer at each thermal contact and log the actual signed electric current and terminal electric potential difference. Maintain reproducible contact pressure and contact layers. A sensor in water measures water temperature, which need not equal the face temperature during a transient; verify mixing and contact equilibration before using it as a face reading. Do not interchange sensor leads when reversing the supply.
The strongest separation compares runs at the same , water mass, contact conditions and environment, rather than subtracting arbitrary final temperatures. One option is short initial-rate runs after resetting the whole assembly to a reproducible state. Define as the net power entering the monitored object, inferred from its calibrated effective heat capacity and initial temperature slope. In a simple symmetric model, let include background heat transfer at that state and the dissipated power reaching the object. Thenwhere in the thermoelectric cooling model below. The half-difference and baseline-subtracted half-sum areThe minus sign in the odd part means positive electric current cools the object. The even part has to subtract the zero-current baseline: otherwise heat conduction and ambient exchange remain mixed with Joule heating. Independently measured heat capacity is essential for converting a thermal slope into watts; include the blocks, container and water that actually equilibrate on the measurement timescale.
Useful controls are zero-current drift at several matched temperature differences, equal-magnitude positive and negative electric currents, and repetition of a sequence such as with thermal resets. A calibrated small heater on the object can test the heat capacity and lost-heat correction independently. Check Joule heating in supply leads and contacts, bypass heat conduction through supports and wiring, and ambient convection and thermal radiation. Insulation reduces a leak; it does not establish that it is zero. Measure terminal power at the module boundary so lead losses are not mistaken for module heating.
An odd thermal response supports a reversible current-coupled contribution, but does not by itself locate all of it at one junction: the Thomson effect in nonuniform leads can also be odd. Sensor offsets, unequal current magnitudes, drifting thermal contacts and different junction temperatures during the two runs can contaminate both parts. In particular, heating proportional to is even only when the compared electrical resistance is the same. CTU's qualitative reversal illustrates switching heating and cooling; the matched-state controls above would be needed for a coefficient measurement.
Peltier effect 2026-10-18
The Peltier effect is heat transfer associated with an electric current crossing a junction between materials with different Peltier coefficients. At fixed junction temperature, its contribution changes sign when the conventional current reverses. A junction can absorb heat from its surroundings for one direction and release it for the other. Joule heating, proportional to the square of the electric current, accompanies this transport but does not reverse sign. Consequently, observing a warm device alone does not identify the Peltier effect.
This makes the Peltier effect useful as an electrically controlled heat pump: reversing the supply can switch an object's thermal role without changing any plumbing. In thermoelectric cooling, however, the useful cooling is the junction's absorbed heat minus returning heat conduction and its share of Joule heating. Increasing electric current eventually makes cooling worse. The distinction between transported heat and net cooling is the central practical lesson of the thermoelectric cooler energy balance.
In a fixed-temperature convection problem, the boundary temperature is prescribed, and its perturbation satisfies a thermal Dirichlet boundary condition. A homogeneous condition means the boundary follows the prescribed conductive background temperature. This does not necessarily mean a vertical wall has a spatially constant temperature; that additional assumption can conflict with a background vertical gradient.
Periodically poled lithium niobate 2026-10-20
Periodic heat and transport comparison Created 2026-10-14 Updated 2026-10-25
Use dimensionless and , the periodic domain , and the same initial conditionWith zero PDE source term, compare the heat equation and the transport equation . Their exact solutions areEach cosine satisfies , so the heat equation reduces its amplitude according to . The superposition principle combines the constant and two Fourier modes. The transport equation shifts the argument of the entire profile. Both formulas meet the initial condition and matching periodic boundary conditions exactly.[ref]
https://web.stanford.edu/class/math220b/handouts/heateqn.pdf. Stanford Math 220B heat-equation notes, periodic boundary conditions
At , the heat amplitudes are approximately and : the small ripples disappear much sooner than the broad variation. The transport equation retains amplitudes and , shifting the profile right by one unit with wraparound. Both preserve spatial average , but only the heat equation approaches the uniform profile. This gives diffusion its usefulness for smoothing uneven temperatures, while the transport equation models a profile carried by a flow. The signed profile can represent a scaled temperature deviation.
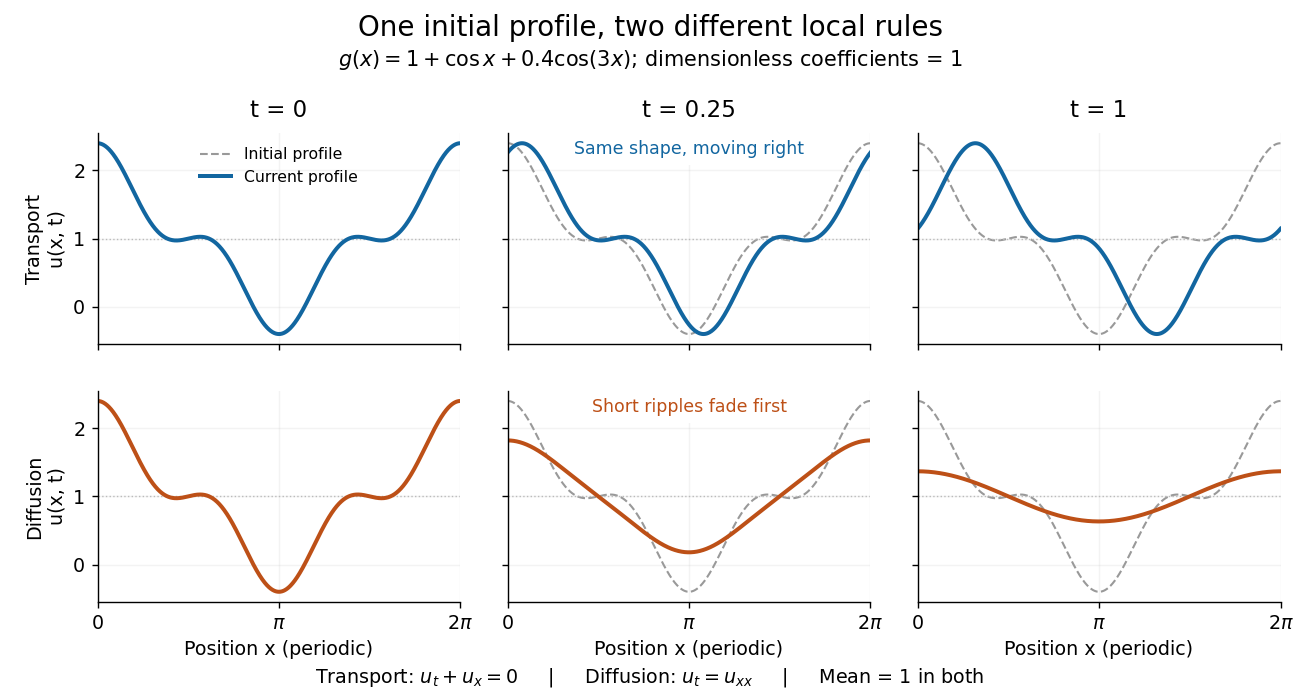
Exact evolution of one periodic profile: transport translates while diffusion preferentially removes short wavelengths
. Details. 
To restore units, let physical position be and time be . For , the dimensionless coefficient is , with measured in length squared per time. For , it is , with measured in length per time. Both plotted coefficients equal one when and . Thus the example compares specified models on the same scales, rather than identifying diffusivity with velocity.