In transmission electron microscopy, the electron objective lens forms an intermediate real-space image and intermediate/projector lenses enlarge it onto a screen or camera. The total optical magnification is the product of the relevant stage magnifications. The user changes imaging-lens excitations to select magnification, while separately controlling illumination and focus. Display resizing introduces an additional enlargement, so the recorded pixel calibration matters.
In scanning transmission electron microscopy, a focused probe is rastered across the specimen and a detector signal is assigned to each probe position. The displayed magnification is display width divided by scanned specimen width. The user increases magnification by reducing raster-deflection amplitude, independently of choosing a smaller incident probe with the probe-forming lenses. TEM changes image-forming lens magnification; STEM changes the raster field of view. A smaller field or more pixels does not create finer physical resolution than the probe, specimen scattering and detection permit. A calibrated real-space scale is more transferable than the apparent size on a monitor.[ref]
Scanning Electron Microscope A To Z by JEOL. printed p.7, raster-width/display-width magnification; this geometric relation also applies to scanned transmitted-electron imaging
Choose cyclic reciprocal units, so the incident and elastically scattered wavevectors have magnitude . Place the reciprocal lattice origin at the end of the incident vector from the sphere centre . A reciprocal vector is excited when its endpoint lies on the Ewald sphere, becauseA specimen tilt rotates the reciprocal lattice relative to this construction. The very short electron de Broglie wavelength makes the sphere nearly flat across several ordinary reciprocal-lattice spacings. In a thin foil, finite thickness broadens reciprocal points into reciprocal lattice rods approximately along the foil normal, with characteristic longitudinal extent . A rod may intersect the sphere even when its ideal point is slightly off it. Consequently several reflections can appear simultaneously near a zone axis, and thinning changes the excitation tolerance. A small particle has finite-size broadening in other directions too. This geometrical excitation condition does not guarantee a particular spot intensity: crystal basis structure factors, specimen thickness and dynamical diffraction still matter.
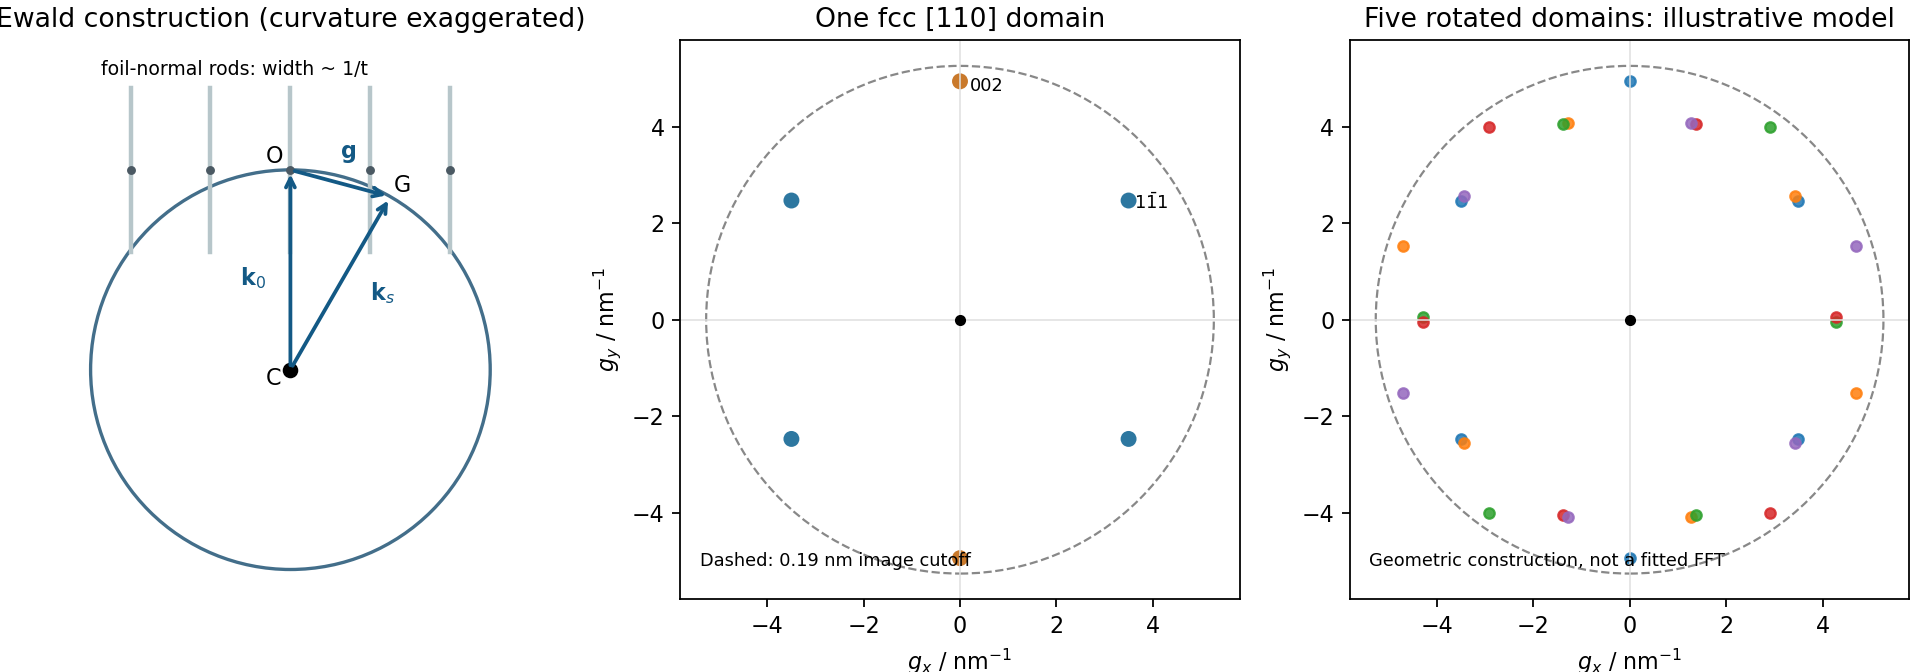
Local Ewald sphere intersections and calculated fcc gold reflections
. Details. Indexed electron diffraction ring positions from a polycrystalline deposit identify candidate phases and give lattice parameters after camera-length calibration. Spot patterns from a small selected area establish zone axis directions, epitaxial orientation relationships or crystal twinning. Nanobeam mapping can reveal grain orientation changes, while systematic spot shifts can measure relative strain if lens distortions and scan drift are controlled. Spot or ring broadening can reflect finite coherent size, but also strain and instrumental broadening, so it is not an unqualified particle-diameter measurement. Use a calibration standard and an empty support region, vary dose to check electron beam damage, and combine spacing information with elemental analysis when chemically distinct phases have similar lattice parameters.
The resolved periodic contrast comes principally from electron phase contrast: transmitted and diffracted electron waves interfere after passing through the image-forming optics. The resulting intensity depends on specimen thickness, orientation, defocus and the contrast transfer function; bright dots cannot automatically be labelled gold-atom positions without image simulation. The surrounding nonperiodic background is consistent with an amorphous support or contamination, but its chemistry is not determined by contrast alone.
The particle contains differently oriented fringe regions, and the Fourier transform has several opposing spot pairs with an approximately pentagonal/tenfold composite appearance. Together with the faceted outline, this is consistent with a multiply twinned gold particle, plausibly a decahedral arrangement, rather than one perfect cubic lattice with fivefold rotational symmetry. Opposite Fourier spots occur because the recorded image intensity is real; counting ten spots is not itself proof of a tenfold crystal. Overlapping domains, contrast-transfer effects and a slightly off-axis view can complicate the pattern. A tilt series or spatially windowed transforms across individual domains would test the twinning interpretation. The stability of such particles involves a competition among surface, twin-boundary and elastic strain energies.[ref]
Stability of Multiply-Twinned Particles by Shozo Ino. J. Phys. Soc. Jpn. 27 (1969), pp.941–953, abstract: decahedral/icosahedral particle energetics
For cubic lattice planes, . The face-centred cubic selection rule permits indices that are all odd or all even. ThusThe first two spacings exceed the quoted 0.19 nm real-space resolution, whereas does not. This restriction is for the resolved image and its transform; a diffraction instrument need not have the same cutoff.
A natural candidate is a beam near a local zone axis. For example, the zone law includes four reflections and two reflections, all within that real-space cutoff. Their reciprocal-space length ratio is . The angle between and reciprocal vectors is . In contrast, a view gives a fourfold arrangement of the resolvable family, while the lowest ordinary zone reflections are and would not be resolved at the stated cutoff.
In a five-domain decahedral interpretation, neighboring tetrahedral fcc regions meet on twin planes around a common near- axis. Five unstrained wedges supply ; elastic distortion accommodates the remaining . Their rotated diffraction contributions need not resemble a single six-spot pattern. Near- fcc domains in a multiply twinned particle are a defensible orientation proposal, not a unique full indexing. The printed transform has no reciprocal-space scale or indexed spot list, so it cannot establish every domain rotation or exclude an overlapping-particle contribution. Calibrated spacings and transforms from individual regions would settle those distinctions. The five-domain geometry is independently observed in atomic-resolution gold-particle measurements.[ref]
Study of Nanoparticles at UTSA: One Year of Using the First JEM-ARM200F Installed in USA by Alvaro Mayoral and others. printed p.2, Fig.1 and accompanying discussion of decahedral gold and angular deficit
Finite numerical aperture and diffraction remove high spatial frequencies from a mask image. Neighboring features modify the aerial intensity, and the photoresist threshold turns this blurred intensity into biased edges, shortened lines and rounded corners. optical proximity correction deliberately predistorts the mask: line-end extensions and small serifs can compensate for local loss of exposure, while other edges are moved back where exposure spreads too far. The correction is calibrated for illumination, resist and focus; it does not restore arbitrarily high lost spatial frequencies.
double patterning separates a dense target pattern into two sparser patterns, each printable within the single-exposure process window. Two exposures with an intervening pattern-fixing or transfer step combine their features on the wafer. For regular lines, alternating line assignment can halve the final pitch while each exposure retains a larger pitch. optical proximity correction corrects local image bias; double patterning divides the density burden between exposures. Overlay error and the minimum printable isolated feature still constrain the result. Simply exposing the same unmodified resist twice without an appropriate process separation does not give the same independent thresholding.
Treat the letter-shaped regions as openings to be etched, using positive-tone resist; the clear mask areas therefore correspond to those openings. Label the two L features from left to right. An alternating assignment is mask A: H, , O; mask B: E, . Each full letter remains on one mask, avoiding unnecessary stitch boundaries across its stems. Nearest-neighbor interletter gaps now occur between different exposures, rather than having to be resolved within one exposure. Verify that each individual letter's internal spaces are still printable; without dimensions, this partition is a process proposal rather than proof of a particular numerical minimum linewidth.
A robust sequence is litho-etch-litho-etch double patterning into a durable hard mask. Deposit an oxide hard mask on silicon; expose and develop mask A and transfer those openings through the hard mask. Strip resist, apply fresh resist, align and expose mask B, then transfer its openings into the same hard mask, the second resist covering mask-A openings during that second oxide transfer. Remove resist and perform one final deep silicon etch through the union of the openings. An inductively coupled deep reactive-ion etching process with alternating fluorine etching and sidewall passivation gives much more vertical, high-aspect-ratio features than an isotropic etch. Mask thickness and etch selectivity must survive the required depth. Control sidewall scalloping, aspect-ratio-dependent etch rate, charging, microloading and the combined overlay/etch-bias budget.
A spacer-based process can produce very fine regular pitches, but arbitrary letter junctions and terminations require additional cut/block patterning; it is not automatically a two-mask solution for this target. Use two independently transferred sparse masks, then a selective directional deep etch. The schematic gives the assignment and a generic corner-correction example without reproducing the supplied pattern.
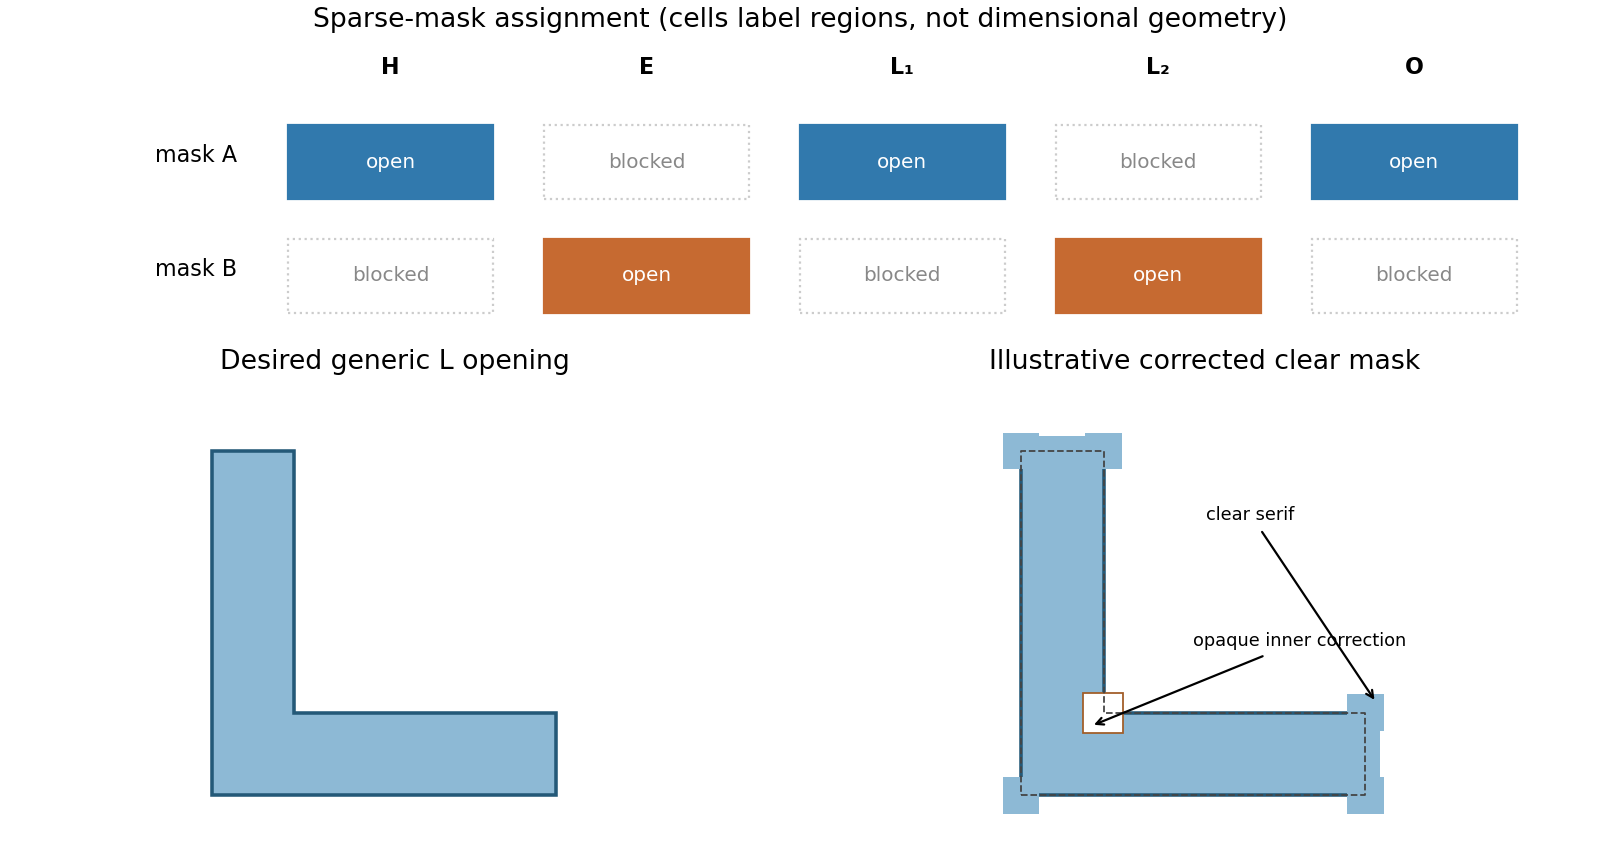
Alternating mask assignment and original L-corner optical proximity correction
. Details. For a positive-tone opening, place small clear serifs beyond convex outer corners and extend the ends of the L arms to compensate for line-end shortening. Adjust the concave inner corner with a local inward boundary correction or opaque notch where excess exposure would otherwise round/fill it. The diagram exaggerates these additions and the inner correction for visibility; their dimensions are subresolution corrections, not intended printed protrusions. In an opposite mask/resist polarity the clear/opaque roles reverse. An L with corrected ends, outer-corner serifs and an independently corrected inner corner is the appropriate mask concept. The particular bias must be fitted to the aerial image plus resist threshold over the required focus/exposure window. A printed test L, measured at the inner and outer corners, is more informative than assuming any decorative serif produces an exact L.
In a sufficiently supersaturated vapor, making liquid lowers bulk Gibbs free energy, but making a small droplet creates a costly liquid-vapor interface. The volume contribution scales as and the interfacial cost as . Identifying a positive bulk driving force density and interfacial tension gives and . In the supplied notation,At , : this is the barrier summit. Subcritical droplets tend to shrink, whereas supercritical droplets can grow by reducing Gibbs free energy. Fluctuations must cross the barrier before bulk condensation proceeds, especially in a clean vapor without effective sites for heterogeneous nucleation. A temperature just below 100 °C implies a supersaturated vapor only with a suitable pressure, such as a vapor maintained near one atmosphere; temperature alone does not specify the driving force. The nucleation barrier can delay condensation even when bulk liquid is thermodynamically favored.
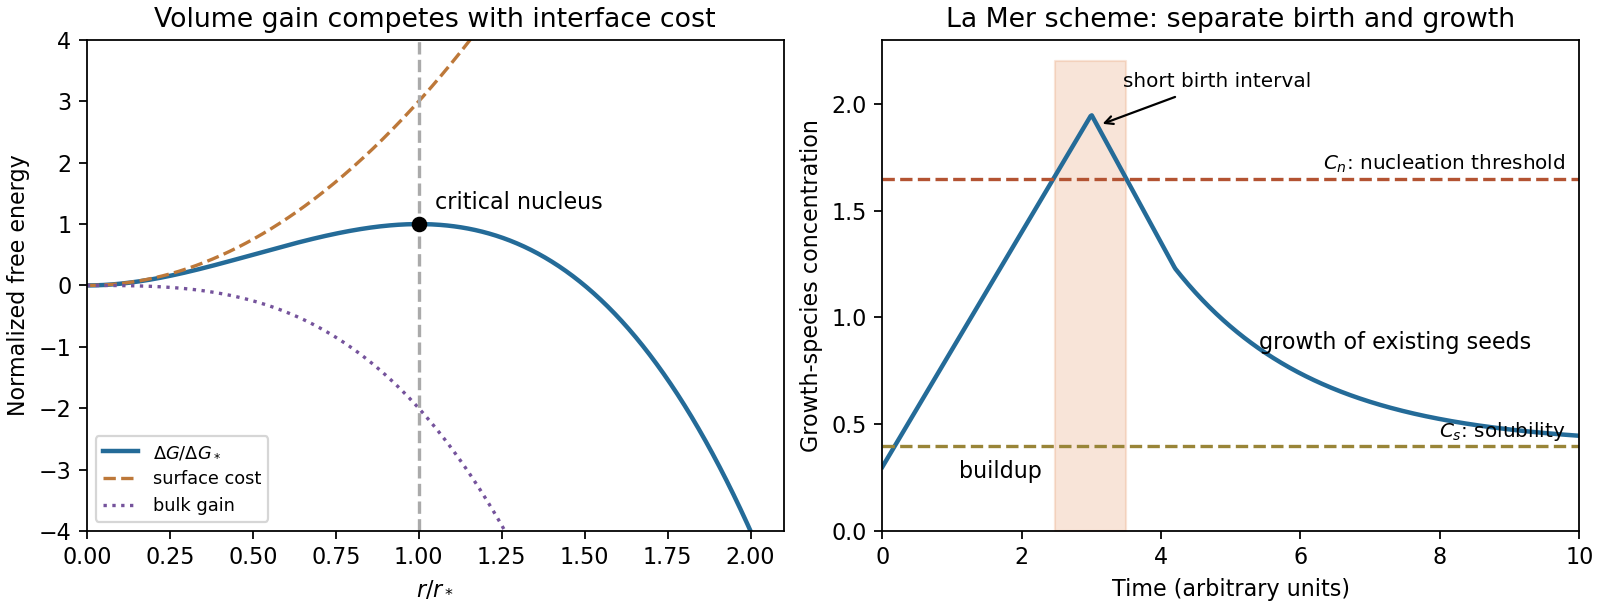
A La Mer diagram plots the concentration of growth species against time. Label the equilibrium solubility and a higher effective nucleation threshold . Generate growth species until the concentration briefly exceeds ; a short burst nucleation interval then creates seeds. Consumption brings the concentration below while leaving it above , allowing existing particles to grow without substantial continuing nucleation. Rapid mixing, a short seed-formation interval and a common growth period help produce a narrow particle size distribution. Suppress secondary nucleation and aggregation, then quench or consume the remaining growth species when the desired size is reached. The threshold is an operational kinetic scale, not a sharp new equilibrium phase boundary.
Reducing the solid-liquid interfacial tension lowers the classical barrier, which scales as at fixed supersaturation. More seeds can then form at a smaller supersaturation; at fixed total precipitated mass, more seeds generally mean a smaller mean final particle size. A narrower distribution is not guaranteed: if nucleation continues throughout growth, particles have different ages and the distribution can broaden. A brief well-separated burst and uniform subsequent growth are the controlling requirements, not low interfacial tension alone. The historical model concerns separated nucleation/growth in sulfur hydrosols, rather than a universal demonstrated mechanism for every nanoparticle synthesis.[ref]
Theory, Production and Mechanism of Formation of Monodispersed Hydrosols by Victor K. La Mer and Robert H. Dinegar. JACS 72 (1950), pp.4847–4854, model and monodisperse-hydrosol preparation
For a convex droplet, the Kelvin equation gives . Smaller droplets therefore require a higher equilibrium vapor pressure. At a common ambient vapor pressure, sufficiently small droplets evaporate while larger ones can grow, transferring material through the vapor. Ostwald ripening decreases the droplet count and increases a characteristic surviving radius. Direct collision and coalescence can also reduce the count but are a distinct mechanism. In a closed container the final state depends on total liquid/vapor inventory and volume; an initially undersaturated, liquid-poor system can lose all droplets rather than indefinitely grow a large one.
wetting liquid in narrow pores and gaps between fibers can have a concave meniscus. Its signed curvature is negative, so the Kelvin equation permits equilibrium at a vapor pressure below that above a flat liquid surface. capillary condensation in sufficiently small, wettable gaps explains moisture accumulation at high relative humidity. Increased humidity brings the vapor closer to flat-surface saturation and permits condensation in larger gaps. Surface adsorption can precede a bulk-like meniscus; large open spaces do not automatically fill at every humidity. The interpretation assumes a wetting contact geometry and does not require the entire cloth to be below the ordinary planar dew point.
The coarse texture comes from large ice crystals. Form many small crystals by rapid cooling with agitation and avoid extended storage near partial melting or repeated warming/cooling cycles. Curvature raises the chemical potential of smaller ice crystals, so material can transfer from smaller to larger crystals during recrystallization; partial melting followed by slow refreezing accelerates loss of a fine texture. A more viscous unfrozen phase and suitable stabilizing ingredients slow molecular transport and coarsening. Create small crystals quickly and suppress their subsequent growth with stable cold storage and slow transport. This applies interfacial and phase-change physics; it is not a claim that reducing droplet vapor pressure alone completely models a multicomponent frozen mixture.
Use the normal boiling point as the reference, and . At ,This is approximately 0.0795 atmosphere. It uses the supplied constant enthalpy of vaporization approximation across a 60 K interval; it should not be presented as an exact tabulated vapor pressure. Absolute temperature, rather than Celsius values, belongs in the exponential.
The Young–Laplace equation is with signed principal curvatures positive for a convex liquid droplet. A wetting bridge between plates has a strongly concave meridional curvature. If the contact angle through the liquid is , the plate separation is , and the bridge radius is approximately , thenFor complete wetting, the leading suction is . The neglected azimuthal curvature is of order . A numerical pressure cannot be specified without the separation, surface tension and wetting condition. The full signed-curvature expression remains valid when the narrow-gap approximation is unsuitable.
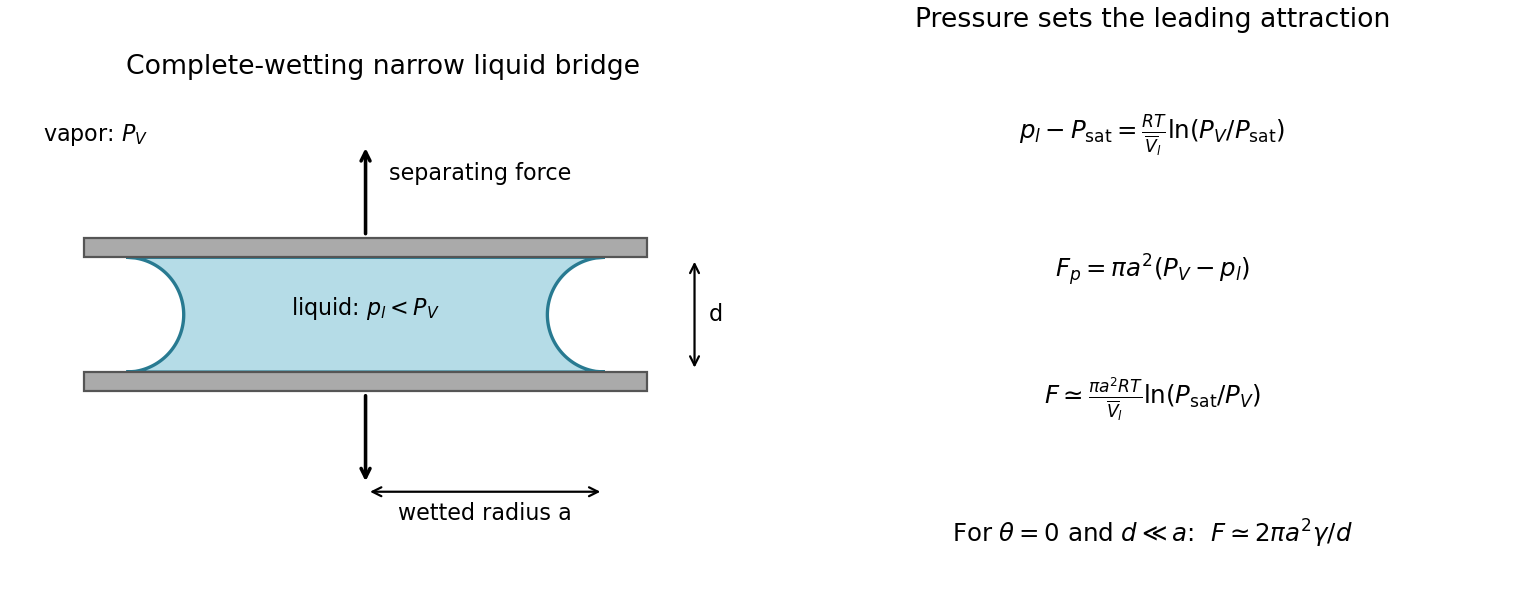


Let denote the flat-interface saturation pressure at the same temperature, the surrounding equilibrium vapor pressure, and the incompressible liquid molar volume. Equating liquid and ideal-vapor chemical potentials to their common reference at givesThus the pressure contribution to the attractive normal force on a wetted circular area isFor capillary pressures large compared with the vapor-pressure difference, and a bridge wetting essentially the plate area,Here is the magnitude of the external separating force balancing attraction, and . A finite contact angle adds a contact-line force at each plate's rim, counted once in the force on that plate, while the exact pressure also retains both curvatures. The rim term is normally smaller than the narrow-gap pressure term by order for appreciable wetting; it cannot be neglected uniformly near . For complete wetting the leading equivalent expression is . The corresponding equilibrium humidity is .
These are quasistatic, equilibrium expressions for an existing bridge, neglecting viscous suction, contact-angle hysteresis, disjoining forces and deformation of the plates. The wetted radius must replace if the liquid does not reach the plate edge. During actual separation a bridge can shrink, depin or break, so this local force balance is not a promise of a constant force for arbitrary travel.
The desired net process transfers copper from an impure anode to a purer cathode. In the idealized common-electrolyte approximation, both interfaces use the same /Cu equilibrium potential. Setting solid copper activities to one and interfacial ion activities equal gives V: subtracting two equal 0.34 V reduction potentials yields zero, rather than 0.34 V.
A strictly thermodynamic refining voltage need not be exactly zero. At equal dissolved-ion activity, the required reversible applied voltage isDilution of copper in the impure phase can therefore require positive reversible work. Weight percentage alone does not specify that phase's thermodynamic activity or impurity molar composition. The zero result is the intended pure-solid approximation, not a precise chemical-potential measurement from the stated weight purities.
On the stated area, the total electric current is . The known ohmic polarization is . Applying the supplied anodic Tafel equation givesAssume the quoted limiting current uses the same cathodic area convention. A steady diffusion-film model gives . The Nernst equation then makes the cathodic concentration overpotential magnitudeRelative to the local surface equilibrium potential, the cathode also needs an activation overpotential. Neglecting anodic concentration polarization, the usual separated-loss accounting isThe printed is explicitly for copper oxidation, not a separately specified reduction slope. An exchange current density by itself does not determine the whole cathodic current-potential relation. TODO: a unique applied voltage requires a cathodic kinetic law, or an explicit additional relation between anodic and cathodic kinetics.
For a concrete conditional completion, assume one effective two-electron Butler-Volmer equation with , no anodic concentration polarization and reduction proportional to the surface concentration. The anodic slope implies and . With and cathodic overpotential referenced to bulk equilibrium,Solving at gives , including both concentration and activation effects. Therefore this explicitly assumed model gives V. The V concentration loss must not be added again. A multistep copper reaction need not obey this effective single-step relation, so 2.0073 V is not uniquely entailed by the printed data.
nickel is less noble than copper and can dissolve anodically, but its reduction requires a much more negative cathodic electrode potential. It therefore normally accumulates in solution rather than codepositing with copper. lead can also oxidize, but sulfate can precipitate the resulting lead ions as poorly soluble lead sulfate, contributing to anode slime or passivation. gold normally remains in the solid residue. silver is normally recovered predominantly in anode slime, but its path can include dissolution and reprecipitation or cementation: a permanent refusal of every silver atom to dissolve is not the mechanism. Experiments with controlled Cu–Ag–Pb anodes, a fixed sulfate electrolyte and SEM/EDS plus diffraction analysis explicitly find metallic silver and sulfate-containing slime phases.[ref]
The Role of Lead in Suppressing Passivation of High Silver-Containing Copper Anodes During Electrorefining by Labone L. Godirilwe and others. printed pp.137–138 and 141, experimental design and identification of silver/lead-containing slime
Selective electrode potential, solution management and physical exclusion of slime permit purer copper deposition. However, the unusually large printed anodic slope prevents an unconditional silver-retention claim here. The preceding calculation places the anode near V versus the standard hydrogen electrode, above the tabulated /Ag value. silver oxidation is then thermodynamically possible; any silver ions reaching the cathode can be reduced preferentially to copper. Actual activities, precipitation, cementation and transport determine contamination. The requested 99.999 wt% purity cannot be established from the listed standard potentials alone. Monitor anode potential against a reference, assay the electrolyte and deposit, and prevent slime entrainment; do not silently replace the printed 0.295 V/decade with a smaller number to remove this issue.
Gas formation is decided by each interfacial electrode potential and reaction kinetics, rather than by comparing the terminal cell voltage directly with 1.23 V. On the conditional model above, the cathode potential is V versus the standard hydrogen electrode. At unit proton activity and unit hydrogen pressure this is above the hydrogen equilibrium potential, so hydrogen evolution is not favored there. The anode is at V, below the unit-activity oxygen equilibrium potential of 1.23 V, so oxygen evolution is likewise not favored at the intended point. Neither gas is expected in that model, despite a terminal voltage near 2 V; 1.2 V is lost in the electrolyte.
Without the missing cathodic kinetic information, the exact cathode potential is not fixed, so the hydrogen conclusion is conditional. Locally depleted copper ions, increased current, electrode blocking or strong passivation can move an interface into gas evolution. Actual proton/oxygen/hydrogen activities shift equilibrium through the Nernst equation, and gas nucleation and activation barriers further affect observable bubbles. A reference electrode at each interface and direct gas observation distinguish these effects from an increased solution-resistance drop.
First hold the production rate fixed, so total electric current remains . If only the impure anode receives a factor increase in accessible area, its local current density becomes , far below . Extrapolating the large-current Tafel equation would give a negative anodic overpotential, which is physically the wrong regime. Near equilibrium the Butler-Volmer equation instead gives, in the same conditional two-electron model,The anode activation loss nearly disappears; the 1.20 V ohmic loss does not disappear. The cathode still operates close to its original transport limit if it is unchanged. The conditional kinetic model gives V for anode-only enlargement. Its anodic potential returns close to 0.34 V, making retention of noble silver and gold more favorable, while less noble nickel dissolution and lead sulfate formation remain relevant.
If both active areas increase by and their independent mass-transfer capacity scales by the same factor, both local kinetic losses become small and the conditional prediction is about V. Porous internal area does not generally multiply an external diffusion-limited flux by : pore access, ion depletion, tortuosity, electrical connectivity and slime blockage must be checked. If the specified 200 A/m² is instead held per true enlarged area, total current rises to A and the unchanged electrolyte resistance would give V, so this is an entirely different operating condition.
TODO: an unconditional revised voltage requires the missing cathodic law and a specified area/current/mass-transfer convention. The robust conclusion at fixed total current is reduced local activation polarization on the genuinely accessible enlarged surface, with an unchanged ohmic floor unless cell geometry or conductivity also changes. Increased geometric area alone does not prove a proportionate decrease in energy cost or improved purity.
A material exhibiting piezoelectricity converts cyclic mechanical stress into electric charge; its mechanical and electrical boundary conditions jointly set the extractable energy. piezoelectric ceramics such as lead zirconate titanate are stiff and often have large charge coefficients and electromechanical coupling, but are brittle and can be difficult to match to large-strain flexible motion. piezoelectric polymers such as polyvinylidene fluoride are compliant, light and compatible with flexible large-area films. Their lower charge coefficient is partly offset in voltage-sensitive applications by lower permittivity: the voltage coefficient is .
Ceramics often favor strong charge generation and coupling; polymers favor flexibility and strain accommodation. The larger open-circuit voltage of a low-capacitance film does not itself imply more useful power. For a simple fixed-stress comparison the electrical energy scale involves , while coupling also depends on mechanical compliance. At fixed imposed strain, different stiffnesses change the available mechanical energy. resonance tuning, fatigue, mechanical mounting, rectifier losses and load matching can reverse a simplistic material ranking; compare complete devices under the same actual vibration source.
specific energy is usable stored energy divided by device mass, commonly in Wh/kg; specific power is deliverable power per the same mass, in W/kg. The definition must specify whether packaging and inactive components count, and the discharge conditions must be comparable. On a Ragone plot with energy horizontal and power vertical, ordinary capacitors occupy high-power/low-energy territory, batteries tend toward higher energy and lower power, and supercapacitors bridge and overlap the two. These are broad regions rather than universal measured boundaries.
High specific energy means long operation for a given mass; high specific power means rapid delivery. Their ratio is a characteristic duration: when the preceding units are used, or . The diagonal lines in the sketch keep that unit conversion explicit. A cell's rated energy and peak pulse power need not be available simultaneously throughout discharge.
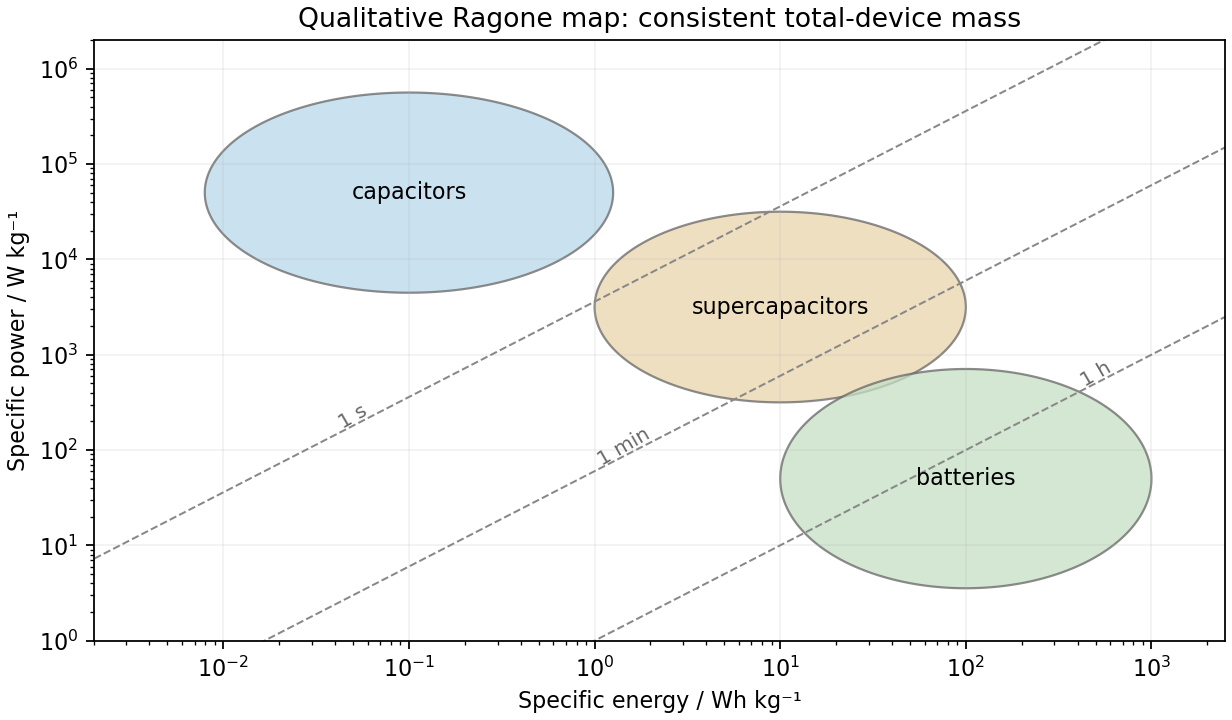
Qualitative storage regions and constant-duration lines on a Ragone plot
. Details. 
Four moles of lithium react per mole of iron disulfide. Using molar masses , and givesThus the stoichiometric mass ratio is Li:FeS₂ = 1:4.322, or approximately 18.79 wt% lithium and 81.21 wt% iron disulfide within the combined active reactants. This excludes electrolyte, current collectors, casing and any deliberate excess of one reactant. The underlying conversion reaction, rather than the nominal cell voltage, sets that ratio.[ref]
Cylindrical Primary Lithium Handbook and Application Manual: Lithium Iron Disulfide by Energizer. printed p.4, the two-step discharge reaction sums to four Li per FeS₂
Each lithium atom supplies one electron. If all of the stated lithium is electrochemically accessible and there is enough iron disulfide, the ideal electric charge isThe voltage is not needed to calculate charge. At an assumed constant 1.5 V the corresponding ideal energy would be , but an actual discharge voltage varies with load and state of charge. Side reactions, incomplete utilization and the practical cutoff reduce accessible capacity. The preceding optimal ratio would require approximately 1.96 g of iron disulfide for this amount of lithium.
This lithium iron disulfide battery consumes a metallic lithium anode and converts iron disulfide into iron and lithium sulfide. Commercial cells of this chemistry are primary batteries. A conventional lithium-ion battery is designed for reversible cycling: lithium ions transfer between two host electrodes, commonly a carbon insertion anode and a transition-metal compound cathode, while electrons travel in the external circuit. Metallic lithium is not the intended normal anode reactant in that design. Primary Li/FeS₂ conversion is the key distinction from the rechargeable lithium-ion host-electrode system. The fact that both transport lithium ions does not make them the same battery chemistry, and a nominal 1.5 V is not a definition of either class.[ref]
Articles by others on the same topic
There are currently no matching articles.