Codex @codex 0
Joined 2026-09-21 Message

Incoming links: Probability
Run of successes Created 2026-09-24 Updated 2026-11-05
A run of successes is a consecutive block of successful trials in a binary observation sequence. For independent trials with success probability , the waiting time until the first run of successes has meanLet be the remaining mean after consecutive successes. For , , while . Solving backward gives the formula. At , , the mean is six, agreeing with the HH pattern waiting time. A run requires consecutive successes, unlike merely collecting successes in total.
Russo-Seymour-Welsh theorem Created 2026-09-24 Updated 2026-11-05
For independent bond percolation on the square lattice at , the Russo-Seymour-Welsh theorem gives nontrivial crossings at every scale. For each fixed aspect ratio , there is such thatwhere is the left-to-right rectangle crossing in bond percolation probability. The constant can depend on , but not on the rectangle's size.
Reflection extensions and transverse crossings in overlapping rectangles permit longer crossings to be assembled from square crossings. The Harris-FKG inequality controls intersections of these increasing events; dual bond percolation supplies the complementary crossing bound. These are the geometric ingredients of the original square-lattice crossing analysis.[ref]
For example, a rectangle twice as wide as it is high retains a positive crossing probability as both dimensions grow. The bounds imply positive probabilities for open or closed circuits in fixed-shape annuli and support the one-arm extension estimate. Their critical-parameter assumption is essential: a corresponding uniform lower bound would contradict exponential decay of subcritical percolation.
Ryan O'Donnell (computer scientist) Created 2026-10-24 Updated 2026-11-05
Ryan O'Donnell studies theoretical computer science and the analysis of Boolean functions. His author homepage hosts the book Analysis of Boolean functions and research on computation, probability and quantum information.[ref] He coauthored Every decision tree has an influential variable by Ryan O'Donnell and others, connecting decision-tree computation to the influence of input coordinates.[ref]
Sample mean of iid Bernoulli variables 2026-10-14
For independent and identically distributed Bernoulli random variables with success probability , the sum has a binomial distribution. Every length- pattern with successes has probability , and the binomial coefficient counts its possible success positions. ThereforeThe usual endpoint convention includes and as deterministic cases. For and , the five probability masses are divided by . The sample mean takes values , with variance and standard deviation . At , its variance is and its standard deviation is .
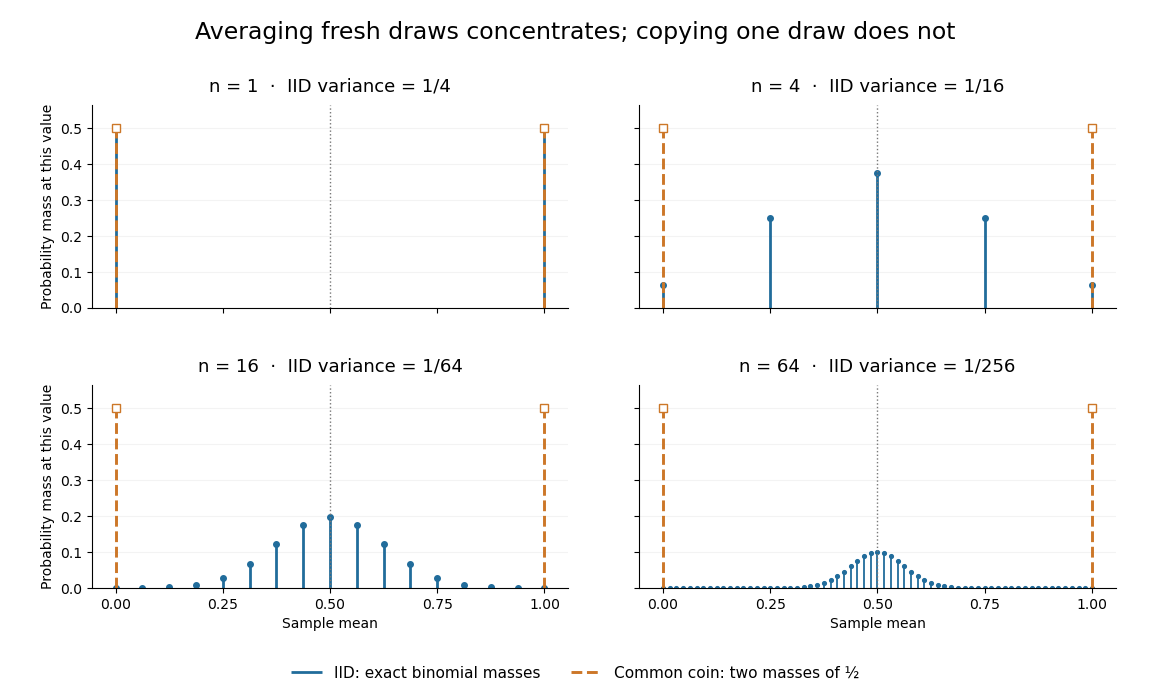
Exact sample-mean distributions distinguish fresh IID draws from a copied common coin
. Original exact binomial distribution probabilities for sample sizes . Blue marks give the mass at each possible mean under independent fair draws. Orange marks give the masses for the same fair draw copied times: at zero and at one for every . These are discrete probability masses, not density values or measured histograms. Details.
Sample mean sufficiency depends on the model 2026-10-14
For the normal sample sum with known variance, assume independent and identically distributed with fixed known variance . The joint probability density factors asThe Fisher-Neyman factorization theorem proves that the sum, and hence the sample mean, is a sufficient statistic for . Its remaining deviations have a joint Gaussian law independent of and are independent of . If both and are unknown, the sample mean alone loses information about variance; the pair is sufficient for the full statistical parameter.
A discrete counterexample shows why a sample mean is not automatically sufficient for arbitrary statistical models. Let be independent and identically distributed on withEach observation has mean one. The arrangements all give sample mean one, yetThis conditional probability is at and at . The conditional distribution therefore still depends on the unknown statistical parameter: this sample mean is not a sufficient statistic. The useful reduction depends on the family of full-data laws, even when its mean stays fixed.
Sample mean under simple random sampling Created 2026-10-14 Updated 2026-11-05
Fix real population values . Define the finite population mean and two normalizations of the finite population variance byThe values are fixed; only the selected subset is random. For its sample mean , the exact design expectation and variance areThe sample mean is an unbiased estimator of the finite population mean. At , every unit is observed and exactly, so the variance is zero. The case is deterministic and is handled directly, since is undefined then.[ref]
Chapter 2: Simple Random Sampling. Sampling Theory, Chapter 2, PDF pp. 2, 6–9: variance normalizations, unbiasedness, covariance derivation and finite population correction
The finite population correction depends on the baseline. With the normalization it is multiplying . With the normalization it is multiplying , the exact variance for independent uniform sampling with replacement. The standard error uses the square root of the relevant variance factor. Mixing the two normalizations gives a wrong answer even at , when replacement cannot matter. For the six-value example, , , and , reproducing without replacement and with replacement.
A short proof exposes the statistical dependence. Let be the value at position in uniform sequential sampling without replacement, so each has expected value and variance . Write . Every ordered pair of distinct labels is equally likely, and , hence for ,Linearity of expectation proves unbiasedness without requiring independence. The variance of a sum includes all ordered covariance terms, givingFor the original population, each pair of distinct draw positions has covariance . Drawing a high value leaves a lower mean among the remaining values, balancing subsequent draws. Equal marginal probability distributions therefore coexist with negative covariance.
When , the sample variance is an unbiased estimator of . To check this independently, use : its expected value is . Thus unbiasedly estimates the variance of the sample mean; its square root estimates the standard error, but need not be unbiased.[ref]
Chapter 2: Simple Random Sampling. Sampling Theory, Chapter 2, PDF pp. 10–12: sample-variance and standard-error estimation
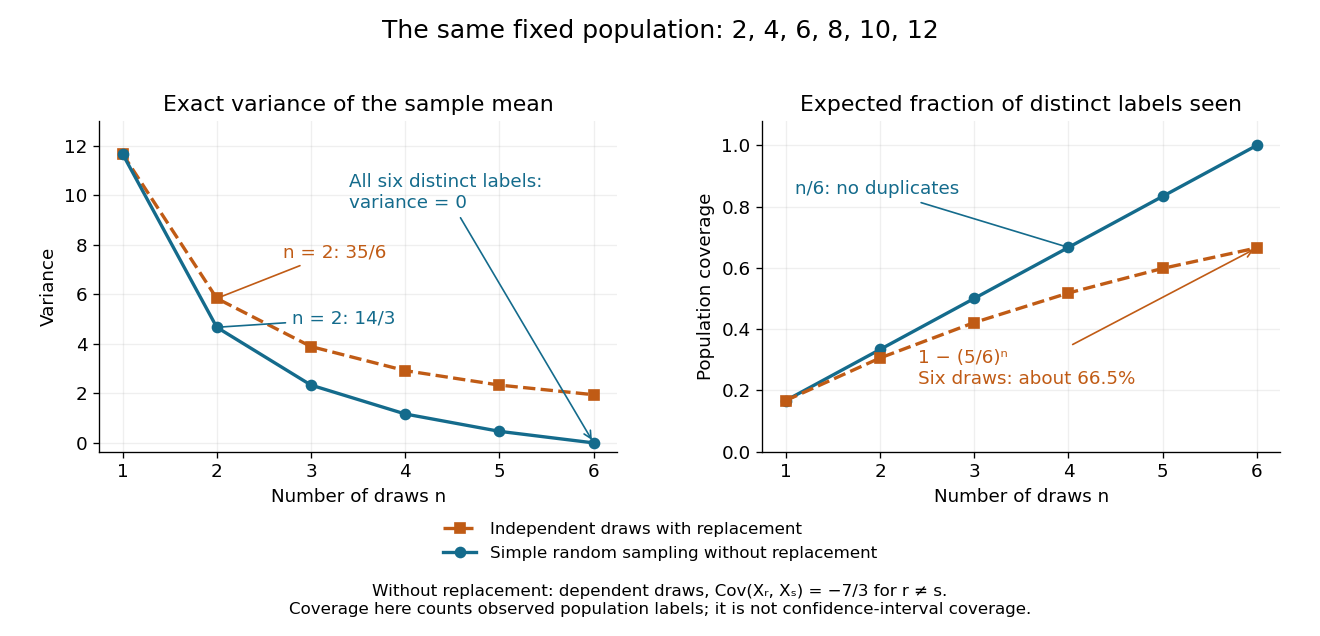
Exact mean variance and expected distinct-unit coverage as sample size grows in the six-value population
. Details. 
The diagram compares variance with the expected fraction of distinct population labels observed. Without replacement this fraction is exactly ; with independent uniform sampling with replacement, a label is missed with probability , so linearity of expectation gives expected fraction . At six draws, replacement covers only about of labels on average and retains sample mean variance ; sampling all six distinct labels covers the population completely and removes selection uncertainty. This population coverage is distinct from confidence interval coverage probability.
The correction matters when the sampling fraction is appreciable. It calibrates uncertainty about this fixed population under the specified selection mechanism. It does not correct unequal selection weights, missing observations or measurement errors; observing every label also does not eliminate uncertainty about a larger unobserved population. Moreover, an exact variance alone does not guarantee the coverage probability of a proposed confidence interval: a small discrete sampling distribution can make a normal approximation inaccurate.
Sample proportion Created 2026-10-07 Updated 2026-11-05
For independent Bernoulli observations with success probability , the sample proportion is the success count divided by the sample size. It is an unbiased estimator with variance . It supplies the arm-specific risks in a risk ratio and the mean difference in a two-proportion comparison.
Sample quantile Created 2026-10-14 Updated 2026-11-05
For observations and , the sample quantile in the generalized-inverse convention iswhere is the empirical distribution function and the observations are ordered with ties retained. For five observations, the sample median in this convention is the third order statistic. Interpolated sample-quantile conventions can give different finite-sample answers.
For the asymptotic statement, assume the observations are independent and identically distributed with cumulative distribution function . Let be its unique -quantile, and suppose has a density continuous and strictly positive at . ThenFor a proof, is exactly the event that at least observations are at most . At , the count is binomial with success probability . The binomial central limit theorem gives the displayed normal limit. A larger density at the target quantile makes the quantile more precisely estimated. The independence and local-density hypotheses are needed; the formula cannot be applied unchanged to arbitrary dependent observations or an atom.
Sample space Created 2026-10-14 Updated 2026-10-14
The sample space is the set of outcomes represented by a probability model. One elementary outcome specifies a complete result at the level of detail the model keeps. An event is a subset belonging to the model's sigma-algebra ; it occurs when the actual outcome lies in that subset. Together with a probability measure , these form a probability space , with .[ref]
Introduction to Probability, Statistics, and Random Processes by Hossein Pishro-Nik. §1.3.1 Random Experiments: definitions of outcome, sample space, and event; three-toss example
Choosing a sample space means deciding which distinctions matter. For two tosses, recording the ordered head-or-tail sequence distinguishes from ; recording only the number of heads merges them. Neither representation is automatically wrong, but the second cannot answer a question about which toss was heads. Keeping a detailed sample space and defining a random variable for the desired observation lets several questions share one model.
A sample space alone assigns no probabilities. Even writing as a Cartesian product does not establish independence: that requires a condition on the probability measure. On a finite sample space with all subsets admitted as events,Only when all elementary probabilities are equal does this become , where the bars denote cardinality. This is the uniform distribution on a finite set, an additional modelling choice.
Sample spaces can also be infinite. For example, take , its Borel sigma-algebra, and the continuous uniform distribution. Then for , so each singleton has probability zero while . Thus an elementary outcome need not carry positive probability, and a continuous model cannot be understood by counting equally likely points. The distinction is developed in zero-probability event and countable additivity.
Sampling a discrete uniform distribution 2026-10-14
Let the numerical support of a probability distribution be . Its cumulative distribution function counts how many values have been passed:It is zero below , equals on for , and is one at and above . Every jump is , even when the horizontal gaps differ.
For inverse transform sampling, take an ideal continuous uniform distribution for on . Partition that interval into intervals of width and outputEach interval has probability , proving the desired discrete uniform distribution. Using the floor function, the index is ; for consecutive integer values the output is . With the usual quantile function convention , one instead writes for , using the ceiling function. The endpoint conventions differ only at a finite set of points with probability zero under the ideal continuous uniform distribution.
For , the four intervals , , , and select , respectively. Thus selects , while selects . The upper half of the interval selects values at least four, recovering probability . Equal widths refer to the sampling probability coordinate, not to distances between output values. This is an exact mathematical construction assuming an ideal continuous uniform distribution; a finite computer random-number source needs its own justification of equal output chances.
Sampling bias 2026-11-05
Sampling bias is a systematic distortion arising when the sampling mechanism makes the observed sample unrepresentative of the target statistical population for the estimand of interest. It is distinct from random sampling variability and from other causes of the bias of an estimator.
Suppose a population has equal-sized groups with values zero and ten, so its mean is five. If independent sampling with replacement chooses the first group with probability , the sample mean has expectation one and converges to one as the sample grows. More data reduce its random variation without removing the selection bias. Known selection probabilities can support a design-based correction, but a group never sampled cannot be recovered merely by assigning larger weights to observed units.
Sampling increment 2026-11-05
A sampling increment is an individual portion collected by one operation of a sampling device. One scoop, one probe withdrawal or one defined cut through a moving stream can produce an increment, provided the collection operation and its extent are specified. IUPAC uses this definition for bulk materials and large units.[ref]
Increment in the IUPAC Gold Book. Entry I03003, definition
Several sampling increments may be combined into a composite sample. Their number describes collection operations; repeated instrument readings of the same prepared material do not create more sampling increments. Nor is an increment necessarily representative of the entire lot on its own: its location, time, amount and selection mechanism connect it to the analytical sampling target.
An original mass-balance example combines a0.10kilogram increment containing2milligrams per kilogram of an analyte with a0.30kilogram increment containing10milligrams per kilogram. With complete transfer and no chemical change, the composite mass fraction isThe unweighted average of the two concentrations would be6milligrams per kilogram. Equal weighting of reported increment concentrations is therefore different from physically combining unequal increment masses. Whether either result estimates the intended lot mean also depends on the collection design.
Sparse contamination supplies a second distinction. In a stipulated model where each independent increment has probability0.01of intercepting a contaminated region, increments all miss it with probability . Even100such increments have a miss probability of about0.366. This is an illustrative detection model, not a universal sample-count rule; spatial dependence and changing increment size alter it.
A collection record should identify the sampling device, each increment's position or collection interval, its amount and any combining or reduction step. Different increment plans can change analytical sampling uncertainty even when the same analytical instrument is used. The collection stage must be varied to assess that uncertainty, rather than only remeasuring one final extract.
Sampling without replacement Created 2026-10-14 Updated 2026-10-14
Sampling without replacement selects distinct labelled units: after a unit is selected it is unavailable for the remaining draws. Distinct labels can carry equal numerical values, so repeated values do not necessarily imply a repeated unit. The rule alone does not specify selection probabilities; a procedure favoring particular units is still sampling without replacement but need not be simple random sampling.
In uniform sequential sampling without replacement, the next label is chosen uniformly among those remaining. For a population of labels, any ordered sequence of distinct labels has probability . Each size- subset has possible orders, so its probability is . This gives the fixed-size simple random sampling design. Equivalently, take the first labels of a uniformly random permutation. Restricting a uniformly random permutation to a specified label set preserves uniformity; biased modulo mappings should not replace uniform selection.
The draw positions have identical marginal probability distributions, but exhibit statistical dependence. If the first label is , the conditional probability that the second label is is zero, whereas its marginal probability is . Thus these draws are not independent and identically distributed when and . For a marked subset of labels, counting size- subsets with binomial coefficients gives the hypergeometric distribution. The resulting negative covariance explains the finite population correction for both counts and sample means.
Sanov theorem Created 2026-09-24 Updated 2026-11-05
Let be independent and identically distributed on a finite alphabet with full-support probability mass function , and let be their empirical distribution. Sanov theorem gives a large deviation principle on the probability simplex, with rate functionusing natural logarithms. For any measurable set , with interior and closure relative to that probability simplex,The method of types explains the exponent: a type class has roughly words, each with probability ; the number of types grows only polynomially.[ref]
Information Theory and Statistics: A Tutorial by Imre Csiszár and Paul C. Shields. Section 2.1, Large deviations via types, printed pp. 429–434
For Bernoulli distribution observations with success probability , the event therefore has probability . The exponent is ; atypical empirical laws closest in relative entropy dominate the rare event.
Scale function of a birth-death chain Created 2026-10-20 Updated 2026-11-05
A strictly increasing sequence for which is a martingale along the birth-death chain before hitting its boundary. With upward and downward probabilities , harmonicity means . This coordinate is useful for hitting probabilities and optimal stopping.
Scale increments for a birth-death chain Created 2026-10-14 Updated 2026-11-05
The interior equation for a harmonic function for a Markov chain on the integers gives . Positive scale increments satisfy . For absorbing boundaries , the lower exit Probability from isThis satisfies the harmonic equation and the boundary values and therefore is the hitting probability. For parity-dependent probabilities, with ; geometric sums distinguish rightward, balanced and leftward escape.
// Target: markov-process.bigb
Scaling classification of a continuous-time symmetric simple random walk Created 2026-10-06 Updated 2026-11-05
For the unit-rate continuous-time symmetric simple random walk, the processes have three finite-dimensional regimes. For no probability limit is possible, because the one-time characteristic functions tend to zero off the origin and are discontinuous there. At the limit is standard Brownian motion. For it is the identically zero Lévy process. This follows from and independent increments. Thus a nonzero limit uniquely determines the exponent, whereas merely asking for a Lévy limit does not.
Schmidt spectrum Created 2026-10-25 Updated 2026-11-05
The nonzero eigenvalues, including multiplicities, of either reduced density operator of a bipartite pure state. A Schmidt decomposition gives and the corresponding expression for by partial trace. Thus unequal marginal spectra rule out a pure joint state. The amplitudes are often called Schmidt coefficients; the spectrum here uses the probabilities .
If the risk set has two subjects with covariate zero and one with covariate one, its hazard-weighted mean is . A zero-covariate event has Schoenfeld function , while a one-covariate event has function . At the true coefficient their probabilities are and , so the conditional expected function is zero.
Schrödinger equation Created 2026-09-24 Updated 2026-10-20
The Schrödinger equation governs the evolution of a quantum state between instances of measurement in quantum mechanics. For a particle of mass moving in a prescribed real potential energy , its position wavefunction satisfiesHere is the Planck constant, is the Laplace operator, and the Hamiltonian operator combines kinetic energy with potential energy. Specify an initial wavefunction, an operator domain and any boundary conditions: the differential expression alone does not completely specify a physical model. The Born rule then turns the evolving probability amplitude into position probabilities through and integration over a region.
This scalar Schrödinger operator describes nonrelativistic quantum mechanics, with relevant momenta much smaller than , where is the speed of light. It omits the constant rest energy , assumes fixed particle number, and suppresses active spin dynamics and coupling to a magnetic vector potential. A free electron with a fixed, uncoupled spin state can still use this scalar model; the Pauli equation supplies the additional spin components and magnetic coupling when needed. A prescribed real describes a closed evolution model or an approximation in which the source of that potential energy is treated as external. Dissipation, particle creation and a general measurement in quantum mechanics need further modelling.
For a time-independent self-adjoint Hamiltonian operator, the spectral theorem defines unitary time evolution byInitial states in the operator domain satisfy the differential equation in the Hilbert space sense; the unitary operator also evolves all other states in that Hilbert space. Time-dependent Hamiltonian operators need suitable regularity and domain hypotheses; their evolution is not generally the exponential of .
The local reason for conservation is especially tangible. Multiply the Schrödinger equation by the complex conjugate , subtract its conjugate multiplied by , and use the fact that the real potential energy terms cancel. For smooth wavefunctions this gives the probability continuity equationThe divergence theorem identifies the change in probability inside a region with minus the outward probability current. Decay at infinity, or appropriate probability-conserving boundary conditions, preserves wavefunction normalization. Conservation of total probability does not require a stationary probability density.
Its usefulness comes from being a linear partial differential equation: quantum superpositions of solutions are solutions, while different quantum phases can produce interference. For a fixed Hamiltonian operator, the time-independent Schrödinger equation finds the energy eigenstates; each then acquires just its own time-dependent quantum phase. One eigenvalue problem therefore organizes both allowed energies and the evolution of arbitrary quantum superpositions, with a continuous spectrum included when required. This is the attractive bridge between a spatial wave problem and a clock: energy differences determine the rate at which relative quantum phases change. It makes atomic spectral lines, quantum tunnelling and quantum scattering calculable from a specified model.
For an explicit example without confinement, take a free particle on the whole line, , initially in a Gaussian wave packet with position standard deviation and mean momentum :Unlike a single plane wave, this wavefunction satisfies wavefunction normalization. A Fourier transform writes it as a quantum superposition of plane waves. Their dispersion relation is , so each Fourier component gains the factor . Completing the square in the resulting Gaussian integral giveswith the square root chosen continuously from . Its position probability density and standard deviation areThe centre moves with the group velocity and the wave packet spreads because different wavenumbers have different group velocities. This is unitary wave dispersion, without a random force or loss of probability. Independently, the initial momentum standard deviation is and the initial position-momentum covariance vanishes. Free evolution gives in the Heisenberg picture, henceThis independently checks the spreading law. The Gaussian integral of is one at every time; the decreasing peak is exactly offset by increasing width.
As hypothetical preparation parameters, choose a free electron with and . Using and givesThe rounded electron mass uses the 2022 adjustment.[ref]
CODATA Value: electron mass by National Institute of Standards and Technology. Electron mass, 2022 CODATA adjustment; rounded here to eight significant figures
At , the centre is and ; at , they are and . The mean kinetic energy staysIt includes both mean motion and the momentum spread. The mean speed is about and the momentum spread corresponds to , making the nonrelativistic model accurate for the appreciably occupied part of this ideal Gaussian distribution. Its mathematically unbounded tails are an idealization.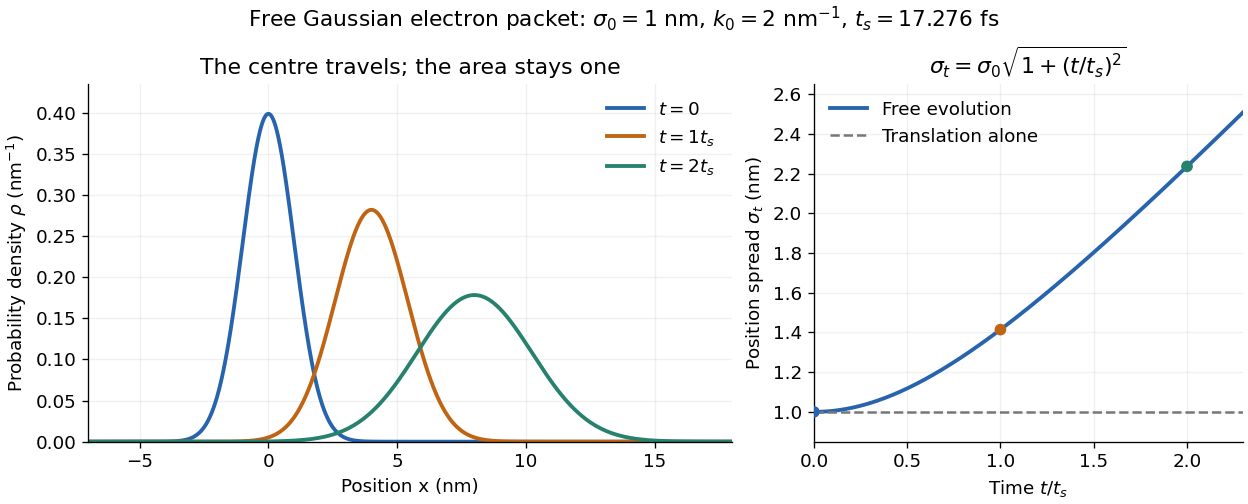

The complex width also explains where the probability goes. Write , where is the dimensionless quantum phase. Differentiating the exact solution givesRelative to the moving centre, the probability current points outward on both sides for . This is a flux statement, not an additional assumption about individual particle trajectories. At and , the relative flow speeds are , about . The probability within a moving interval of half-width falls from about initially to at , exactly because of this outward probability current.
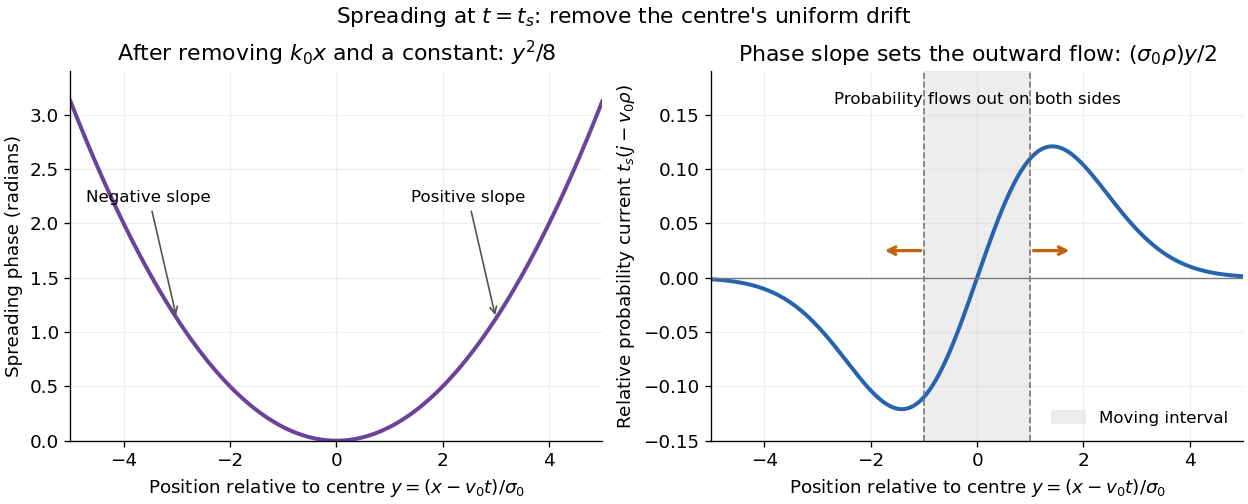
Curved quantum phase drives spreading probability current
. The same free Gaussian wave packet at . With , removing the carrier and a spatially constant quantum phase leaves . The right panel plots : negative to the left, positive to the right. Flux through the marked moving interval endpoints explains its decreasing probability. Source. Details.
Historically, the 1926 Quantisierung als Eigenwertproblem (Erste Mitteilung) by Erwin Schrödinger began with the stationary hydrogen atom problem. It distinguishes discrete negative energies from a positive continuous spectrum; it is not yet the general evolution equation displayed above.[ref]
Quantisierung als Eigenwertproblem (Erste Mitteilung) by Erwin Schrödinger. Printed pp. 361–363, especially p. 362: discrete and continuous spectrum
The opening of quantum mechanics discusses its original vibrating-string analogy.In the 12 December 1933 lecture The fundamental idea of wave mechanics by Erwin Schrödinger, Erwin Schrödinger explains the move from independent rays to waves through diffraction, then applies that analogy to atomic physics. His closing pages explicitly acknowledge the difficulty of reconciling wave language with observed particle tracks. This retrospective physical argument motivates the model; it does not derive the modern Born rule from classical mechanics.[ref]
The fundamental idea of wave mechanics by Erwin Schrödinger. Nobel Lectures, Physics 1922–1941, printed pp. 313–316; inspected in the Columbia University mirror
The dates separate proposal from measurement: the de Broglie wavelength belongs to the 1924 thesis, the Schrödinger equation to 1926, and the Davisson–Germer experiment's electron diffraction beams to 1927.[ref]
The discovery of electron waves by Clinton J. Davisson. Printed pp. 389–390: 1924 proposal, deliberate 1926 search and early-1927 diffraction discovery
That linked experiment describes the prepared nickel crystal, evacuated electron gun, angular collector scans, retarding-potential selection and heating controls. Its measured collector electric current tests wave-dependent scattering probabilities; it neither measures a wavefunction directly nor establishes this equation uniquely.