
Van der Waals throttling model 2026-10-14
A hypothetical Van der Waals equation model illustrates positive and negative Joule-Thomson coefficient regions and a finite throttle that first warms, then cools. Use the molar convention already distinguished in Van der Waals equation:Here is molar volume, the molar gas constant, internal energy per mole, and the stipulated constant molar heat capacity at fixed volume. The second equation is an additional caloric assumption: an equation of state alone does not specify the temperature dependence of internal energy. It satisfies the equilibrium identity . The arbitrary energy reference is set to zero.
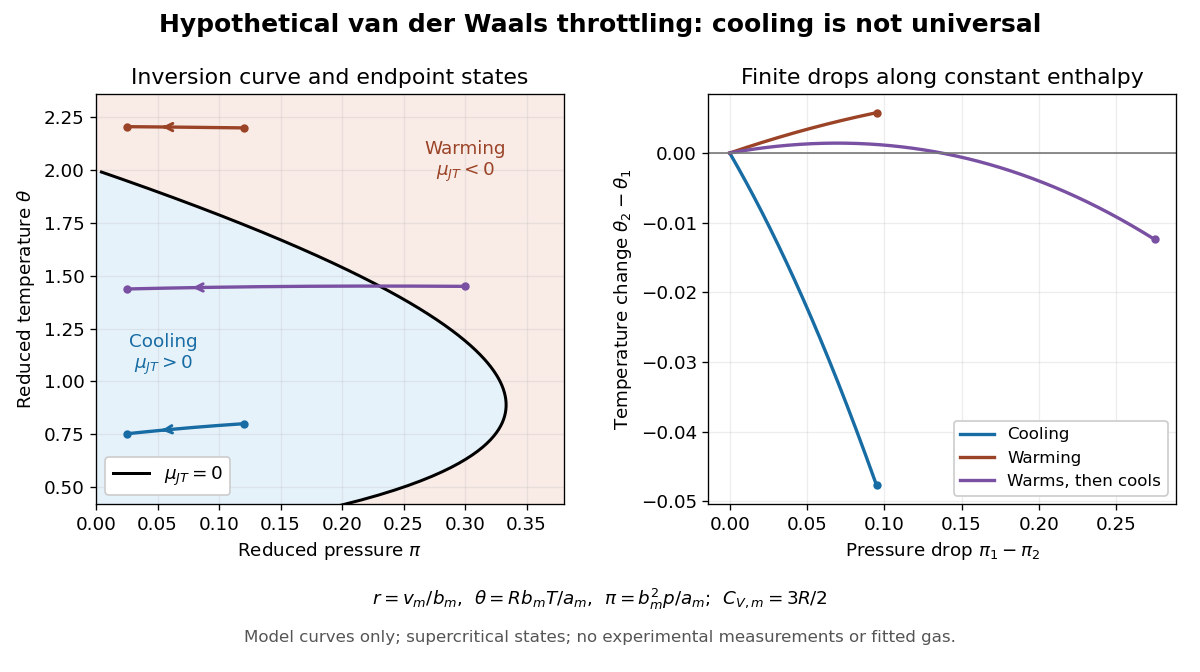
Hypothetical Van der Waals throttling model: Joule-Thomson inversion curve and finite temperature responses
. All curves are original model calculations, not nitrogen, carbon dioxide or other gas measurements. Colors label the response along constant molar enthalpy; arrows point toward lower pressure. The displayed states are above the model Van der Waals critical point temperature and have positive isothermal compressibility. The purple path crosses the zero-coefficient curve and has a temperature maximum. Details.Define dimensionless variables , , and , where is molar enthalpy. These differ from the critical-value scaling in Van der Waals law of corresponding states. The throttle calculation reduces toThus a prescribed inlet fixes , and solving the first and last equations at the outlet pressure gives the final temperature. For an inlet and outlet , the model gives , a decrease of . The inlet instead gives , an increase of . The purple inlet initially warms but ends at for the same outlet pressure. These are reduced toy values, not kelvin readings or experimental evidence. No physical gas parameters were fitted.
For a short inversion derivation, implicit differentiation of the Van der Waals equation at fixed pressure givesInsert this into and substitute back into the equation of state. The Joule-Thomson inversion curve isPositive inversion pressure requires . Its maximum pressure is at , while the upper dilute limit is . Using Van der Waals critical point values, the latter is . The inversion locus depends on the equation of state; the chosen molar heat capacity additionally determines how much temperature changes along each finite throttle.[ref]
Joule-Thompson Throttling. Fitzpatrick, Joule-Thompson Throttling, equations 6.188–6.190 and following paragraph: inversion locus, maximum temperature and limits of the van der Waals prediction
The displayed region has , above the model's critical temperature, and uses only , , and positive . Subcritical calculations require attention to phase coexistence, metastability and the Maxwell construction; an unstable homogeneous continuation is not an equilibrium throttle endpoint. Even on a stable branch, this mean-field theory with constant is a qualitative model, not an accurate inversion map for a particular real gas. Phase transitions, changing composition, appreciable heat leakage or bulk kinetic energy changes require a different property calculation or steady-flow energy balance. At phase coexistence, the smooth single-thermodynamic phase coefficient formula cannot replace a balance involving the phase fraction.
Joule-Thomson inversion curve 2026-10-14
The Joule-Thomson inversion curve is the set of equilibrium temperature–pressure states where the Joule-Thomson coefficient vanishes. For positive heat capacity at constant pressure, its condition is , with the coefficient of thermal expansion. The curve separates locally cooling and warming throttle regions. A finite isenthalpic process can cross it, so the inlet sign alone does not fix the total temperature change. An ideal gas has zero coefficient everywhere, rather than an isolated dividing curve.
Jensen formula proof outline 2026-10-14
Divide by its finitely many interior zero factors, with each factor repeated according to its multiplicity of a zero. The resulting holomorphic function has no zeros of a function in the closed disk, so is a harmonic function and its circle average is by the mean value property for harmonic functions. For each removed factor , with , the circle average of is : factor out and apply the mean value property for harmonic functions to on a neighbourhood of the closed unit disk. Reassembling the factors gives for each zero, proving Jensen's formula.
Radial zero-counting function 2026-10-14
For a nonzero holomorphic function, counts its zeros of a function in the centred open disc of radius , with multiplicity of a zero. Thus a double zero counts twice, even though it is a single point. On every smaller closed disk in the domain the count is finite. The strict inequality specifies the convention at a zero modulus; elsewhere it agrees with counting in the closed disk. In the polynomial circle log-mean example the count is zero, one and two on the three displayed intervals.
Circle log-mean of a holomorphic function 2026-10-14
Under the hypotheses of Jensen's formula, the circle log-mean is the angular average of the natural logarithm of the complex modulus. The factor normalizes the integral to a mean. It averages values at equally weighted angles on the circle, and Jensen's formula computes it from and the interior zeros of a function.
Normalizing extensive quantities 2026-10-14
Dividing two extensive quantities with the same replication factor produces an intensive quantity:Division by volume gives a density, such as mass density or energy density . Division by mass gives a specific quantity, such as specific internal energy or specific volume . Division by amount of substance gives a molar quantity, such as molar volume . Their units are respectively , , , and . The denominator must be stated: “per particle”, “per mole” and “per unit mass” are different normalizations.
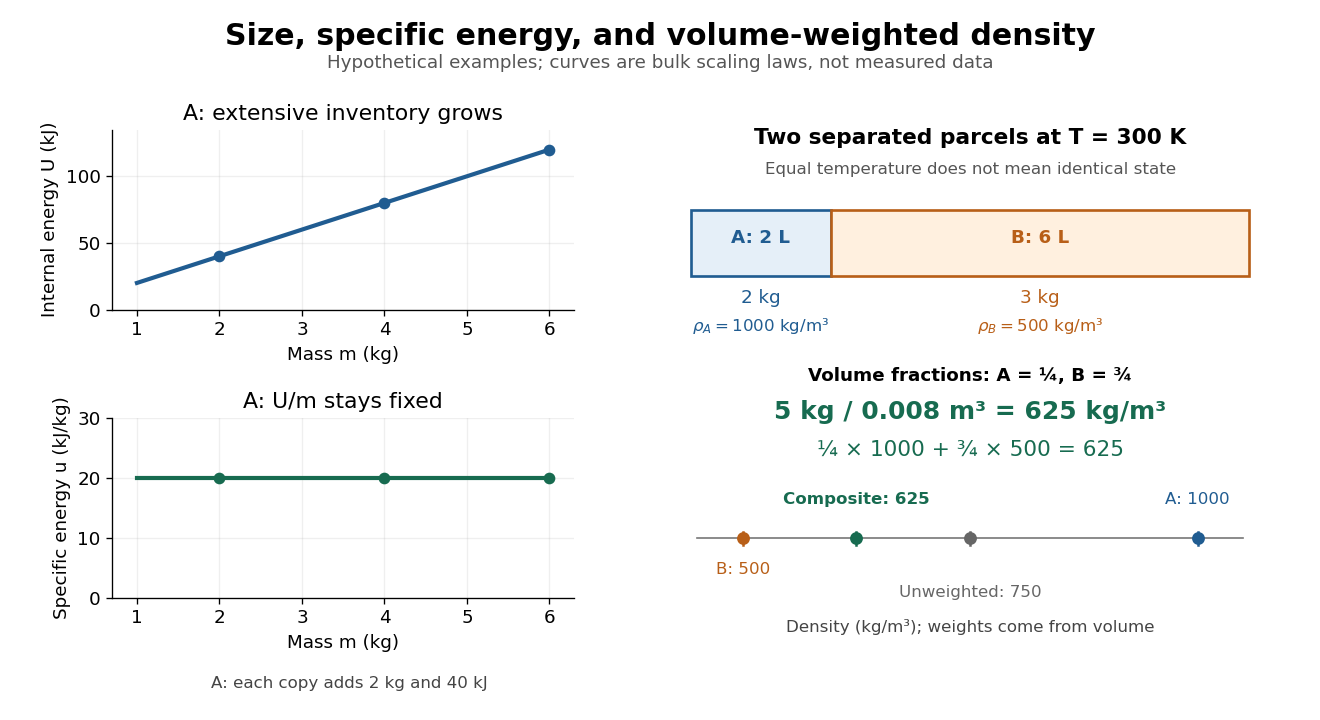
For a hypothetical uniform parcel with mass , volume and internal energy relative to a specified reference, and . Three independent copies have , and ; both ratios remain unchanged. This permits comparison of materials without confusing the amount tested with the state tested.
If and are additive but the parcels have different , their composite ratio is a weighted arithmetic mean:The denominator supplies the weights: specific internal energy uses mass weights, while mass density uses volume weights. This identity is accounting for the specified subsystems; predicting a new state after mixing also needs the relevant equation of state.
Tube lens 2026-10-14
The optical lens assembly that focuses the objective's parallel bundles into the intermediate microscope image in an infinity-corrected microscope. Its focal length participates in the objective-system transverse magnification .
Heat exchanger Created 2026-10-14 Updated 2026-10-18
A heat exchanger transfers heat between a fluid and another fluid or its surroundings. In measuring the Joule-Thomson effect with a porous plug, an upstream coil restores the inlet temperature before the measurement throttle; it belongs outside the approximately insulated measurement control volume.
Proof outline of Hardy's integral inequality 2026-10-14
For a nonnegative , first set and . These bounded functions vanish near zero and have compact support. Their averages have finite Lp norms: they vanish near zero and decay as beyond . Integration by parts givesThe boundary term vanishes at zero because is zero there, and at infinity because is eventually constant and . The inequality is Hölder's inequality with conjugate exponents and . Divide when ; the zero case is immediate. Since and , the monotone convergence theorem proves the full bound without presupposing that has finite Lp norm. Apply it to for the signed or complex case.[ref]
Inequalities by Godfrey Harold Hardy and others. Inequalities, second edition, §9.8(ii), truncation and integration by parts, printed pp. 242–243
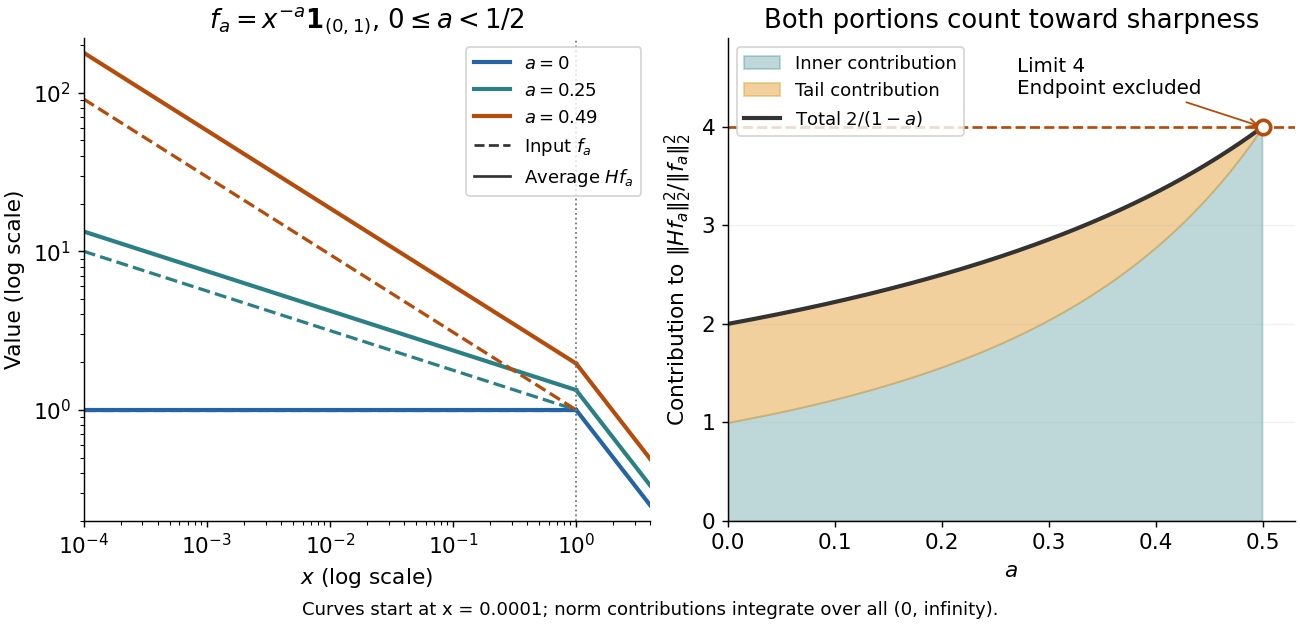
The indicator function example reaches a squared L2 norm ratio of two. To approach four, concentrate more strongly near zero. For , use the measurable functionAll integrals use Lebesgue measure . Keeping both portions of the squared L2 norm givesConsequently,Every allowed member has ratio strictly below four. For any proposed constant , a sufficiently large has ratio greater than . Combined with Hardy's integral inequality, this proves that four is the smallest possible squared L2 norm constant.[ref]
Inequalities by Godfrey Harold Hardy and others. Inequalities, second edition, §9.8, Theorem 327, printed p. 240, and sharpness argument on printed p. 243
The endpoint is excluded: at , , and the inner portion of also diverges. Its tail still has finite integral four. There is no finite L2 norm ratio at this endpoint, hence no equality example obtained by substituting it. The limit four is unattained by this family. Multiplying each by makes its L2 norm one without changing the ratio.
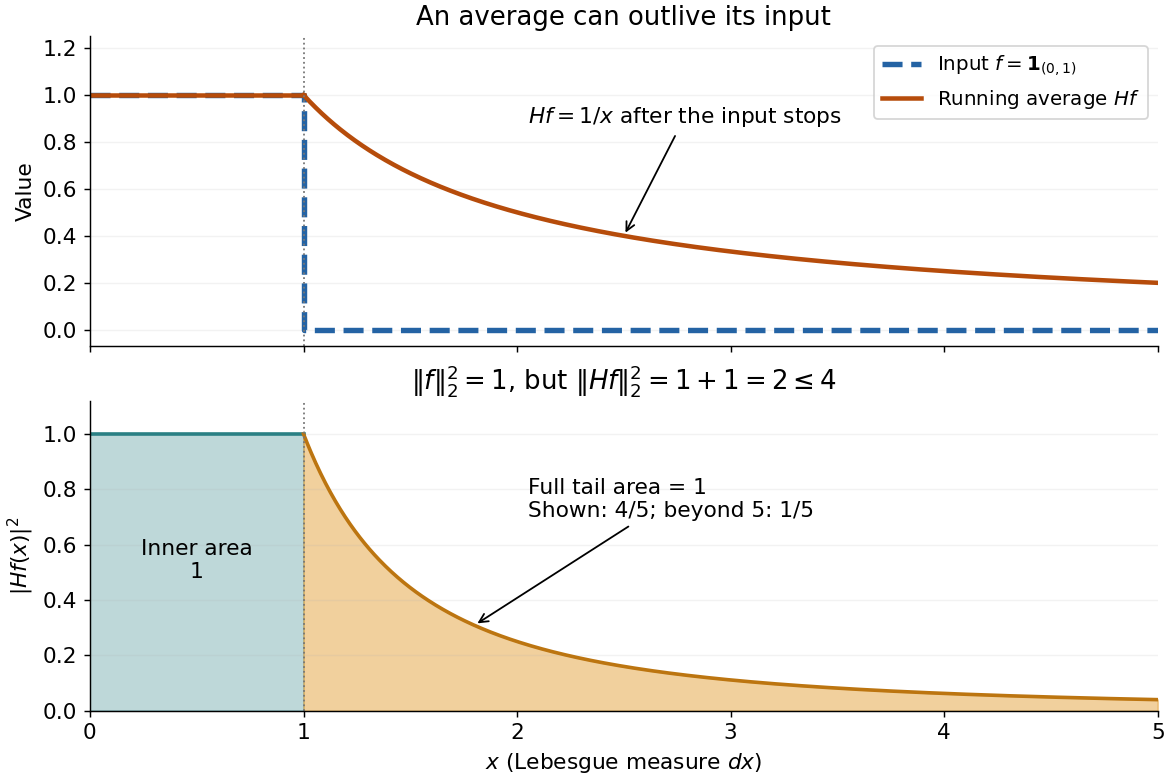
Take the indicator function . Direct integration givesAlthough the function vanishes beyond one, its average remembers the unit area accumulated before one. Squaring and integrating both portions givesThus the tail accounts for half of the squared L2 norm. Averaging does not always decrease the L2 norm with this Lebesgue measure on the half-line. The same indicator function also explains the restriction : , so its average is not in L1 space.


Hall theorem proof outline 2026-10-14
For sufficiency, take a matching in a graph of maximum size and suppose a left vertex is unmatched. Follow unused edges from left to right and matching edges back to the left. An unmatched reachable right vertex yields an augmenting path in a matching, contradicting maximal size. Otherwise let be the reachable left and right sets. Every member of is matched to a distinct member of , and every member of is reached this way. Since , we obtain , contradicting the Hall condition. Finiteness ensures that a maximum-size matching in a graph exists.
The alternative Hall induction through a tight set uses mathematical induction: a proper nonempty subset with splits off a balanced induced subgraph; without such a tight set, deleting one chosen edge's endpoints preserves the Hall condition on the smaller left side.
System of distinct representatives 2026-10-14
A system of distinct representatives for a finite indexed family of finite sets chooses one element per index, with all choices distinct. Form a bipartite graph with left vertex set , right vertex set , and edges whenever . Matching saturation of is precisely a system of distinct representatives. Hence Hall's marriage theorem says that such choices exist exactly when for every subset . Repeated equal sets still have separate indices and separate demands.
Hall allocation model 2026-10-14
In a unit-capacity assignment problem, left vertices represent demands and right vertices represent individually usable resources; an edge records compatibility. All constraints must be encoded by those allowed pairs and by using each resource at most once. Hall's marriage theorem decides feasibility. Costs belong to an additional mathematical optimization problem; precedence between jobs or requirements for consecutive slots need additional modelling.
The authored Notes on the design of a conference scheduler by David R. MacIver (Implementation, 7 August 2022) illustrates a Hall obstruction with four talks confined to three slots. With one talk per slot, that subset has size four and a graph neighbourhood of size three. An unused slot outside its graph neighbourhood does not remove the bottleneck. In the three-job example above, the same scheduling model instead has two complete assignments.
The allocation exercise in Graph Theory by Reinhard Diestel (Matching, Covering and Packing, printed p. 20, Exercise 9) asks for disjoint subsets of prescribed nonnegative integer sizes . Replace demand by left vertices with allowed resource set . Hall's marriage theorem gives exactly the conditionFor a numerical instance, let , , and . The separate demands and their combined demand fit, and works. Raising to two leaves both individual tests valid but demands four distinct resources from a set union of size three. This is the same collective obstruction with repeated demand vertices.
Hall condition 2026-10-14
The Hall condition requires enough distinct neighbours for every subset of the specified left vertex set in a finite bipartite graph. Checking the whole left set establishes only one inequality. Checking singleton sets establishes only that each left vertex has positive degree of a vertex. Overlapping lists can pass both tests and still fail to admit matching saturation of the left side.
In 2014, Gabriele Rosi and colleagues used atom interferometry: two rubidium-87 clouds prepared by laser cooling in vacuum, apart, received shared three-pulse Raman transitions spaced by . Fluorescence readout and paired-fringe ellipse fitting yielded differential wave phase. Twenty-four tungsten alloy cylinders, about total, moved between C and F. Cloud subtraction rejected shared vibration; configuration subtraction isolated the source change.[ref]
Precision Measurement of the Newtonian Gravitational Constant Using Cold Atoms by Gabriele Rosi and others. Main text pp. 3–5; Methods pp. 13–14; Fig. 1 caption p. 21
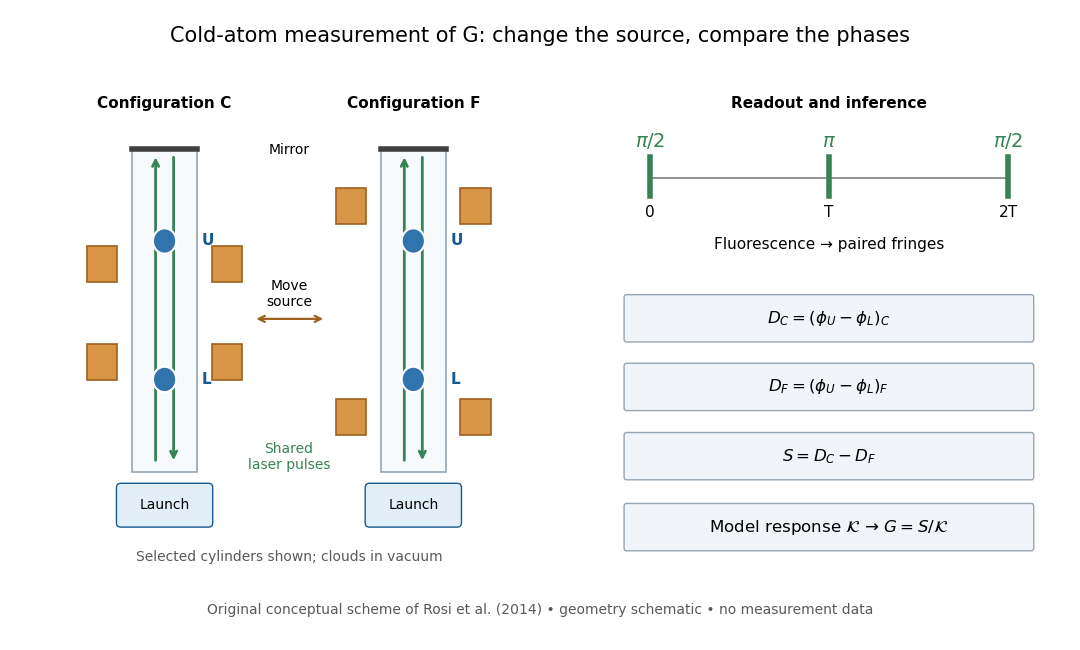
Precision Measurement of the Newtonian Gravitational Constant Using Cold Atoms by Gabriele Rosi and others. Main text pp. 3–5 and Fig. 1 caption p. 21
Details.
Calibration used timed flight and light-sheet crossings; mirror tilt compensated Earth rotation. Wave vector reversal rejected unwanted shifts. Modeling included source Newtonian gravitational potential, atom trajectories, cloud distributions and moving supports. Source positioning, mass density variation and cloud geometry limited the reported combined relative standard uncertainty to parts per million.[ref]
Precision Measurement of the Newtonian Gravitational Constant Using Cold Atoms by Gabriele Rosi and others. Main text pp. 5–6; Methods pp. 14–18; Table 1, p. 27
To understand the subtraction without reproducing that full analysis, consider an ideal atom interferometer in uniform vertical acceleration during each pulse sequence. Let be its signed effective vertical wave vector component and the pulse spacing. Its acceleration-dependent wave phase is ; labels U and L denote upper and lower clouds. The double difference is thenA background field identical in C and F cancels even if it differs between the two clouds. In a fixed-geometry, linear-response model, write , where is calculated from the source mass density, calibrated pulse sequence and atom trajectories. Thus . Measuring wave phase accurately is one part of the task; calculating accurately is another. The real nonuniform field and finite clouds require the trajectory-dependent analysis described above rather than this uniform-field approximation.
A laboratory determination of the gravitational constant must connect a sensor's reading to a gravitational signal from independently characterized masses. For an ideal two-point mass force measurement, invert the model:These are signed small changes obtained by taking the logarithmic derivative, not an instruction to add standard uncertainties with signs. For independent small input uncertainties, linear propagation of uncertainty instead givesCorrelated inputs require their covariances too. In particular, common geometric calibration errors must not be treated as independent simply because several distances were recorded.
For a concrete model check, hold the actual force and masses fixed but overestimate a true by . The exact inferred ratio isThe resulting bias is parts per million, already comparable with the relative standard uncertainty of the recommended gravitational constant. A sensor can resolve very small changes while its inferred answer remains limited by source geometry. The example concerns one idealized separation; it is not an uncertainty estimate for any actual experiment.
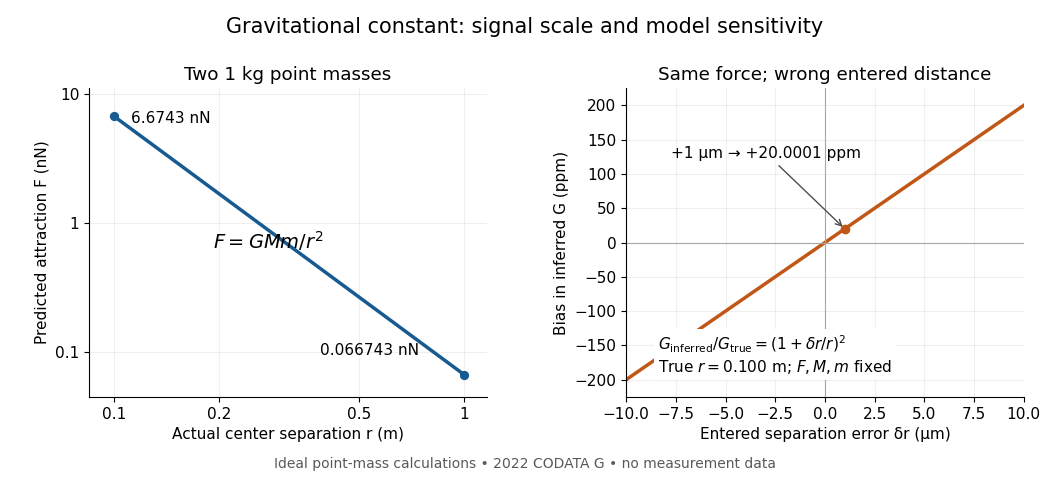
Weak laboratory attraction and the geometric sensitivity of an inferred gravitational constant
. Left: ideal force between two stipulated point masses using the 2022 recommended gravitational constant. Right: exact model bias when only the separation entered in the inference changes. These curves are calculations, not measurement data. Details.
Making the source mass larger or bringing it closer strengthens the signal, but also makes detailed mass density and geometry important. Nearby apparatus supplies its own Newtonian gravitational field; electromagnetic shielding does not remove that attraction. Sensor offsets, changing temperature, vibration and source motion can imitate or alter a signal. The Cavendish experiment illustrates calibration of a torsion constant; a different sensor requires its own calibrated response and a full source model.
Repeating readings can reduce independent measurement noise, but a fixed scale error survives averaging. A useful experiment deliberately changes the source configuration, checks whether the signal follows the predicted change, and characterizes what moves with the source. A systematic error that changes with that configuration also survives background subtraction. Comparing methods with different sensors and different dominant errors is therefore valuable.
Gravitational mass degeneracy 2026-10-14
An orbit around an isolated source constrains its standard gravitational parameter rather than independently measuring the source's mass and the gravitational constant. In the test particle approximation, a circular orbit of radius and orbital period satisfiesThe left equation equates the required centripetal acceleration to the gravitational acceleration. More generally, a Kepler orbit depends on the same . In the exact relative two-body problem, replace by .
For any positive dimensionless number , replacing by and by leaves and every predicted test particle trajectory unchanged. This is the gravitational mass degeneracy: more observations of the same orbit can refine without separating its factors. A laboratory source whose mass is calibrated independently supplies the missing information.
Consequently an astronomical mass expressed in kilograms as inherits measurement uncertainty from , even if is known much more precisely. To first order,When the relative standard uncertainty of is negligible, that of is approximately . Conversely, the ratio of two source masses inferred using the same is , so this common factor cancels. That distinction explains how excellent orbit determination can coexist with less precise absolute astronomical masses.
Germination assay 2026-10-14
A specified test for germination, recording the endpoint, conditions and observation window. For a proposed red/far-red light test, use randomization to allocate one seed lot to darkness, red, red then far-red, and red then far-red then red. Match hydration, temperature, handling and elapsed time before counting; use sham waiting periods to equalize schedules. Use dish replication, retain the dark scientific control, and record radicle emergence using an observation procedure that does not itself provide an uncontrolled light treatment. This is a proposed design, not a claim about the 1952 paper's randomization or replication.
As an original hypothetical counting example, begin with seeds in one dish. Suppose 12 first meet the radicle endpoint by 24 hours, eight additional seeds by 48 hours, and four additional seeds by 72 hours. These invented event counts giveand cumulative sample proportions , and . The 48-hour increment is , not ; the latter includes earlier events. Counting the same emerged radicle again at each inspection would inflate the total. These numbers illustrate bookkeeping, not biological rates or treatment effects.
With a fixed denominator and irreversible classification of the first endpoint event, the set counted at an earlier inspection is a subset of the set counted later. Hence and cannot decrease. This short proof applies to cumulative germination counts even if a later seedling dies. A count of currently surviving seedlings has a different definition and can decrease.
For treatment comparisons, the dish may be the experimental unit: seeds in the same dish share conditions. Forty seeds in one dish do not supply forty independent dish replicates. Report the sample size, replication, endpoint time and denominator; a sample proportion by a deadline measures this assay's outcome, not an unconditional fraction with seed viability.
Lettuce red and far-red germination experiment Created 2026-10-14 Updated 2026-11-05
The 1952 experiment used Grand Rapids lettuce seeds on wetted blotters in covered dishes. After 16 hours in darkness, seven lots of 200 received successive alternating exposures: one minute of red light at –, then four minutes above , with one lot removed after each exposure. Treated lots and a dark scientific control remained at for two days; germinated seeds were counted. Separate wavelength tests used a two-glass-prism spectrograph.[ref]
A Reversible Photoreaction Controlling Seed Germination by Harry Alfred Borthwick and others. A Reversible Photoreaction Controlling Seed Germination, pp. 662–664: preparation, spectrograph and alternating-exposure protocol
Table 1 shows alternating promotion and suppression according to the final exposure. Red light could restore promotion after far-red light; suppression was incomplete. This reversibility supports a reversible sensing state rather than simple cumulative illumination. The paper did not isolate or identify the pigment; the response concerns this lettuce preparation and timing. Its readout was a two-day germination count, not subsequent seedling performance.[ref]
A Reversible Photoreaction Controlling Seed Germination by Harry Alfred Borthwick and others. A Reversible Photoreaction Controlling Seed Germination, p. 663 pigment-identification limitation and p. 665 Table 1
The modern phytochrome description distinguishes forms and that interconvert under red and far-red light. This provides a concrete example of signal transduction: light changes a sensing state that affects development. The response should be distinguished from photosynthesis, which supplies chemical resources.[ref]
Biology 2e by Mary Ann Clark and others. Biology 2e, §30.6 The Phytochrome System and the Red/Far-Red Response, Figure 30.38: interconversion and cellular response
There are unlisted articles, also show them or only show them.