
Metabolic pathway Created 2026-10-14 Updated 2026-10-18
A metabolic pathway is a connected sequence of enzyme-catalyzed chemical reactions in metabolism, with a reaction product of one step serving as a substrate for another. A pathway boundary is a choice about which transformations to count: glycolysis ends at pyruvate, whereas subsequent fermentation or cellular respiration changes the final material balance. Adding the individual chemical equations cancels internal intermediates and exposes the net stoichiometry; it does not determine the reaction rate.
Cell-free extract 2026-10-14
A cell-free extract is material obtained from disrupted biological cells after removing intact biological cells. Its biochemical activity can be tested separately from the whole organism. It can contain many enzymes and substrates, together with cofactor components; cell removal is different from purification of one component.
ATP-driven sugar phosphorylation 2026-10-14
Hexokinase provides a concrete connection between sugar chemistry and energy coupling: it transfers a terminal phosphate group from ATP to glucose, forming a phosphorylated sugar and adenosine diphosphate. The enzyme accelerates the transfer, while consuming ATP changes the net chemical reaction being carried out. The donated group reaches the substrate through the catalytic route.[ref]
Biology 2e by Mary Ann Clark and others. §7.2, First Half of Glycolysis, step 1: hexokinase and ATP-dependent glucose phosphorylation
For a symbolic teaching model, write for an unphosphorylated sugar, for its phosphorylated form, and for inorganic phosphate. These are labels for chemical states, not complete elemental formulas. Using one consistent reference convention at fixed pH and temperature, stipulate the following molar changes in Gibbs free energy:All three numbers are chosen illustrative values, not measured properties of glucose or a particular enzyme. The prime marks a biochemical reference convention with pH held fixed; explicit proton and metal-binding bookkeeping is suppressed consistently. The first two lines are a thermodynamic decomposition: cancelling water and inorganic phosphate gives the net transfer. They do not assert that the reaction mechanism first releases free inorganic phosphate and then recaptures it.
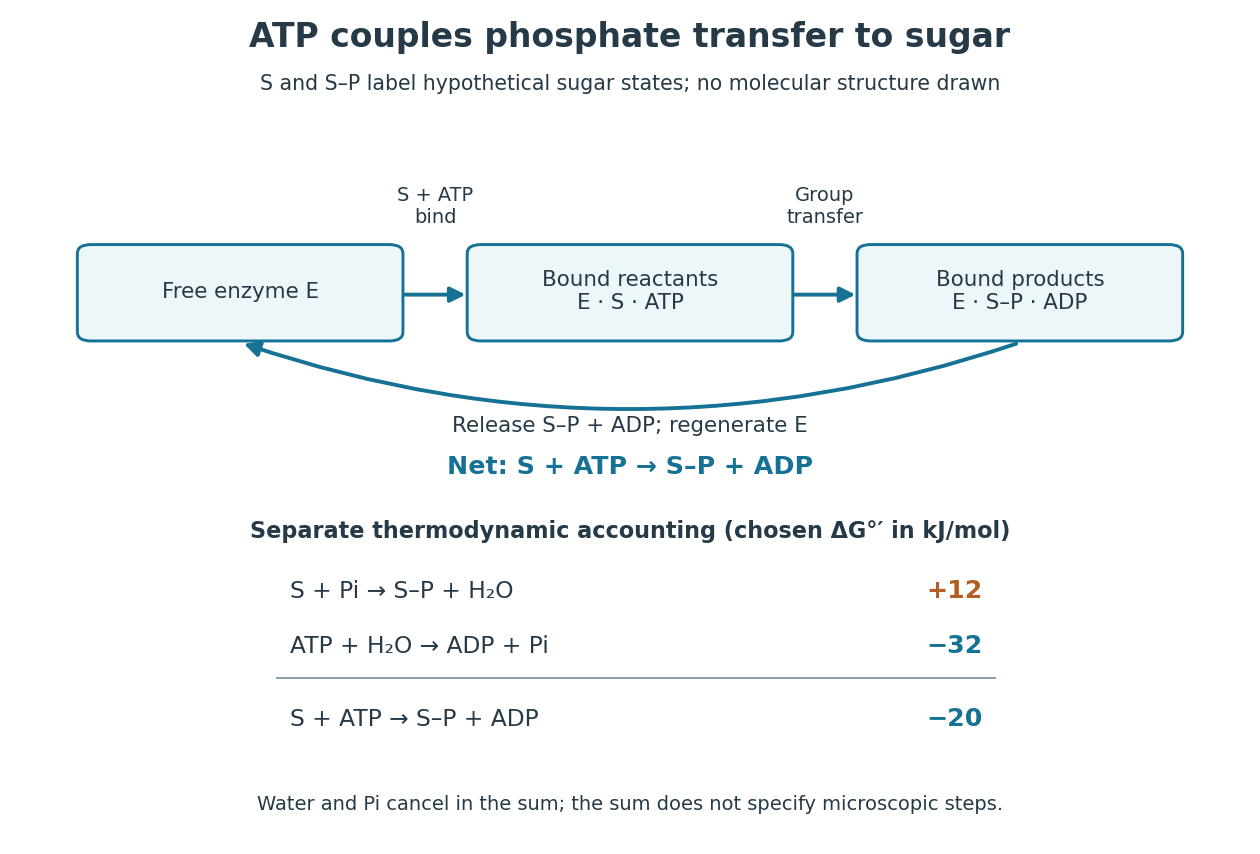

Because Gibbs free energy is a state function, consistently defined reaction changes add. A working reaction mechanism must also connect the desired conversion to ATP consumption; independently allowing ATP hydrolysis beside the sugar does not establish energy coupling. The general distinction is developed under energy coupling. ATP-dependent phosphorylation of a membrane protein can likewise connect a chemical change to active transport.[ref]
Biology 2e by Mary Ann Clark and others. §6.4, Energy Coupling, Figure 6.14: transfer to the sodium-potassium pump and its conformational cycle
Actual Gibbs free energy changes depend on thermodynamic activities. Even a favourable reference sum can be overcome by accumulation of reaction products or depletion of ATP; it supplies no prediction of the reaction rate. A living biological cell also regenerates ATP. Sustained operation therefore requires a connected metabolism, not an inexhaustible stock of a special molecule.
Selective biochemical reaction pathways 2026-10-14
An enzyme accelerates particular chemical reactions, with catalytic selectivity arising from recognition and from the relative ease of the subsequent chemistry. Strong binding alone does not guarantee fast conversion. Nor does catalysis change the chemical equilibrium for an unchanged net chemical reaction. These distinctions explain how enzymes can direct the flow of material without creating an extra source of free energy.[ref]
Chemistry 2e by Paul Flowers and others. §12.7, opening paragraphs and Enzyme Structure and Function: alternative mechanisms, regeneration and specificity
For an original model of competing routes, let a substrate become either a desired reaction product or another reaction product :The labels represent hypothetical chemical species with the same elemental composition, not molecular structures. Assume fixed volume, irreversible first-order reactions, constant effective rate constants, and initially of with neither reaction product present. The model approximates a limited operating regime; real enzyme kinetics can include saturation and reverse reactions.
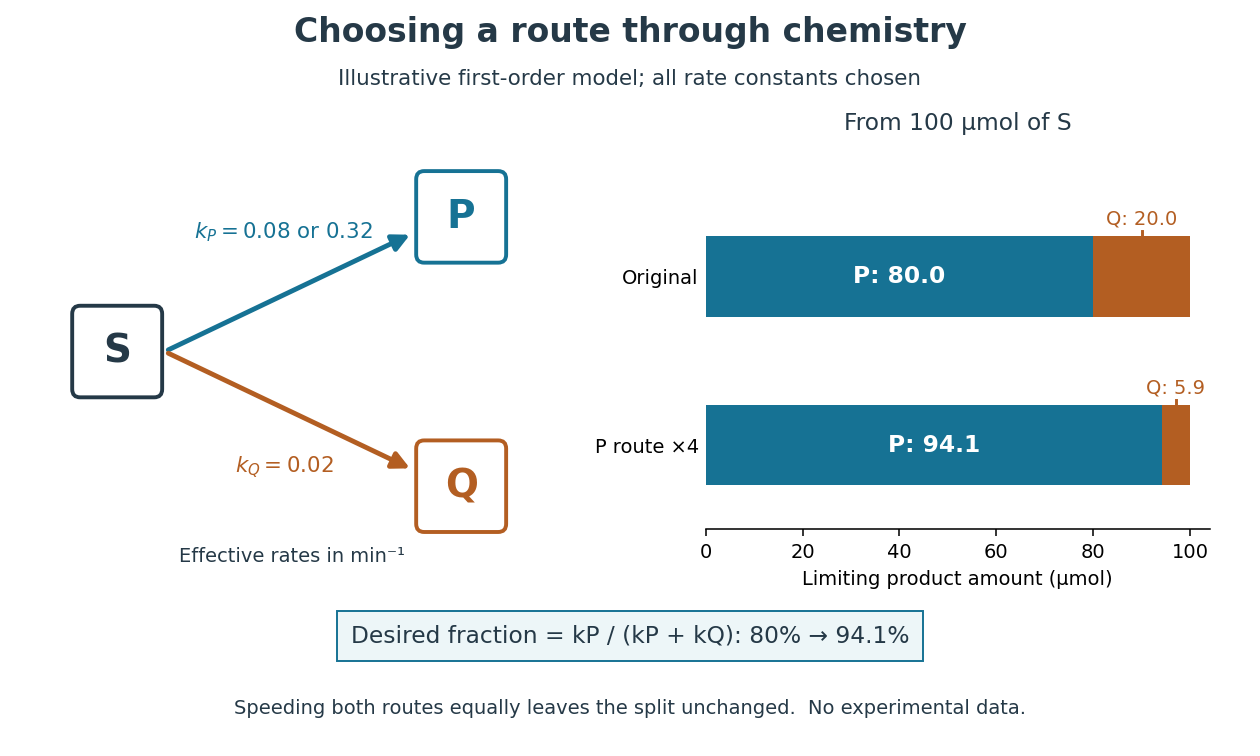
Selective acceleration changes the split between competing biochemical reaction products
. Original illustrative chemical reaction network and limiting product amounts from of hypothetical . Chosen effective rate constants are or and . The boxes label chemical species; they are not molecular structures. The bars are model limits, not experimental data. Details.
The reaction-rate equations give , and , where denotes amount of substance. Consequently,With and , the eventual split is of and of . At ten minutes, the calculated amounts are approximately , and for , and . Selectively increasing fourfold changes the eventual desired fraction to . Increasing both rate constants fourfold instead preserves the split and only shortens the conversion time. Speed and selectivity answer different questions.
The bookkeeping matters independently of that model. In ideal alcoholic fermentation, complete conversion of of glucose yields each of ethanol and carbon dioxide. Of the initial of carbon chemical atoms, remain in ethanol and enter carbon dioxide. This is a chosen material-balance example using the net stoichiometry explained under Saccharomyces cerevisiae; it gives neither an observed yield nor the mechanism of the individual steps. Equal amounts of the two reaction products also do not mean equal masses.
Dialysis (biochemistry) Created 2026-10-14 Updated 2026-10-20
Dialysis exchanges small solutes between a sample and an external bath through a semipermeable membrane, while retaining suitably large macromolecules, such as proteins. The transport is passive diffusion: random motion carries permeant molecules both ways, with net transport down their concentration gradient. The bath is the dialysate. At equal permeant solute concentrations, microscopic exchange continues but net exchange stops.[ref]
Dialysis: an overview, Pierce Biotechnology technical note. Dialysis: an overview, Tech Tip 20, p. 1, Dialysis is Diffusion Through a Semi-Permeable Membrane
For example, a protein sample containing excess sodium chloride can lose the small ions to a low-salt dialysate without deliberately transferring the protein. Conversely, components of a new buffer solution can enter from the bath. This is useful before studying enzyme kinetics: changing the surrounding chemical solution can remove an interfering small solute while keeping the enzyme available for the next experiment.
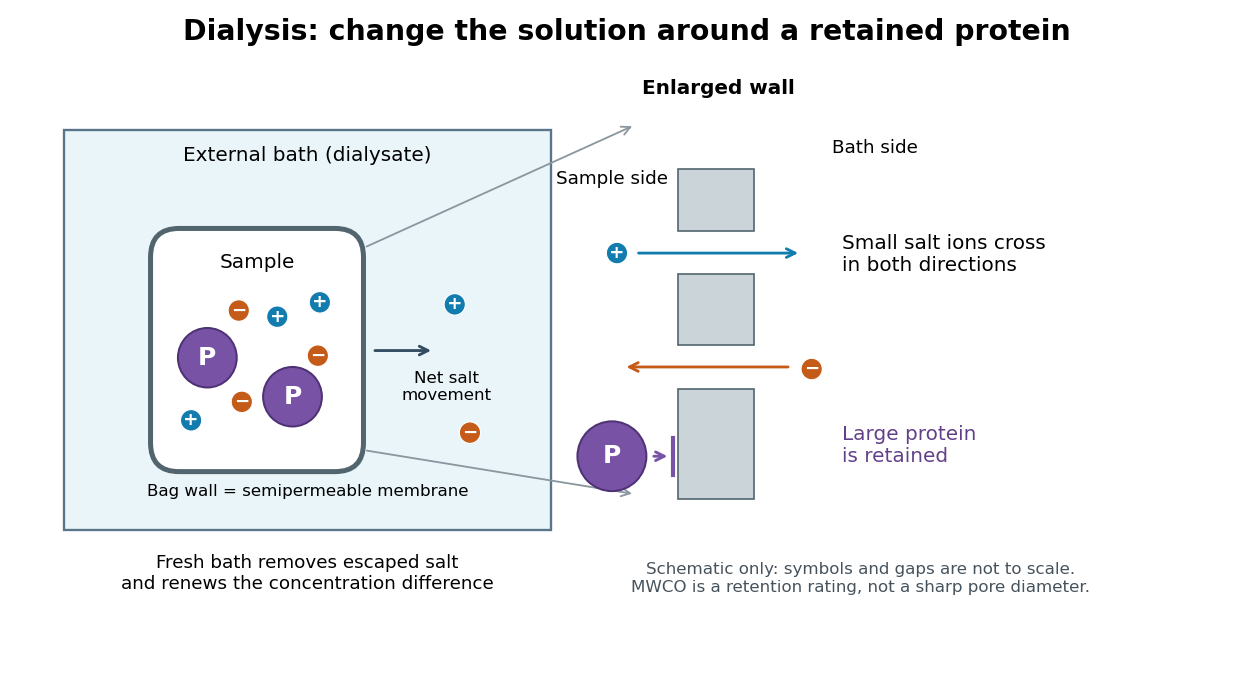

The striking feature is that the retained protein does not have to be captured and released again to change its surroundings. However, retention is conditional on the semipermeable membrane and the particular macromolecule, and dialysis is poorly suited to separating proteins of nearly the same size. The molecular weight cut-off is a nominal retention rating, not a sharp geometrical boundary.
Atomic measurement methods Created 2026-10-14 Updated 2026-10-18
Methods for preparing and probing chemical atoms in atomic physics.
List of astronomers Created 2026-10-14 Updated 2026-10-20
Bicinchoninic acid assay Created 2026-10-14 Updated 2026-10-20
An assay that estimates protein concentration from a colour-producing chemical reaction, measured by absorbance and compared with known protein reference samples. Bovine serum albumin is commonly used as the reference protein. The readout estimates protein content rather than identifying each protein in a mixture.
Suppressed-carrier amplitude modulation Created 2026-10-14 Updated 2026-11-05
In suppressed-carrier amplitude modulation, a message multiplies a carrier without adding a large standalone carrier term. The double-sideband form is , with spectrum . Multiplying by a phase-aligned local oscillator and low-pass filtering recovers under appropriate bandwidth separation. A phase error instead scales the recovered message by . Thus ordinary envelope detection is not generally enough; coherent carrier phase information matters. Suppressing the carrier changes power allocation without removing both sidebands.
Amplitude modulation laboratory 2026-10-14
Rice University's ELEC 332: In the Lab makes the model experimentally testable. Preparation resets the spectrum analyzer and observes an unmodulated generator output on it and an oscilloscope. A Wavetek function generator supplies external modulation. The specified carrier and message separate three peaks. Marker readouts give frequency and level; narrowing resolution bandwidth shows how the instrument broadens a line.[ref]
ELEC 332: In the Lab, Rice University. ELEC 332: In the Lab, Part 1, “Initial Configuration”, “Initializing”, “Observing a signal”, “Changing the bandwidth”, “Using the marker” and “Resolving signals”
Part 3 uses an SA602 analog multiplier module. The message generator also triggers the oscilloscope; multiplier output feeds both displays. A no-offset module supplies a suppressed-carrier control. Replacing it with the offset-adding module restores the carrier; varying levels tests signal distortion. Finally a radio receives the conventional AM transmission, and varying message frequency checks that the heard tone belongs to this source. These are prescribed observations, not reported measurements.[ref]
ELEC 332: In the Lab, Rice University. ELEC 332: In the Lab, Part 3, module descriptions and “Connect the components” through “AM transmitter”: input/output connections, offset control, level sweep and receiver check
Calibration matters: verify generator voltage at the connected input, distinguish peak from peak-to-peak amplitude and root mean square, and check analyser units and loading before comparing heights with or power with . The unmodulated carrier is a reference control. Limited resolution can merge sidebands; generator harmonics can add peaks. Rice explicitly demonstrates both limitations in Part 1.[ref]
ELEC 332: In the Lab, Rice University. ELEC 332: In the Lab, Part 1, “Resolving signals”: message-generator harmonic distortion and unresolved sidebands when the message frequency is reduced
A complementary University of Kansas procedure, A.2 - Amplitude Modulation, calibrates the added carrier and the suppressed-carrier product separately to peak-to-peak before recombining them. It holds the carrier fixed, varies modulation depth, reads envelope extrema and carrier-to-sideband power differences, then connects the demodulator and adjusts its tunable low-pass filter for recovery, comparing the output with the message. These are setup targets and comparison instructions, not measured results.[ref]
The inference combines time and frequency spectrum readouts: correct sideband spacing tests frequency translation, relative heights test modulation depth, and the recovered message tests the detector. Hardware clipping, receiver filtering and noise can spoil recovery even at . Conversely failure of an envelope detector at does not demonstrate failure of a synchronized multiplier receiver. The two diagrams above illustrate the stipulated linear model only.
Coherent demodulation 2026-10-14
Coherent demodulation recovers a message by multiplying the received signal by a reference carrier wave of the same frequency and known relative wave phase, then passing the result through a low-pass filter. For the ideal AM model and reference ,A unity-gain ideal low-pass filter passing and but rejecting and leaves . Such a separating cutoff exists because . At , subtraction of recovers exactly for any finite , including overmodulation, provided the transmitter and channel preserve this linear waveform. This is the signed factor, not its absolute value.
A constant phase error scales the recovered message by : a radian error halves it, and a error removes it. A known error with nonzero cosine can be compensated in gain; a frequency mismatch makes the relative wave phase drift and no longer gives constant attenuation. The lecture illustrates synchronous multiplication, filtering and phase error.[ref]
Continuous-Time Modulation by Alan V. Oppenheim. Signals and Systems, Lecture 13: Continuous-Time Modulation, transparencies 13.10–13.11 on pp. 13-7–13-8 and 13.16 on p. 13-10: multiplier, low-pass separation and phase-error cosine factor
Envelope detector 2026-10-14
An envelope detector extracts the slowly varying nonnegative wave envelope of a rapid carrier wave. In a simple electrical version a diode charges a capacitor near positive carrier peaks and an attached resistor discharges it between peaks. When , ideal envelope extraction gives ; removing the constant leaves . This permits recovery without a synchronized carrier reference. Carrier injection thus trades transmitted power for simplicity.[ref]
Continuous-Time Modulation by Alan V. Oppenheim. Signals and Systems, Lecture 13: Continuous-Time Modulation, printed p. 13-2 and transparencies 13.17–13.19 on pp. 13-11–13-12: asynchronous recovery and injected carrier
A working peak detector needs margins as well as : should comfortably exceed the diode's forward-voltage scale and noise, and the time constant must suppress carrier ripple while following a falling wave envelope. The coarse scale window isA time constant that is too short leaves carrier ripple; one that is too long makes the discharging capacitor fall more slowly than the envelope. In the ideal zero-drop, continuous-tracking approximation, following a falling requires . For ,Differentiating the ratio locates its maximum at . This original slope check explains why operation near is demanding even before overmodulation: the upper bound tends to zero while the need to smooth carrier cycles persists. It is an approximate circuit criterion, not a guarantee in the presence of diode drops, loading or noise. At there is no varying message to track; at ideal envelope extraction remains algebraically possible, but the simple detector has no positive trough margin.
For , even an ideal noiseless envelope detector returns . Removing its mean or its original offset cannot restore the discarded sign. A more elaborate receiver can use the retained wave phase through coherent demodulation.
Overmodulation 2026-10-14
For this single-tone AM model, overmodulation means . The signed factor becomes negative whenever . On such intervals,The sign reversal is a radian shift of the carrier's wave phase. At each zero of , the wave envelope vanishes and that phase is undefined. The waveform itself is continuous: the formula has not clipped it or created extra spectral lines.
At , sign changes occur at message phases and within each cycle. At the trough , the desired signed factor is , whereas its nonnegative wave envelope is . Ideal envelope recovery followed by subtraction of would give there, rather than the desired message voltage . This is loss of polarity in the detector, not loss of the message from the full modulated signal. Actual transmitter clipping is a separate signal distortion that can generate additional spectral components.
Amplitude modulation sidebands 2026-10-14
Apply the product-to-sum formula to the voltage model:The carrier wave component has peak voltage amplitude ; each AM sideband has peak voltage amplitude . These are temporal frequency spectrum components, unlike the spatial sidebands used in pattern stability. The separation makes the three positive angular frequencies distinct, and keeps the lower one positive. The span between sidebands is , or in hertz when ; this is the single-tone span, not a universal signal bandwidth for arbitrary messages.
A one-sided cosine-amplitude display assigns to the carrier line. A two-sided complex-exponential expansion instead assigns at each of , and at each of the four sideband locations. The signal is identical; confusing the conventions creates a factor-of-two error. An ideal infinite-duration sinusoid gives a spectral line. A finite recording and finite analyser resolution broaden the displayed peak.
For a voltage applied across an ideal resistor of electrical resistance , a component of peak voltage has root mean square voltage and mean power by Ohm's law. ThusThe proof of additivity is to average over a long time: cross-products of distinct frequencies have zero mean. Consequently the whole signal's root mean square voltage is , not simply its maximum wave envelope divided by . The carrier-component remains unchanged as varies.
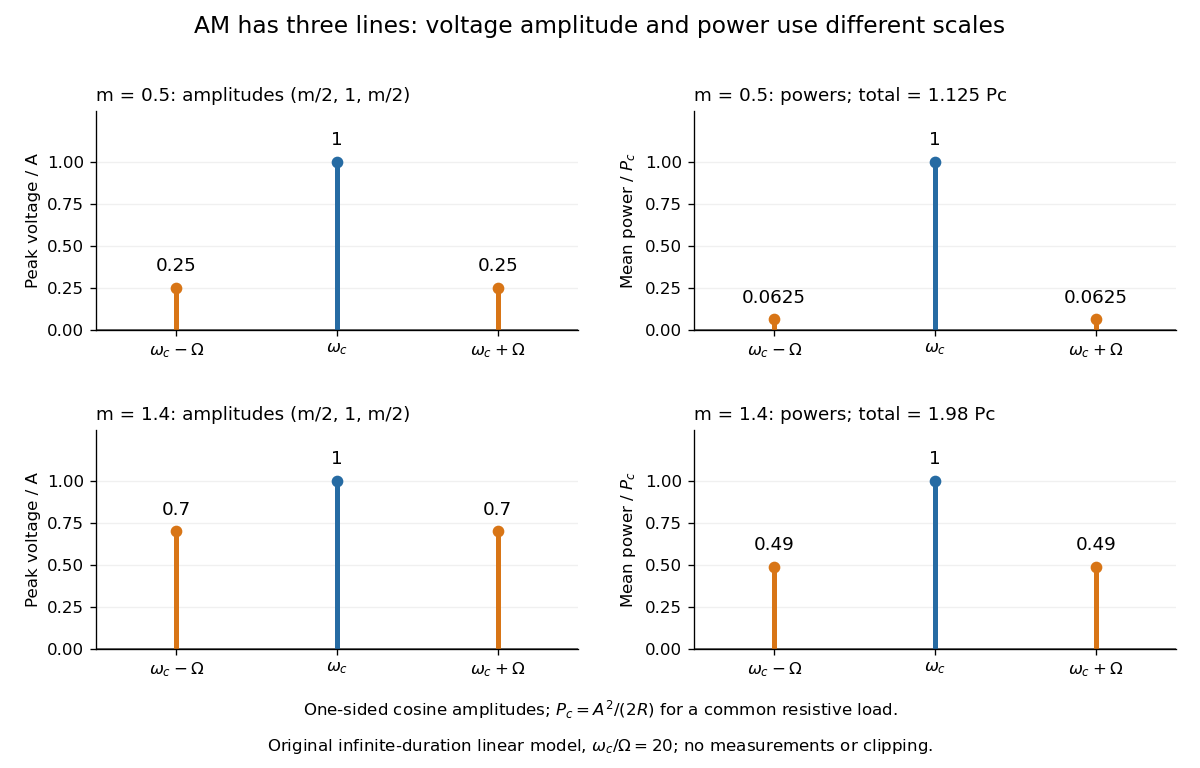

With , and , the carrier supplies and each peak sideband supplies , giving total. At each sideband is peak and supplies , giving total. Neither case changes the carrier-component power.
The fraction of mean power in the message-bearing sidebands is . It is at and at . Conventional AM spends the remaining power on a carrier that enables an inexpensive envelope detector. Increasing beyond increases this fraction in the linear model but breaks ordinary envelope recovery. Removing the carrier gives suppressed-carrier amplitude modulation and changes the receiver requirement.
AM modulation index Created 2026-10-14 Updated 2026-10-18
In the single-sinusoid AM voltage model, is the peak fractional excursion of the signed multiplying factor from its mean value . At there is only the carrier wave; at its multiplying factor ranges from to ; at it just touches zero. For , the wave envelope extrema areThe last equality follows by adding and subtracting the first two. An oscilloscope estimate uses local carrier peaks near the message extrema and needs enough carrier cycles to approximate those bounds. Consistent local peak-to-peak amplitude readings give the same ratio because their common factor of two cancels. Mixing a peak reading with a peak-to-peak reading does not.
For and , the wave envelope ranges from to , giving . These are model values. At , the signed factor has minimum , but the nonnegative wave envelope reaches zero at its sign changes; the extrema formula would misleadingly report . It cannot measure the true depth of overmodulation from the folded envelope alone.
Equality test 2026-10-14
A terminating check returning whether two values match under a specified relation. Mathematical equality is one such relation; a chosen equivalence relation can instead express matching keys. Linear search only needs this check, whereas binary search also uses relative order. The cost of an equality test depends on the representation and implementation of its operands.
Matrix-chain multiplication Created 2026-10-14 Updated 2026-10-20
Given a fixed sequence of compatible matrices , choose a binary parenthesization of that minimizes the number of scalar multiplications in ordinary matrix multiplication. The order of the matrices is fixed: parenthesization changes the grouping, not the operand order. Associativity preserves the product while intermediate matrix dimensions change the cost. The possible binary groupings are counted by the Catalan number for .
Spectroscopy Created 2026-10-14 Updated 2026-11-05
Spectroscopy investigates how a system emits, absorbs or scatters signals as a function of frequency, wavelength or energy. A spectrum can identify transition energies, response strengths and line shapes. In atomic spectroscopy, a photon connects two energy levels through ; in inelastic scattering, both energy and momentum transfers can matter.
A simple optical experiment passes source light through a sample, disperses the transmitted light and compares it with a reference. An absorption line identifies reduced transmission over a spectral interval, but its depth also depends on the sample amount and instrumental response. Wavelength calibration and energy resolution distinguish an intrinsic feature from a shifted or broadened recording. The inference therefore uses a response model as well as a list of line positions.
Metrology Created 2026-10-14 Updated 2026-10-18
Metrology asks what a measurement means and how closely it can be reproduced. An instrument reading becomes useful when it is related to a reference through measurement calibration, with a stated measurement uncertainty. Measuring a changing object against a changing ruler makes the problem especially clear: an observed difference contains the responses of both.
Photographer Created 2026-10-14 Updated 2026-10-18
There are unlisted articles, also show them or only show them.