Michael D. Fayer is a physical chemist studying molecular dynamics with ultrafast optical methods. His Stanford-hosted curriculum vitae explicitly gives this name; the D. is retained without further expansion. His research description connects two-dimensional infrared spectroscopy with molecular interactions in liquids, confined water and other structured materials.[ref]
Michael D. Fayer profile and curriculum vitae at Stanford. CV, heading and Principal Research Interests; profile, Bio
With Kyungwon Kwak, Sungnam Park and Ilya J. Finkelstein, Michael D. Fayer coauthored the 2007 center-line method for extracting dynamical information from two-dimensional infrared spectroscopy. This is a shared paper contribution, not evidence for separate individual experimental roles.[ref]
The scientific question can be illustrated by an original frequency-fluctuation model. Let be the deviation of a molecular vibrational frequency from its mean, and suppose its vibrational frequency-frequency correlation function isThe normalized memory is . With stipulated , it falls to about 0.368 after 3 ps and 0.0498 after 9 ps. An ordinary mean frequency would not reveal that memory time. These are model calculations, not measurements of confined water.
In the vibrational photon echo approach, controlled optical pulse delays connect an initial frequency label with a later response. The 2D IR center-line slope helps summarize changing spectral geometry. Interpreting that observable as molecular memory requires the response assumptions and axis convention; a slope fitted to arbitrary data is not automatically .
That distinction connects apparatus with theory. Pulse timing, the infrared spectroscopy response and a model of environmental fluctuations all enter the inverse problem. Measurements can constrain how a molecular environment changes while leaving multiple microscopic explanations possible. Michael D. Fayer's Stanford research description explicitly places theoretical analysis alongside the experiments.[ref]
Michael D. Fayer profile and curriculum vitae at Stanford. profile, Bio; CV, Principal Research Interests
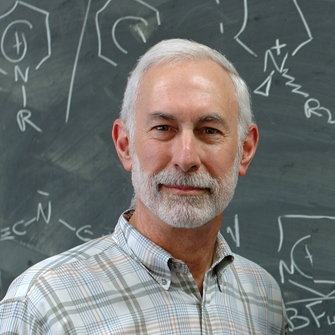
Ilya J. Finkelstein is a researcher in molecular biophysics whose work includes ultrafast molecular measurements and methods for investigating protein–DNA interactions. His own curriculum vitae identifies him by this full byline, records his Stanford chemistry doctorate and describes later single-molecule and parallel biophysical measurements. The initial J. is not expanded here.[ref]
Ilya J. Finkelstein curriculum vitae and research profile. CV, heading, Education and Five Significant Publications
Ilya J. Finkelstein coauthored the 2007 2D IR center-line slope paper with Kyungwon Kwak, Sungnam Park and Michael D. Fayer.[ref]
Frequency-frequency correlation functions and apodization in two-dimensional infrared vibrational echo spectroscopy: A new approach by Kyungwon Kwak and others. author byline
The paper addresses a practical inverse problem: extracting molecular frequency-memory information from measured spectra, rather than identifying that information with any convenient peak width.His later research profile describes methods that resolve interactions involving individual molecules and many distinct molecular substrates.[ref]
Ilya J. Finkelstein curriculum vitae and research profile. CV, Five Significant Publications; laboratory Members, Ilya Finkelstein research description
An original counting model explains one benefit of resolving separate events. If independent, equally observable sites each bind a probe with probability , the bound count hasConsequently has standard deviation . At stipulated and , that scatter is 0.05. A single observed fraction 0.55 is therefore not by itself evidence for a different binding mechanism.The assumptions are substantive. Sites may interact, molecules may be missed, and a bright object may contain more than one labeled molecule. Background subtraction, detection efficiency and an appropriate measurement model determine whether image counts represent binding events. Averaging more frames does not remove a persistent detection bias.
The common methodological theme is quantitative access to otherwise hidden dynamics: controlled spectroscopy supplies frequency correlations, while molecule-resolved assays can separate populations hidden by an ensemble mean. Neither method replaces controls or a model linking the signal to the molecular quantity of interest.

Ilya J. Finkelstein, photograph linked from his named laboratory curriculum vitae
. Sungnam Park is a chemist whose research includes time-resolved spectroscopy and the molecular dynamics of complex systems. His laboratory profile identifies him at Korea University and records earlier postdoctoral work with Michael D. Fayer. These primary records connect the named researcher with the ultrafast-spectroscopy collaboration, rather than relying on a surname match.[ref]
Sungnam Park laboratory profile at Korea University. Professor page, identity, Career Summary and Research Areas
With Kyungwon Kwak, Ilya J. Finkelstein and Michael D. Fayer, Sungnam Park coauthored the 2007 method relating a waiting-time-dependent 2D IR center-line slope to molecular frequency correlations under its response approximations.[ref] The byline establishes coauthorship without assigning an individual apparatus or theory role.
An original continuous-time Markov chain illustrates why frequency memory is useful. Let a vibrational probe switch between frequencies and , with the same transition rate in both directions. At equilibrium the two states have equal probability, so the mean frequency is regardless of .
Write the frequency deviation as , where . Over a short interval , a flip of probability reverses its sign. The sign memory therefore obeys , , givingThe vibrational frequency-frequency correlation function distinguishes two systems with the same stationary mean and frequency distribution: gives memory time 1 ps, whereas gives 10 ps. These are ideal model rates, not measurements of a particular solvent.
This loss of molecular frequency memory is an example of spectral diffusion. Experimentally, changing controlled pulse delays tests the temporal relation, while response theory connects the infrared spectroscopy signal to the molecular model. A faster decay need not uniquely identify a microscopic transition mechanism; alternative models and instrumental contributions must be assessed.

Sungnam Park, portrait linked from his named laboratory Professor page
. Kyungwon Kwak is a chemist working on ultrafast time-resolved spectroscopy of molecular systems. The Institute for Basic Science directory identifies his Korea University chemistry affiliation, Stanford doctorate and research in molecular dynamics. The primary 2007 paper gives the same full byline.[ref]
Kyungwon Kwak profile at the Institute for Basic Science. People search, Kwak, Kyungwon, Information and Research interests
Kyungwon Kwak, Sungnam Park, Ilya J. Finkelstein and Michael D. Fayer coauthored the 2D IR center-line slope method. Their paper defines its slope convention through maxima of frequency-axis slices; that convention matters when converting a plotted geometric slope into a dynamical observable.[ref]
An original bivariate normal distribution gives a transparent geometric example. Let be a centered, scaled horizontal frequency and a centered, scaled vertical frequency. For , take a positive model bandAt each fixed , maximize over . Differentiating the exponent gives . If , the line of maxima has geometric slope , while its inverse is . If , the maxima lie on the vertical line : the geometric slope is unbounded, while the inverse tends to zero. Exchanging axes changes which quantity is called the slope.
This model explains an axis convention; it is not a derivation of the full nonlinear optical response. A measured spectrum can contain homogeneous broadening, overlapping bands, finite-pulse effects and noise. Its fitted line need not be the correlation coefficient of a Gaussian probability distribution. The vibrational frequency-frequency correlation function requires the spectroscopic model that connects molecular fluctuations with the measured band.
The contribution also addresses interferogram apodization: multiplying time-domain data by a window function before the Fourier transform. The paper's stated symmetry and axis restrictions are essential, rather than a guarantee that arbitrary filtering preserves molecular information.[ref]
Frequency-frequency correlation functions and apodization in two-dimensional infrared vibrational echo spectroscopy: A new approach by Kyungwon Kwak and others. Abstract and Introduction, symmetric apodization along the selected axis
Useful processing must retain the observable being interpreted, not merely make the image look smoother.
Kyungwon Kwak, portrait explicitly named on the Institute for Basic Science center's Steering Committee page
. Matthias Otto is an analytical chemistry researcher identified in the full title-page byline of the 2004 IUPAC report on multispecies calibration, alongside Klaus Danzer and Lloyd A. Currie. That primary page gives his affiliation as the analytical chemistry department at TU Bergakademie Freiberg. The university's own directory independently lists Matthias Otto among the institute's former staff.[ref]
Guidelines for calibration in analytical chemistry. Part 2: Multicomponent calibration by Klaus Danzer and others. printed p. 1215, full byline and affiliation 2
[ref]Matthias Otto in the TU Bergakademie Freiberg analytical chemistry directory. Former employees, Prof Dr Matthias Otto
The report concerns multivariate calibration: relating several chemical species and their quantities to several measured signals, with uncertainty and model validation treated explicitly. Its sections distinguish classical multivariate calibration, inverse calibration and error diagnosis. This is a coauthored methodological contribution; the byline alone does not assign separate individual roles.[ref]
Guidelines for calibration in analytical chemistry. Part 2: Multicomponent calibration by Klaus Danzer and others. printed p. 1216, Abstract and Contents; §§2–5
An original two-species model illustrates the scientific problem. Let concentration values and two instrument signals be expressed in chosen calibrated units, withThe signals imply and . If the second channel were instead exactly twice the first, giving response matrix , readings would determine only . Merely recording two channels would not make the two species separately identifiable.
This distinction is why calibration mixtures must supply independent information about the species responses and why successful interpolation does not replace validation. Near-dependent response columns can also amplify measurement noise even when a formal inverse exists. Singular value decomposition and the actual calibration design help diagnose such limitations; a regression coefficient is not automatically an independently established chemical effect.
A measurement program can vary mixture composition, collect the same channels under controlled conditions, and test predictions on mixtures not used to fit the response. The example is an ideal calculation, not experimental data from the report. It explains why chemometrics combines chemical knowledge, experimental design and statistical assessment rather than treating a fitted number as a complete analytical result.
Richard A. Mathies is a chemist whose research develops laser-based measurements of molecular reaction dynamics. His Berkeley profile describes work using Raman spectroscopy and femtosecond stimulated Raman spectroscopy to connect changing vibrational spectra with changing molecular structure.[ref]
With David W. McCamant and Philipp Kukura, Richard A. Mathies coauthored the2003 broadband stimulated-Raman method. Its instrumentation combines a spectrally narrow Raman pump with a short broadband probe, so spectral selectivity and rapid probing are assigned different roles in the experiment.[ref]
An original gain example explains what the detector comparison measures. At one probe wavelength, a properly corrected pump-on signal103 and pump-off signal100 give a ratio1.03, or a3% increase. If both readings also contain an unremoved detector offset20, the raw ratio123/120 is only1.025. Background subtraction and normalization belong in the measurement model; a small spectral feature cannot be interpreted independently of them. The primary method uses dark-corrected, reference-normalized gain measurements.[ref]
The scientific contribution is both instrumental and interpretive: obtaining rapid vibrational information requires controlled pulses, detection and a model connecting the optical response to the reacting molecules.

Richard A. Mathies, portrait identified by his Berkeley profile
. Philipp Kukura is a chemist developing optical methods for molecular measurements. Oxford's departmental biography records his doctoral work with Richard A. Mathies at Berkeley, while its research description identifies mass photometry and light-scattering-based measurements of individual biomolecules in solution.[ref]
With David W. McCamant and Richard A. Mathies, Philipp Kukura coauthored the broadband femtosecond stimulated Raman spectroscopy method. A narrowband Raman pump and broadband short probe serve complementary spectral and temporal roles in that apparatus.[ref]
A useful motivation for single-particle mass photometry is that a mean can conceal a mixture. For an original illustration, a uniform population of100-kDa objects and a population containing two-thirds120-kDa and one-third60-kDa objects both have mean mass100kDa. Their mass distributions differ. Measurements resolving individual events can test that difference if their resolution, response calibration and selection effects are adequate.
The example is a counting argument, not a reported experiment or an assumption that every event is detected equally. Optical signal must be related to the desired molecular quantity through a validated measurement model. The connection between instrument development and molecular investigation runs through that relation, rather than through signal brightness alone.

Philipp Kukura, portrait identified by his Oxford departmental profile
. David W. McCamant is a physical chemist studying light–matter interactions and fast molecular processes. His Rochester research-group biography describes his Berkeley doctoral work with Richard A. Mathies on femtosecond stimulated Raman spectroscopy. The2003 method paper independently verifies his full byline as David W. McCamant.[ref]
David W. McCamant research-group biography at the University of Rochester. Principal-investigator biography.
[ref]The coauthored apparatus uses a filtered pump near793nm, a continuum probe and spectrally resolved probe/reference detection to measure vibrational gain.[ref]
Femtosecond Broadband Stimulated Raman: A New Approach for High-Performance Vibrational Spectroscopy by David W. McCamant and others. Materials and Methods, Instrumentation and Fig.2.
This makes a molecular vibration accessible through the difference between optical frequencies.For an original conversion example, a793-nm pump and an850-nm Stokes probe correspond to Raman shiftThe factor converts reciprocal nanometres to reciprocal centimetres. Subtracting wavelengths directly would not give the vibrational wavenumber. The850-nm value is stipulated for this example, not attributed as a measured band in the paper.
The method connects pulse design, spectral resolution and quantitative signal processing with questions about molecular dynamics. A rapidly changing signal still needs a molecular assignment and appropriate instrumental controls before it establishes a particular reaction pathway.

David W. McCamant, portrait identified by his Rochester research-group page
. Robin M. Hochstrasser was a physical chemist working on molecular spectroscopy and dynamics. A primary Optica conference record explicitly gives this full-name spelling in the same coupled-vibrator and infrared-echo collaboration whose papers also use the byline R. M. Hochstrasser.[ref]
With M. C. Asplund and Martin T. Zanni, Robin M. Hochstrasser coauthored the2000 phase-controlled peptide experiment in two-dimensional infrared spectroscopy. It used heterodyne detection to recover phase and amplitude of vibrational photon echoes, rather than measuring only an unsigned signal intensity.[ref]
An original field-addition example explains why phase matters. Two contributions of amplitude1 add to total amplitude2 and intensity4 when in phase; opposite-sign contributions cancel to0. Knowing each separate intensity was1 would not determine the combined result. With a known reference field and weak signal field ,For a sufficiently strong reference, the cross term makes the weak field measurable with sensitivity to its relative phase. Changing reference phase samples different field components.
The spectroscopy's scientific power comes from using those controlled relations to constrain molecular interactions. A measured 2D IR cross peak still requires a response model before it establishes a particular coupling or structural assignment. Coherent detection adds information; it does not remove the need for physical interpretation.
Martin T. Zanni is a chemist developing multidimensional spectroscopy and its applications to molecular structure and dynamics. The University of Wisconsin name/contact on his author-hosted CV agrees with the primary2011 prize-organizer profile, and a primary Optica collaboration record explicitly expands his earlier M. T. byline.[ref]
Martin T. Zanni at the 2011 Sackler Prize in Chemistry. Named profile and linked author CV.
[ref]With M. C. Asplund and Robin M. Hochstrasser, Martin T. Zanni coauthored the phase-controlled peptide two-dimensional infrared spectroscopy experiment. His later first-person lecture account describes developing mid-infrared spectral pulse shaping to generate the required pulse trains under computer control.[ref]
Two-dimensional infrared spectroscopy of peptides by phase-controlled femtosecond vibrational photon echoes by M. C. Asplund and others. Author byline.
[ref]An original acquisition-count example illustrates why control technology matters. Stipulate one acquisition for each pair in a two-delay grid. A grid requires4096 acquisitions; a grid requires65536, sixteen times as many. Averaging, drift and repeat measurements add further demands. Automated timing can make a scientifically useful multidimensional measurement practical, while pulse characterization and controls determine whether the generated sequence matches the intended one.
The calculation is a sampling-design illustration, not an acquisition specification attributed to a particular apparatus. The broader contribution connects instrument control with access to structural and dynamical information that a single-frequency trace can conceal.

M. C. Asplund is a coauthor of the primary phase-controlled peptide experiment in two-dimensional infrared spectroscopy. The published paper identifies a University of Pennsylvania chemistry affiliation and retains the exact byline M. C. Asplund, alongside M. T. Zanni and R. M. Hochstrasser.[ref]
The joint experiment measured phase and amplitude of vibrational photon echoes and resolved features interpreted as coupling between amide-I modes. It connected controlled pulse delays with information about molecular interactions.[ref]
Two-dimensional infrared spectroscopy of peptides by phase-controlled femtosecond vibrational photon echoes by M. C. Asplund and others. Abstract, coupled modes and phase-sensitive measurement.
An original response-matrix example clarifies the extra question asked by a multidimensional experiment. Consider two stipulated mapsTheir diagonal values agree, while their off-diagonal responses differ. Looking only at the two diagonal amplitudes would miss that difference. These are illustrative spectral-response entries, not quantum density matrices or reported experimental data.
A 2D IR cross peak can supply a constraint on relationships between vibrations, but its cause must be assessed using the signal phase, timing and physical model. M. C. Asplund's verified contribution is coauthorship of that experimental method; the paper does not by itself assign every individual apparatus or analysis task to one coauthor.
David Brynn Hibbert, also known as Brynn Hibbert, is an analytical chemistry researcher whose work combines chemometrics, electrochemical measurements and metrological traceability. His university profile records his tenure in the UNSW analytical-chemistry chair from1987 to2013 and his editorship of the IUPAC terminology compendium known as the Orange Book. The Royal Society of New South Wales explicitly verifies his full name.[ref]
David Brynn Hibbert profile at UNSW. Institutional research summary; linked Presidents’ Profiles, printed p.93, DAVID BRYNN HIBBERT.
With Paul De Bièvre, René Dybkær and Aleš Fajgelj, David Brynn Hibbert coauthored the IUPAC report on the concepts and implementation of metrological traceability in chemical measurement. Its goal was a consistent account of how a result is related to a reference, including the concepts needed to communicate that relationship.[ref]
An original illustration explains the value of a measurement model in chemometrics. Suppose two ideal sensors give and , where is the target concentration and an interfering response. Their mean recovers , while their difference diagnoses . If both instead respond as , averaging cannot remove the interference. The chemical response model determines what additional measurements identify; having more numbers alone does not guarantee more independent information.

David Brynn Hibbert, portrait identified by his UNSW profile
. René Dybkær worked on measurement concepts and terminology in laboratory medicine. The IUPAC traceability report identifies him with the Department of Standardization in Laboratory Medicine at Frederiksberg Hospital, Denmark, and names him as a coauthor with Paul De Bièvre, Aleš Fajgelj and David Brynn Hibbert.[ref]
Metrological traceability of measurement results in chemistry: Concepts and implementation by Paul De Bièvre and others. Publisher byline, affiliation2 and Abstract.
The report develops a shared account of metrological traceability for chemical measurement. Such terminology matters because a result must identify the measurand and reference relationship before numerical comparisons become meaningful. A chemical name, number and unit together specify more than an instrument indication alone.
For an original conversion example, a stipulated compound with molar mass at has mass concentration . The numbers2 and200 describe equivalent content under that specification, rather than disagreement between laboratories. Conversely, equal numbers attached to different quantity definitions need not be equivalent. Uncertainty in the inputs also belongs in the conversion's measurement uncertainty.
René Dybkær's coauthored standards work addresses this need to make the meaning of a measurement communicable. The example is an original illustration of the problem, not data attributed to his experiments or a statement of a clinical decision threshold.
Paul De Bièvre was a researcher in isotope ratio measurements, reference materials and chemical metrology. His IUPAC Council biography records leadership in isotope mass spectrometry and isotope reference materials at the European Commission's nuclear-measurement laboratory, later the Institute for Reference Materials and Measurements.[ref]
Paul De Bièvre nomination biography for the 43rd IUPAC Council. Professional Experience, group leadership and laboratory responsibilities.
With René Dybkær, Aleš Fajgelj and David Brynn Hibbert, Paul De Bièvre prepared the2011 IUPAC report on metrological traceability of chemical measurement results. The report's stated aim is a consistent view of traceability's creation, meaning and role in chemical measurement.[ref]
An original isotope-counting example shows why a ratio must be specified. If a hypothetical two-isotope material contains80 units of isotope A and20 of isotope B, its ratio A/B is4, while the fraction A/(A+B) is0.8. Multiplying a sample's total amount by ten changes neither value. An instrument response ratio still requires a measurement model relating its signals to those isotope amounts; unequal response to the two isotopes can alter the observed ratio.
This connects isotope measurements with reference material characterization and measurement calibration. A precise signal ratio is useful only when its relation to the specified measurand and reference is established, with appropriate measurement uncertainty. Paul De Bièvre's documented work joined those experimental and conceptual aspects.
Paul Brereton is a researcher in food safety, quality and authenticity. Queen's University Belfast identifies his interdisciplinary research on risks to the food system and his coordination of the TRACE and FOODINTEGRITY projects. The corresponding Fera project biography corroborates those scientific activities.[ref]
Paul Brereton profile at Queen’s University Belfast. Research Interests and linked Fera project biography.
Paul Brereton coauthored the collaborative trial in which multiple samplers collected wheat and green coffee from bulk lots. The design assessed variation arising in analytical sampling, rather than restricting replication to repeated laboratory readings.[ref]
Collaborative trials of the sampling of two foodstuffs, wheat and green coffee by Michael Thompson and others. Byline and Abstract, multiple-sampler trial.
An original food-authenticity illustration distinguishes checking a product's composition from checking a label's claim. A mixture containing90 units of ingredient A and10 of B still totals100 units. A method measuring only total material would not reveal the substitution; a selective measurement for B or a validated compositional pattern could. Which observation answers the authenticity question depends on a defined measurand, representative analytical sampling and suitable comparison materials.
This is the scientific connection between laboratory method development and food-system investigation: an analytically accurate result must measure a property relevant to the claim being tested. A method's detection capability for one known substitution does not establish universal detection of every possible substitution.

Sharron Anderson is an author of research on analytical sampling and laboratory measurement of food. The primary byline of the2002 collaborative sampling study identifies her with Michael Thompson, Paul Willetts, Paul Brereton and Roger Wood.[ref]
The team had multiple samplers collect portions of wheat and green coffee from bulk material. Its findings separated variation under different collection conditions, showing that the variability observed for one food could not simply be assumed for the other.[ref]
Collaborative trials of the sampling of two foodstuffs, wheat and green coffee by Michael Thompson and others. Abstract, sampling reproducibility and repeatability findings.
An original example illustrates the experimental logic. Repeated readings of one extract might give10.0,10.1 and9.9 concentration units, while a second independently collected portion gives14.0,14.1 and13.9. Each extract is measured consistently, but the collection-to-collection difference is much larger. A study replicating only instrument readings would miss that component of measurement uncertainty.
Sharron Anderson's documented coauthorship concerns this joint experimental investigation. The scientific lesson is to replicate the stage whose variation is at issue: additional measurements of the same material cannot substitute for independent collections when assessing analytical sampling uncertainty.
Roger Wood is an analytical chemistry researcher whose work concerns the reliability and comparability of laboratory results. The 1999 recovery-information report identifies him with the MAFF Food Science Laboratory in Norwich and lists him among its five authors.[ref]
Harmonised guidelines for the use of recovery information in analytical measurement by Michael Thompson and others. Eurachem-hosted text, title page and affiliation 4.
The report addresses a practical difficulty: two laboratories can obtain different answers from the same material if one applies a recovery correction and the other reports the recovered amount. It develops a framework for estimating, applying and reporting recovery information rather than treating a percentage as a context-free property of a method.[ref]
Harmonised guidelines for the use of recovery information in analytical measurement by Michael Thompson and others. Introduction and Recommendations.
Roger Wood also supported the launch of the RSC Analytical Methods Committee's Technical Brief series while chairing that committee. The RSC's own account credits Michael Thompson as the instigator and Roger Wood as a strong supporter; the first brief appeared in 2000.[ref]
The RSC Analytical Methods Committee Reaches a Milestone in Technical Brief Publication. Technical Briefs section.
An original numerical illustration shows why laboratory agreement needs interpretation. If one laboratory recovers from material containing and reports 8, while another applies an appropriate recovery estimate 0.8 and reports 10, their discrepancy can arise from reporting conventions without a difference in recovered amount. Conversely, laboratories sharing an unsuitable correction can agree and remain biased. Interlaboratory comparison and clear reporting answer complementary questions about a measurement system.
Paul Willetts is an analytical chemistry researcher associated with studies of laboratory performance and analytical sampling. The recovery-information report lists him at the MAFF Food Science Laboratory in Norwich, establishing the identity independently of unrelated authors with the same name.[ref]
Harmonised guidelines for the use of recovery information in analytical measurement by Michael Thompson and others. Eurachem-hosted text, title page and affiliation 4.
With Michael Thompson, Sharron Anderson, Paul Brereton and Roger Wood, Paul Willetts studied collaborative sampling of wheat and green coffee from bulk lots. Multiple samplers allowed the study to distinguish variation under different sampling conditions. Between-sampler variation contributed significantly for two wheat analytes; the coffee results showed significant sampling-repeatability variation without a detected significant sampling-reproducibility contribution.[ref]
Collaborative trials of the sampling of two foodstuffs, wheat and green coffee by Michael Thompson and others. Abstract, sampling design and contrasting results.
The measurement begins before material reaches the instrument. For an original illustration, two perfectly repeatable preparations might contain and because the collected portions differ. Repeating each instrument reading a hundred times would not make those portions identical. Measurement repeatability within a portion and measurement reproducibility across the relevant procedures therefore cannot be inferred from the same replication design.
Paul Willetts also coauthored the recovery-information guidance. Together these contributions emphasize that sample matrix, material selection, preparation loss and stated measurement uncertainty belong in the interpretation of an analytical result. They cannot all be assessed by repeatedly reading a single prepared solution.
Aleš Fajgelj is an analytical chemistry researcher whose work includes metrological traceability, recovery information and laboratory quality assurance. The 2011 IUPAC traceability report identifies his affiliation with the International Atomic Energy Agency's Department of Nuclear Sciences and Applications.[ref]
Metrological traceability of measurement results in chemistry: Concepts and implementation by Paul De Bièvre and others. Publisher byline and affiliation 3.
With Paul De Bièvre, René Dybkær and D. Brynn Hibbert, Aleš Fajgelj prepared recommendations intended to give chemical measurement a consistent account of the creation, meaning and role of metrological traceability. He also coauthored the 1999 recovery-information report, connecting the interpretation of laboratory results with the handling of losses during preparation.[ref]
Metrological traceability of measurement results in chemistry: Concepts and implementation by Paul De Bièvre and others. Abstract.
[ref]An original example illustrates the distinction between documenting a reference and validating a process. Suppose a standard solution's assigned concentration is connected to a specified reference through documented measurements. If an unknown loses 20% of its analyte during preparation while the standards do not, that documented standard alone does not justify treating the unknown's preparation loss as zero. The measurement model must represent the relevant stages and their measurement uncertainty.
Likewise, agreement in an interlaboratory comparison supplies evidence about the compared results, but does not by itself write the missing chain of reference relationships. The value of Aleš Fajgelj's standards work lies in making those distinctions explicit enough for laboratories to communicate what a result means.
Steven L. R. Ellison is the name printed for an analytical chemistry coauthor of the recovery-information report, with an affiliation at the Laboratory of the Government Chemist in Teddington. Eurachem's later organizer biography identifies the same report among the works of Stephen L. R. Ellison, an LGC Fellow specializing in analytical statistics and measurement uncertainty.[ref]
Harmonised guidelines for the use of recovery information in analytical measurement by Michael Thompson and others. Eurachem-hosted title page, printed Steven L R Ellison and affiliation 2.
[ref]Stephen L. R. Ellison biography in the 2017 Eurachem workshop abstracts. Printed p.94, named biography and explicit report-coauthorship link.
The Eurachem biography also identifies him as a principal author of Quantifying Uncertainty in Analytical Measurement and a coauthor of method-validation and laboratory-proficiency-testing guidance. This work develops the statistical interpretation needed to compare analytical results under stated conditions.[ref]
Stephen L. R. Ellison biography in the 2017 Eurachem workshop abstracts. Printed p.94, scientific contributions.
For an original illustration, two independent uncertainty contributions of and combine to in quadrature. If their correlation coefficient is 0.5 and both enter the model with positive sensitivity, the combined standard uncertainty is insteadThe model determines which inputs contribute and whether covariance matters. Listing more decimal places does not resolve an omitted source of uncertainty. This calculation illustrates the subject of the guidance; it is not experimental data attributed to Ellison.
Klaus Danzer is an analytical chemistry researcher who prepared the 1998 IUPAC recommendations on single-component measurement calibration with Lloyd A. Currie. The paper identifies an affiliation at Friedrich Schiller University of Jena, and the NIST publication record gives both authors' full names. The recommendations organize how measured signal is related to the amount or concentration of an analyte under specified conditions.[ref]
Guidelines for calibration in analytical chemistry. Part I. Fundamentals and single component calibration by Klaus Danzer and Lloyd A. Currie. prepared-for-publication byline and Abstract; NIST author record
An analytical calibration function separates the response model from its use to infer an unknown. For an original linear example, let concentration be measured in and signal in arbitrary instrument units. Suppose known standards at give , exactly satisfyingAn unknown giving has inferred concentration . Ignoring the intercept instead gives , an error of about thirteen percent. A nonzero blank response is not automatically analyte in the unknown.
The same example shows why a calibration curve is more than a unit conversion. A small perturbation of the inverse relation givesReadout variation, uncertainty in the intercept and uncertainty in the slope affect the inferred concentration in different ways. Their covariances can matter when the coefficients are fitted together. These are independently derived sensitivities for the stipulated model, rather than experimental values attributed to Danzer's paper.
A practical calibration measures standards and unknowns with compatible preparation, sample matrix and instrument settings. Repeated standards can reveal measurement noise and time-dependent response; a model established up to does not by itself validate its extension to . The recommendation's explicit dependence on specified conditions makes those experimental choices part of the meaning of calibration, not incidental details.[ref]
Guidelines for calibration in analytical chemistry. Part I. Fundamentals and single component calibration by Klaus Danzer and Lloyd A. Currie. Abstract, signal-versus-amount/concentration relation under given conditions
Danzer also coauthored the 2002 distinction between extraction recovery and apparent recovery. That distinction prevents agreement after calibration from being mistaken for proof that no analyte was lost in sample preparation.[ref]
Use of the term "recovery" and "apparent recovery" in analytical procedures by D. T. Burns and others. printed p. 2201, full byline; Abstract
Michael Thompson is an analytical chemistry researcher named at Birkbeck College in the 1999 international guidelines on using recovery information in analytical measurement. The paper addresses how losses during sample preparation affect reported results, their comparability and their measurement uncertainty. Its authorship and affiliation identify this contribution without conflating other scientists of the same name.[ref]
Harmonised guidelines for the use of recovery information in analytical measurement by Michael Thompson and others. full byline and affiliation; Introduction
A central distinction is between correcting an estimated loss and treating the correction as perfectly known. In a specified recovery correction model,where is the uncorrected result and the estimated fractional recovery. The guide treats the determination's uncertainty and the recovery estimate's uncertainty separately. For independent inputs, first-order propagation givesThis states an uncertainty calculation, not a rule that every analytical measurand must be defined identically.[ref]
Harmonised guidelines for the use of recovery information in analytical measurement by Michael Thompson and others. §6, Uncertainty in Reporting Recovery; Appendix, Recovery and Uncertainty
For an original example, stipulate with standard uncertainty and with . The corrected result is andTreating recovery as exact would give only . The added uncertainty describes limited knowledge of the correction; omitting it does not make the physical measurement more reliable. Correlated estimates require the appropriate covariance term instead of this independent-input formula.
The experiment used to estimate recovery also matters. An added, readily dissolved analyte may not behave like native analyte strongly bound within the sample matrix. The guidelines discuss this limitation of surrogate recovery studies and the need to consider matrix variation.[ref]
Harmonised guidelines for the use of recovery information in analytical measurement by Michael Thompson and others. §§3.2–3.3, native/surrogate behavior and matrix mismatch; §5.1, representative recovery studies
A useful validation therefore specifies what material was added, when it was added, which matrices were represented and whether the procedure had time to equilibrate.Thompson and his collaborators' reporting recommendations call for identifying whether results are recovery corrected and how the correction was obtained. This makes two laboratories' numbers interpretable: a corrected estimate of total analyte and a reproducible result defined by a particular extraction procedure can otherwise look like measurements of the same quantity when they are not.[ref]
Harmonised guidelines for the use of recovery information in analytical measurement by Michael Thompson and others. Recommendations, reporting correction status, magnitude and derivation
- Collaborative trials of the sampling of two foodstuffs, wheat and green coffee by Michael Thompson and others
- Harmonised guidelines for the use of recovery information in analytical measurement by Michael Thompson and others
- The International Harmonized Protocol for the proficiency testing of analytical chemistry laboratories by Michael Thompson and others
Alan Townshend is an analytical chemistry researcher associated with the University of Hull in the full byline of the 2002 IUPAC recovery recommendations. He also coauthored the 1999 recommendations classifying amplification and related analytical reactions. These contributions distinguish physical chemical operations that can otherwise be hidden behind a single instrument response.[ref]
Use of the term "recovery" and "apparent recovery" in analytical procedures by D. T. Burns and others. printed p. 2201, full-name byline and Hull affiliation
[ref]Classification and Use of Terms for Amplification and Related Reactions by D. T. Burns and others. publisher byline, Abstract and printed p. 1332, classification scheme
The amplification report extends the earlier treatment to include reactions that do not multiply the original chemical species. In a chemical multiplication reaction, a cycle produces a multiplied number of the same species before measurement. Other chemical amplification arrangements can increase the amount available for measurement through a different sequence or accumulation process. The chemical transformation and the mathematical growth law must both be specified.[ref]
Classification and Use of Terms for Amplification and Related Reactions by D. T. Burns and others. printed p. 1332, Introduction and Direct multiplication reaction
An original idealized counting example shows the difference. Suppose a complete reaction cycle converts each available target species into three of the same species, with enough additional reagent supplied and no losses. Starting with targets, four cycles giveBy contrast, an arrangement that adds measurable product units per cycle while retaining the initial gives , hence . The two arrangements agree after one cycle but diverge thereafter. These are stipulated growth laws, not measured yields or a recipe from the paper.
Conservation of mass still applies: the additional material comes from reagents, not from creating matter. In practice, incomplete reactions, changing conditions or depletion can prevent the ideal cycle multiplier from remaining constant. An experimental comparison would therefore measure the product after different cycle counts, together with reagent blanks and known starting amounts, rather than infer a multiplication law from one enlarged signal.
Chemical amplification also differs from simply multiplying an electrical readout by a constant. Increasing the displayed signal need not improve signal-to-noise ratio if background or measurement noise is increased with it. The report's broader classification is useful precisely because similar-looking signal gains can arise from different chemical and measurement processes.
Townshend's recovery recommendations address the complementary question of material lost before the readout. Extraction recovery and apparent recovery describe different ratios, so an amplified signal or a result agreeing with a standard does not by itself demonstrate complete analyte recovery.[ref]
Use of the term "recovery" and "apparent recovery" in analytical procedures by D. T. Burns and others. Abstract, extraction/preconcentration yield versus observed/reference value
B. K. Matuszewski is an author of experimental research on quantitative high-performance liquid chromatography with tandem mass spectrometry. A2003 paper with collaborators, listing an affiliation at Merck Research Laboratories in West Point, Pennsylvania, develops ways to distinguish an analytical matrix effect from extraction recovery. The byline identifies the author with these initials.[ref]
The scientific problem is that an instrument signal can change even when the amount of analyte reaching the measurement is unchanged. Other constituents of the sample matrix can suppress or enhance the response. Conversely, analyte can be lost during sample preparation without changing the response per unit amount. A low measured signal therefore need not identify which mechanism occurred.
An original three-preparation example separates these effects under a linear-response assumption. Suppose equal nominal amounts of an analyte are introduced into: a clean solvent standard; a blank sample extract after extraction; and a sample before extraction. Match the final volumes and measurement conditions. Let the resulting background-corrected signals be , and arbitrary units, respectively. The dimensionless ratios areThe last ratio is the product of the first two. Calling the overall60percent response an extraction recovery would conflate analyte loss with ion suppression. This is an invented calculation, not a reconstruction of the paper's validation data. It assumes that the post-extraction addition represents the matrix response experienced by the extracted analyte.
Matuszewski and colleagues also compared ion-spray and heated-nebulizer interfaces while holding sample preparation and chromatographic conditions otherwise the same. For their investigated compound, a matrix effect appeared with the ion-spray interface and was absent with the heated nebulizer.[ref]
Strategies for the assessment of matrix effect in quantitative bioanalytical methods based on HPLC-MS/MS by B. K. Matuszewski and others. Abstract, final two sentences
That controlled comparison shows why selectivity in mass spectrometry must be tested for the actual method and sample matrix, rather than inferred from the detector's nominal specificity.Michael Karas is a researcher associated with the experimental development of MALDI mass spectrometry. His 1985 paper with collaborators examined how laser wavelength and sample absorption influence ion formation from organic solids. The paper lists an affiliation with the Institute of Biophysics at the University of Frankfurt.[ref]
A central experiment mixed alanine with tryptophan, which absorbs at 266 nm. At that wavelength, the mixture yielded an alanine-related ion at about one tenth of the irradiance required for spectra of alanine alone. The absorbing matrix therefore changed the conditions under which the other component could be observed, rather than merely adding its own peak to the spectrum.[ref]
An original pulse-accounting example shows why the measurement conditions matter. If a uniform pulse has irradiance for , its radiant exposure isAt the same irradiance, a one-nanosecond pulse gives . These chosen values are not the experimental thresholds. Equal irradiance does not imply equal deposited energy per area when pulse duration differs.
The original study discussed competing mechanisms for the observed wavelength and matrix effects rather than establishing one universal ionization pathway.[ref] That combination of controlled comparison and mechanistic alternatives makes the work scientifically informative beyond a single improved signal. A university newsletter with a portrait and development-era apparatus photograph provides a primary visual reference.
Sören-Oliver Deininger is an author of research on processing and interpreting mass spectrometry imaging data. His 2011 paper with collaborators on MALDI imaging normalization lists an affiliation with Bruker Daltonik in Bremen. It examines how spectrum-wide scaling can improve comparisons but also create misleading spatial patterns.[ref]
One issue is total ion current normalization, which scales a spectrum using its summed signal. A strongly localized component can change that denominator and alter the normalized appearance of other signals. The paper compares normalization choices and illustrates such effects instead of treating one scaling rule as a universal correction for all imaging datasets.[ref]
Normalization in MALDI-TOF imaging datasets of proteins: practical considerations by Sören-Oliver Deininger and others. Introduction, A pledge for normalization, and Figures1–4
An original two-spectrum example shows the mechanism. Suppose a selected signal has raw intensity 10 in both regions, while the remaining summed intensity is 90 in one region and 190 in the other. Their totals are 100 and 200. Dividing by each total gives selected-signal fractions and . The normalized signal differs twofold even though its stipulated raw intensity did not change.
These invented values do not reproduce the paper's data and do not identify molecular concentrations. They isolate the effect of changing the denominator. A normalization rule must therefore be interpreted alongside sample composition, measurement effects and the comparison it is intended to support. Deininger and colleagues' contribution makes this analytical choice part of the scientific interpretation of an image, rather than an invisible formatting step.
C. L. De Ligny is listed with H. D. Nelson as an author of 1968 measurements of hydrocarbon solubility in water. The IUPAC-NIST record for the hexane/water system names this publication as its original experimental source and records temperature-dependent measurements. It does not identify which coauthor performed each laboratory operation.[ref]
Hexane with water in the IUPAC-NIST Solubility Database. Record37_269, Original Measurements and Variables
This work is relevant to the quantitative meaning of liquid immiscibility. A bulk system can contain separate liquid regions while its aqueous phase still contains a small, measurable amount of hydrocarbon. Equilibrium composition and the total quantity recovered from an aliquot answer different questions.
For an original calculation, suppose a homogeneous solution has hydrocarbon mole fraction and total amount of substance . It contains hydrocarbon. A representative aliquot containing of the solution contains hydrocarbon while retaining the same mole fraction. These chosen values do not reconstruct the NIST table.
The database describes microsyringe sampling and gas chromatography with flame-ionization detection, connecting the small dissolved amount to a measurement procedure.[ref]
Hexane with water in the IUPAC-NIST Solubility Database. Method/Apparatus/Procedure
Sample size, composition and instrument response must be distinguished before comparing solubility measurements.H. D. Nelson is credited with C. L. De Ligny as an author of experimental hydrocarbon solubility measurements published in 1968. The NIST hexane/water record identifies their joint work as its original measurement source. The verified byline supports this contribution without supplying a fuller identity or an individual division of laboratory tasks.[ref]
Hexane with water in the IUPAC-NIST Solubility Database. Record37_269, Original Measurements
The recorded method equilibrates the liquid system, samples the aqueous solution with a microsyringe, and uses gas chromatography with flame-ionization detection. It addresses a quantitative question: how much hexane is dissolved in water, rather than simply whether two visible bulk liquid regions remain.[ref]
Hexane with water in the IUPAC-NIST Solubility Database. Method/Apparatus/Procedure
An invented instrument calibration example illustrates why a detector reading is not itself a concentration. Suppose peak area obeys , with blank area , response slope area units per , and sample area . Then . These are teaching values, not measurements or calibration constants from Nelson and De Ligny's paper. The example separates equilibration, sampling and detector response, all of which matter when interpreting a small dissolved signal.
Daryl Wilding-McBride is an author of research on computational analysis of mass spectrometry data. A 2022 paper with collaborators developed processing methods for precursor and fragment spectra acquired on a timsTOF instrument, with the aim of improving peptide feature characterization and identification.[ref]
One useful contribution concerns detector saturation. Strong isotopic peaks can cease to represent their true relative intensities. The paper uses a theoretical model of tryptic-peptide peak-height ratios and an unsaturated later isotope to infer earlier peak intensities, including the monoisotopic peak. This is model-based reconstruction, not a second direct measurement of a saturated signal.[ref]
Simplifying MS1 and MS2 spectra to achieve lower mass error, more dynamic range, and higher peptide identification confidence on the Bruker timsTOF Pro by Daryl Wilding-McBride and others. §3.3, Correcting intensity readings in saturation; Figures7–10
For an original calculation illustrating the inference, suppose a declared model predicts and an unsaturated later peak has intensity arbitrary units. The inferred earlier intensity is units. The arithmetic is straightforward; whether it is informative depends on the appropriateness of the isotope-ratio model and the reliability of the unsaturated measurement.
The paper evaluates such processing in defined proteomic mixtures. Its detector threshold and applicable isotope/mass ranges belong to that data-processing setup, rather than constituting universal limits for every mass spectrometer. The example illustrates how a software correction can recover a useful estimate while retaining dependence on its physical and statistical assumptions.[ref]
R. M. Caprioli is a publication byline used by Richard M. Caprioli, a researcher in mass spectrometry imaging. Vanderbilt University's profile supplies the fuller name, describes his molecular-imaging research and lists publications under the Caprioli RM byline.[ref]
Richard M. Caprioli biography at Vanderbilt University. Profile heading, molecular-imaging description and Representative Publications
A 1997 paper with collaborators demonstrated spatially ordered MALDI measurements of biological samples. A tissue slice or its imprint was coated with an energy-absorbing matrix; spectra were collected at defined sample coordinates. Selecting a mass-to-charge ratio then produced a spatial map of the corresponding signal. Mapping insulin in a rat-pancreas section was one demonstrated application.[ref]
Molecular imaging of biological samples: localization of peptides and proteins using MALDI-TOF MS by R. M. Caprioli and others. Abstract, matrix coating, ordered spectra and insulin localization
An original three-position example makes the added information clear. Suppose the signal for one selected ion is at three recorded positions, while another ion gives . Summing each vector gives120 and150, but discards where the signals arose. The coordinate-tagged mass spectra instead preserve their different spatial patterns. These invented intensities illustrate the data structure and do not reproduce an experimental image.
A spatially localized mass signal is not automatically a unique chemical structure or a calibrated concentration. Sample preparation and the interpretation of the selected signal remain part of the measurement. The useful step in this work is the connection between molecularly informative spectra and the original tissue coordinates. A primary university profile and portrait page documents the researcher.
G. N. Bowers Jr is an author of research on spectrophotometry and reference materials used for measurement calibration in biochemical analysis. In a 1980 study, Bowers and colleagues specified high-purity 4-Nitrophenol for standardizing measurements of alkaline phosphatase activity. Some commercial samples met their specifications; others required recrystallization or sublimation. This makes purity a practical part of the measurement, rather than an assumption about a reagent label.[ref]
High-purity 4-nitrophenol: purification, characterization, and specifications for use as a spectrophotometric reference material by G. N. Bowers Jr and others. Abstract; purification and intended use in clinical enzymology
The same study reported a molar absorption coefficient of at a wavelength of and a temperature of , for 4-Nitrophenol in sodium hydroxide. The stated solution conditions belong with the coefficient: it is not automatically the value for a different wavelength or reaction mixture.[ref]
For an illustrative Beer-Lambert law calculation using the central reported coefficient, an absorbance through a path length gives a molar concentrationThis chosen example shows how characterizing a reference material connects an optical reading to an amount of substance in solution.
Gilson is a laboratory-instrument manufacturer and the corporate author of Gilson Guide to Pipetting. In this bibliography, the name identifies the company, rather than an individual researcher. The guide documents small-volume liquid handling, especially the relation between a pipette setting, the liquid actually delivered, and experimental reproducibility.[ref]
Gilson Guide to Pipetting. Second edition, introductory material and pp. 8–11 on pipetting principles.
In an air-displacement pipette, a piston changes the volume of an air cushion between the piston and the liquid. In a positive-displacement pipette, the piston acts directly on the liquid in the disposable assembly. The distinction helps explain why liquid properties and operating technique can affect delivery: the dial setting alone does not establish the delivered volume.[ref]
Gilson Guide to Pipetting. Second edition, pp. 8–11: air-displacement and positive-displacement principles.
For example, repeated nominal water deliveries can be weighed and converted to volume using density and the calibration corrections. Their mean offset from measures a systematic error; variation between deliveries measures repeatability. The two answer different experimental questions: a tightly clustered set of deliveries can still have a biased mean.[ref]
Gilson Guide to Pipetting. Second edition, pp. 46–49: verification procedure, systematic error and random error.
Ian B. Smith studied oriented chemical transformations in manganese-containing solids with L. S. Dent Glasser. Their 1968 paper lists both authors in the Department of Chemistry at the University of Aberdeen. Its subject connects chemical reactions with crystal orientation: the arrangement of a product can retain a reproducible relationship to the starting material even when the material's composition changes.[ref]
Oriented transformations in the system MnO-O-H2O by Lesley S. Dent Glasser and Ian B. Smith. Publisher byline, affiliations and original September 1968 issue, pages 976–987
The distinction is useful experimentally. Identifying which substance formed answers a different question from identifying how its crystal lattice is oriented relative to the original crystal. An orientation relationship can constrain a proposed reaction mechanism beyond what chemical composition alone establishes.
Where their observations could be interpreted, Smith and Dent Glasser related the orientations to the oxygen framework and substantial migration of manganese. They also reported unexplained changes in crystallographic symmetry. Their work thus illustrates how structural observations can support a mechanism while leaving particular transformations unresolved.[ref]
Oriented transformations in the system MnO-O-H2O by Lesley S. Dent Glasser and Ian B. Smith. Summary: oxygen framework, manganese migration and explicitly unexplained symmetry changes
L. S. Dent Glasser, published in research papers as Lesley S. Dent Glasser, worked on crystallography, chemical transformations and science education. A 1968 paper with Ian B. Smith lists the Department of Chemistry at the University of Aberdeen and examines oriented transformations among manganese-containing solids.[ref]
Oriented transformations in the system MnO-O-H2O by Lesley S. Dent Glasser and Ian B. Smith. Publisher byline, affiliation and original September 1968 issue
Their observations connect chemistry with geometry: a reaction can preserve a relationship between the orientation of the starting crystal and that of the product, even while its composition changes. Where their results permitted an interpretation, the authors related the orientations to the oxygen framework and substantial movement of manganese. They also explicitly reported symmetry changes they could not explain. This makes the paper an example of using crystal structure to constrain a reaction mechanism without treating every structural observation as a completed explanation.[ref]
Oriented transformations in the system MnO-O-H2O by Lesley S. Dent Glasser and Ian B. Smith. Summary and opening discussion of oriented reactions
Her IUCr teaching pamphlet Symmetry by L. S. Dent Glasser develops the relation between finite-object symmetry, periodic arrays and space groups. Its examples show how repeating a motif introduces translations and combined operations beyond the symmetry of an isolated object.[ref]
Symmetry by L. S. Dent Glasser. Sections 2–3: point groups, repeating arrays and translational symmetry
R. Griffith Freeman developed chemical education that treats the conduct of science as part of learning chemistry. With Anne Erwin Moody, he described a sophomore seminar combining chemical-safety readings, contemporary safety reports and case discussions of scientific honesty.[ref]
Chemical Safety and Scientific Ethics in a Sophomore Chemistry Seminar by Anne Erwin Moody and others. Abstract: course goals, readings and case-study discussions
The approach makes students reason about decisions and evidence, rather than memorize only a list of prohibited actions. This entry concerns the author identified in that primary paper's Truman State University byline; the source does not establish additional personal metadata.
Bretislav Friedrich investigated orientation of cooled molecules in strong electric fields with Dudley Herschbach. Restriction of angular motion produces pendulum-like rotational states, connecting low temperature with control of a molecule’s spatial orientation.[ref]
Spatial orientation of molecules in strong electric fields and evidence for pendular states by Bretislav Friedrich and Dudley R. Herschbach. 1991, abstract: rotational cooling, spatial orientation and restricted angular motion
John G. Murphy wrote a nineteenth-century chemistry review for medical students. Its treatment of nitric oxide uses an older formula convention and an elemental gas-volume comparison, documenting how chemical notation and quantitative interpretation have changed.[ref]
Author identified on the title page of Review of Chemistry for Students by John G. Murphy. No further biographical identity is inferred from the name.
David C. Grahame developed a quantitative treatment of the electric double layer and electrocapillarity. His analysis combined the Poisson equation with the Boltzmann distribution and distinguished accumulated interfacial charge, integral capacitance, and differential capacitance.[ref]
The Electrical Double Layer and the Theory of Electrocapillarity by David C. Grahame. 1947, section VI, pp.470–474, equations43–48
Electrolytic purification by transferring the desired metal from an impure dissolving anode to a purer cathode. Impurities can stay dissolved, remain as solids or form precipitated anode slime. Potential control, transport and exclusion of solid contamination are as important as tabulated standard potentials.
Robert H. Dinegar helped develop a model for producing monodisperse sulfur hydrosols. Separating a short period of nucleation from subsequent particle growth explains how particles can begin growing at similar times and acquire a narrow size distribution.[ref]
Theory, Production and Mechanism of Formation of Monodispersed Hydrosols by Victor K. La Mer and Robert H. Dinegar. 1950, initial discussion of sulfur-hydrosol nucleation and growth; scope limited to the reported model
Victor K. La Mer developed, with Robert H. Dinegar, a model linking nucleation and particle growth to the formation of monodisperse sulfur hydrosols. A brief nucleation interval followed by growth provides a mechanism for narrowing the spread of particle sizes.[ref]
Theory, Production and Mechanism of Formation of Monodispersed Hydrosols by Victor K. La Mer and Robert H. Dinegar. 1950, sulfur-hydrosol nucleation/growth model; no claim of universality for nanoparticle syntheses
David A. Long investigated spectral parameters of rare oxygen isotopologues for atmospheric remote sensing. The molecular analysis distinguishes rotational angular momentum from total angular momentum and accounts for nuclear-spin restrictions on the allowed rotational levels.[ref]
Werner Uhl coauthored research on carbaalanes, clusters containing aluminium and carbon. A reported transformation hydroaluminates unsaturated groups while forming a capped aluminium-cube framework.
The example connects addition at an organic multiple bond with reorganization of a metal-carbon cluster. Both external substituents and the cluster skeleton must therefore be tracked when describing the product.[ref]
New Carbaalanes Containing Clusters of Aluminum and Carbon Atoms by Werner Uhl and others. Abstract: unsaturated groups, hydroalumination, and capped cube

Portrait of Werner Uhl
. Jü (Commons author field). CC BY-SA 4.0, via Wikimedia Commons. Source.
Philip DeShong investigated total synthesis of tirandamycin A. In the reported sequence, related pyranones were converted into a fused lactone; the discussion used a proposed mechanism to qualify the relative stereochemistry, rather than claiming that the reported NMR spectroscopy alone fixed the assignment unambiguously.[ref]
Total synthesis of (±)-tirandamycin A by Philip DeShong and others. 1985, pp.5220–5221, Schemes II–III and stereochemical-assignment discussion
Luiz C. Dias investigated stereoselective preparation of biologically active natural products. His account uses a specific epoxidation sequence to connect synthetic planning with control of stereochemistry, rather than treating formation of the carbon skeleton as the only goal.[ref]
Recent results toward the stereoselective synthesis of biologically active natural products by Luiz C. Dias and others. 2007 author account, Scheme2 and epoxidation discussion
Electron counting records metal valence electrons plus ligand donations using a declared convention. In ionic counting, subtract metal oxidation state from its group number, then add donor electrons; in neutral counting, combine neutral metal and ligand fragments consistently. An Fe–Fe single bond contributes one electron to the count at each metal.
A conventional class of chemical elements with properties intermediate between those commonly associated with metals and nonmetals; its membership is not a fundamental sharp boundary.
Andrew J. Peel investigated efficient metalation of unfunctionalized aromatic compounds using mixed copper–lithium amide aggregates. The work connected aggregate composition with exchange behaviour, illustrating why an organometallic reagent's structure in solution can matter to its reactivity.[ref]
A new route for the efficient metalation of unfunctionalized aromatics by Andrew J. Peel and others. 2019, Figures1,4,5 and lithium-rich exchange discussion
A molecular orbital is a one-electron spatial wavefunction for the combined atomic nuclei of a molecule. For a normalized molecular orbital, the Born rule gives the position probability density , with . The molecular orbital is the amplitude, rather than its squared modulus or a classical trajectory.
A molecular orbital is a one-electron spatial wavefunction for the combined atomic nuclei of a molecule. For a normalized molecular orbital, the Born rule gives the position probability density , with . The molecular orbital is the amplitude, rather than its squared modulus or a classical trajectory.
Articles were limited to the first 100 out of 473 total.
Articles by others on the same topic
There are currently no matching articles.