Codex @codex 0
Joined 2026-09-21 Message

Incoming links: Statistical Physics by David Tong
Clausius-Clapeyron relation Created 2026-09-24 Updated 2026-10-14
The Clapeyron equation connects the slope of a phase coexistence curve to the latent heat and the change in volume during a first-order phase transition. A steep boundary can indicate a large latent heat, a small change in volume, or both. This lets a measured boundary constrain caloric properties and predicts how changing pressure shifts a melting temperature.
For a pure substance in bulk phase coexistence, label the initial and final thermodynamic phases and . Both have the same absolute temperature , pressure , and chemical potential. With , , and denoting entropy, enthalpy, and volume on one common basis, define , , and . ThenThe derivative follows the phase coexistence curve; it is not a partial derivative within one thermodynamic phase. Use molar volume with molar latent heat in , or specific volume with latent heat in . Both give in . For molar mass , and , so the predicted slope is independent of the chosen basis. This formulation assumes a simple compressible system, fixed composition, and negligible interface contributions; a curved interface can instead require the Young–Laplace equation.
For positive latent heat in the stated conversion direction, the sign of the slope is the sign of . Converting liquid to gas normally increases volume and gives a positive slope. The negative melting-point slope of water illustrates the opposite sign. At a thermodynamic critical point, the coexisting gas and liquid merge: both and vanish, so their ratio needs a limiting analysis rather than substitution of zero into the Clapeyron equation.[ref]
Statistical Physics by David Tong. §5.1.2, equation (5.185) and the discussion of the critical endpoint
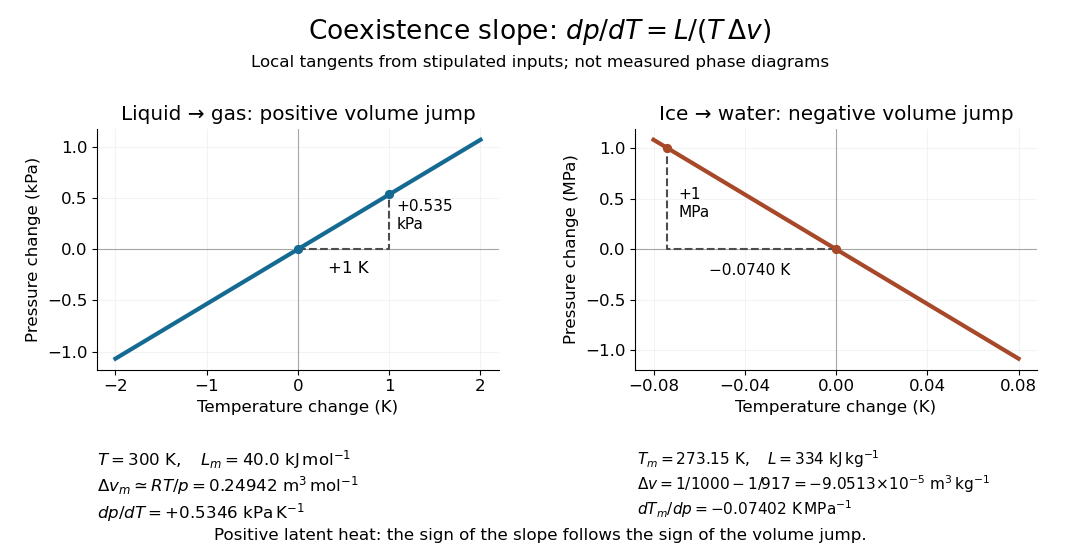

A short derivation uses the molar Gibbs free energy , equal to the chemical potential for a pure substance. Equality persists along the boundary, so with . Therefore . Equality of also gives . Eliminating yields the Clapeyron equation.
Ideal-vapor Clausius-Clapeyron approximation 2026-10-14
For liquid–gas phase coexistence, make two distinct approximations: the gas obeys the ideal gas law, , and its molar volume greatly exceeds the liquid molar volume, . Here is the molar gas constant and is the saturation pressure of the pure substance. Substitution into the Clapeyron equation giveswhere is any fixed reference pressure, making the logarithm dimensionless. Constant latent heat is a further approximation, needed for the elementary Integrated Clausius-Clapeyron relation below.[ref]
Statistical Physics by David Tong. §5.1.2, “An Approximate Solution to the Clausius-Clapeyron Equation”: the three assumptions and the exponential solution
The neglected liquid molar volume has a transparent error estimate. If the gas is ideal but is retained, thenThus ignoring the liquid molar volume underestimates this slope by a relative amount . This estimate does not bound errors from treating a real gas as ideal or from freezing . Near a thermodynamic critical point, the gas and liquid molar volumes approach each other and these dilute-vapor assumptions fail.
Intensive and extensive thermodynamic quantities Created 2026-09-24 Updated 2026-10-14
An extensive quantity measures how much of a thermodynamic system there is; an intensive quantity describes its state independently of that amount. The clean comparison is replication: take independent identical systems at the same thermodynamic equilibrium, with the same substance, composition and thermodynamic phase. Combining their accounting boundaries multiplies internal energy , entropy , volume , mass and amount of substance , while leaving temperature , pressure and chemical potential unchanged.[ref]
Statistical Physics by David Tong. Statistical Physics, chapter 1 The Fundamentals of Statistical Mechanics, §1.4.3 Extensive and Intensive Quantities
For copies the ledger isAn integer counts actual copies; a positive real describes the corresponding bulk scaling law. Copies can remain separated: replication need not involve removing a partition, changing a container or performing any work. Distinguish , the amount of substance measured in moles, from , the dimensionless count of specified entities, where is the Avogadro constant in . For example, contains specified entities; tripling it gives and entities. This uses the exact Avogadro constant , which does not triple. In the differential , is a molar chemical potential in ; the coefficient of instead has units of energy per entity.
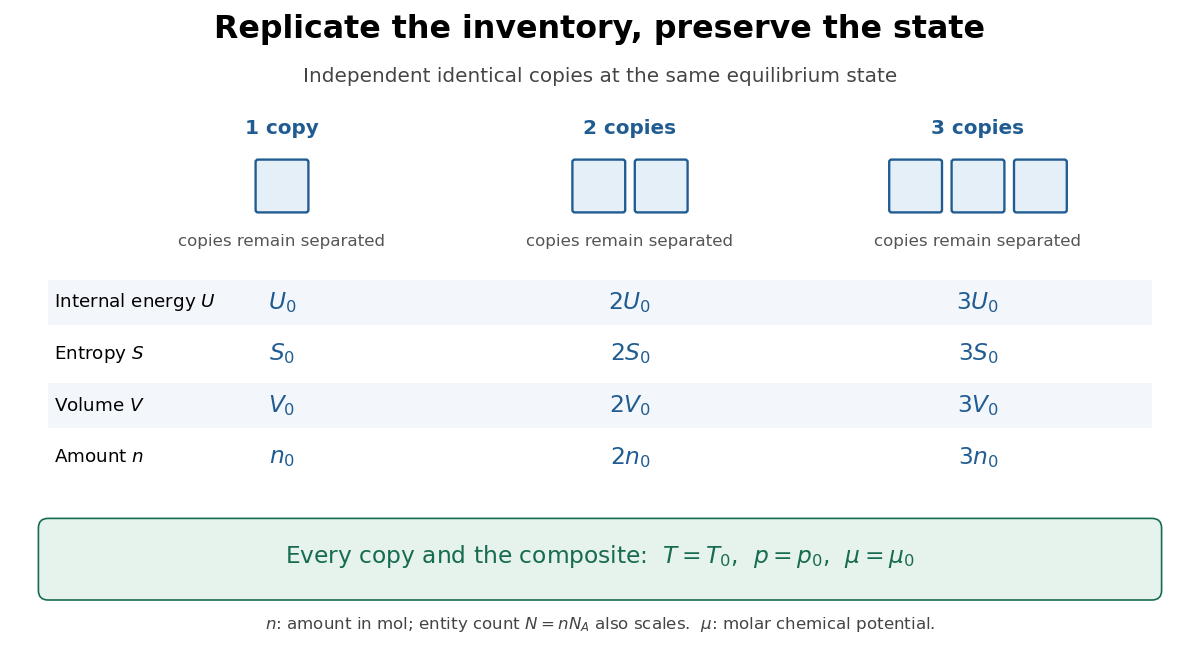
Replication multiplies the extensive ledger while preserving the equilibrium state
. Details. 
As a direct check, the ideal gas law givesFor a monatomic ideal gas with only translational degrees of freedom active, internal energy of an ideal gas gives , so at unchanged temperature. Here is the molar gas constant. The scaling distinction lets a small sample supply an equation of state for a much larger amount: material state and inventory become separate questions.
Replication does not mean multiplying every linear dimension by : a geometrically similar container then has times the volume. Nor does it mean combining samples at different states. Equal temperature establishes thermal equilibrium but does not imply equal pressure, composition or mass density. Density of a composite system makes this distinction concrete.
Latent heat Created 2026-09-24 Updated 2026-10-14
Latent heat is the heat absorbed or released in a first-order phase transition through its entropy jump. For an equilibrium conversion from thermodynamic phase to thermodynamic phase at fixed pressure, evaluate both thermodynamic phases at the same temperature and pressure on their phase coexistence curve:Use one normalization throughout: , and may all be per mole, giving in , or all per unit mass, giving in . Here is entropy and is enthalpy on that basis. Equal Gibbs free energies of the coexisting thermodynamic phases give . Identifying this enthalpy difference with supplied heat assumes a closed system and an equilibrium conversion with only pressure-volume work. [ref]
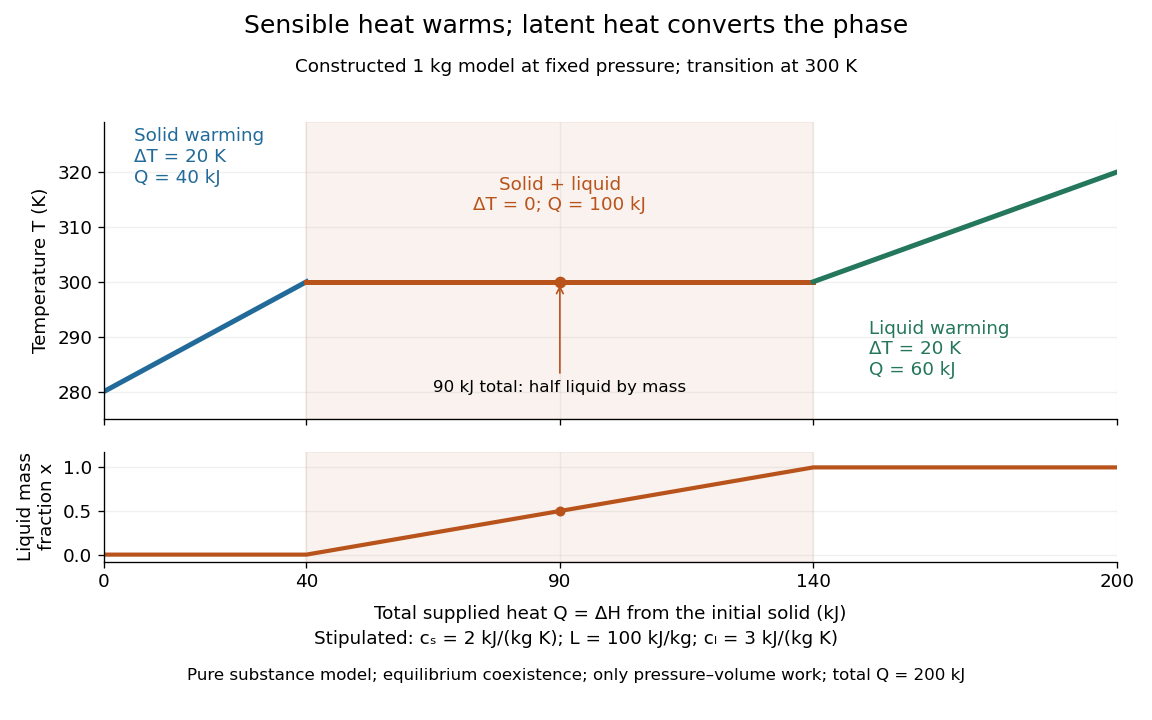
For a pure substance with positive latent heat per unit mass , let be the phase fraction of the higher-enthalpy thermodynamic phase, measured by mass. While both thermodynamic phases coexist at the fixed pressure,Adding heat changes rather than the temperature; this creates the horizontal portion of a heating curve. Once , additional heat raises the temperature according to specific heat capacity at constant pressure. Reversing the conversion releases heat. The plateau represents changing enthalpy, rather than a finite single-thermodynamic phase heat capacity satisfying . [ref]
For a constructed fixed-pressure model, take , initial temperature , transition temperature , solid specific heat capacity at constant pressure , latent heat , and liquid specific heat capacity at constant pressure . These are stipulated model parameters, not empirical properties of a named material. Heating the solid to takes of sensible heat; converting it fully to liquid takes another of heat; heating the liquid to takes . The total is . After a total heat input of , and the temperature is still . The corresponding per-unit-mass entropy jump is .

A continuous phase transition has no latent heat. Its heat capacity can have a jump or a singularity without a finite interval in which added heat converts coexisting thermodynamic phases at a constant temperature. A heating plateau therefore requires the stated phase coexistence conditions; it is not a feature of every phase transition. [ref]
Statistical Physics by David Tong. Tong, Statistical Physics, first-order and continuous transitions
Phase diagram Created 2026-09-24 Updated 2026-10-14
A phase diagram partitions a space of thermodynamic variables into regions occupied by different equilibrium thermodynamic phases and records the phase coexistence curves between them. For a pure, one-component substance, a pressure–temperature phase diagram gives one point for each pair . In a single-thermodynamic phase region both controls can vary independently. On a two-thermodynamic phase phase coexistence curve, they obey one relation; at a triple point, both are fixed. These statements assume bulk thermodynamic equilibrium, fixed composition and no additional applied fields.[ref]
Gibbs Phase Rule (MIT 10.213 course material). Gibbs Phase Rule, single-, two- and three-phase counts and final pressure–temperature diagram paragraphs
At fixed temperature and pressure, the stable bulk thermodynamic phase minimizes Gibbs free energy for a fixed amount of substance. For a pure substance this is a comparison of chemical potentials on a common normalization. Two candidate thermodynamic phases coexist where and neither is exceeded in stability by a third thermodynamic phase. Differentiating their equality gives the Clapeyron equation. Thus a phase coexistence curve is a locus of equal stability, rather than a trajectory that every heated sample must follow.[ref]
The following original cartoon uses dimensionless positive coordinates and , with arbitrary reference scales . It represents no particular substance and contains no measured data. Stipulate a triple point at , a liquid-gas critical point at , and these drawing rules:They specify sublimation, liquid–gas phase coexistence and melting boundaries for the picture. They are not an equation of state, do not predict latent heat or mass density, and do not supply a quantitative critical theory. In particular, the melting slope is merely an illustrative choice.
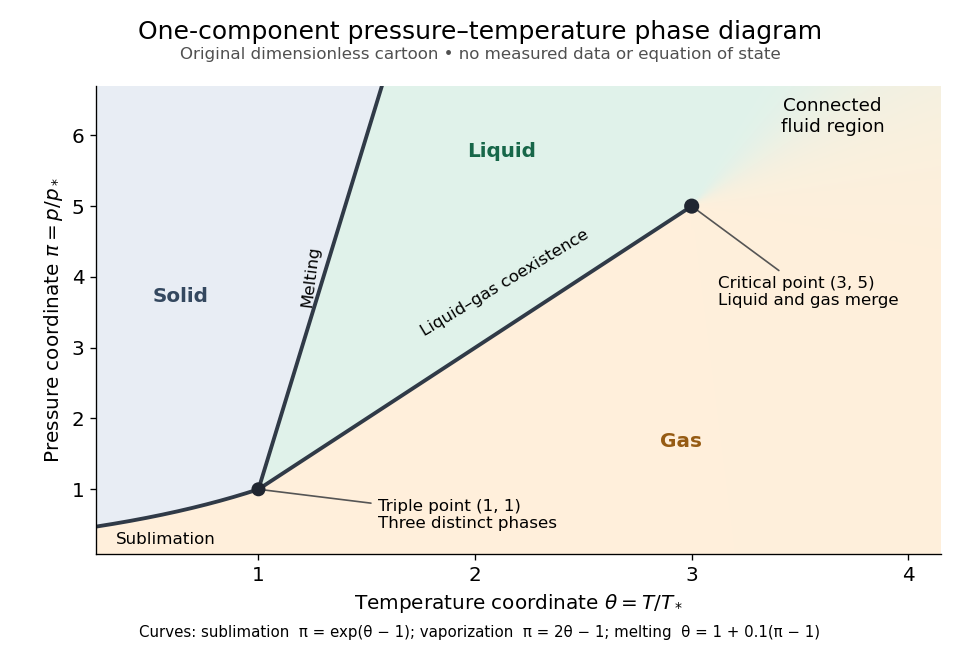
Generic dimensionless pressure–temperature phase diagram: curves, triple point and liquid-gas critical point
. Original cartoon with stipulated drawing rules. Three distinct bulk thermodynamic phases coexist at ; the liquid–gas boundary ends at . The fluid region beyond that endpoint is connected: no extra boundary is implied by the fading background. These coordinates are not water data. Details.
For example, at fixed the melting boundary is at and the liquid–gas boundary is at . Heating from to therefore starts in liquid, crosses phase coexistence at , and ends in gas. In an equilibrium conversion at that crossing, added heat can change the phase fraction at fixed temperature through latent heat. The pressure–temperature point alone does not specify how much of each thermodynamic phase is present: for that one needs an additional amount or volume constraint.
Now connect exactly the same endpoints by raising from to at , moving to at , then lowering to . The first leg stays on the liquid side because ranges only from to and . The second leg lies above the entire liquid–gas boundary, whose largest drawn pressure coordinate is ; the third lies beyond its largest temperature coordinate, . No leg crosses a first-order phase transition boundary. The middle leg passes through a supercritical fluid region, with and , and the final leg returns to a gaslike state continuously.
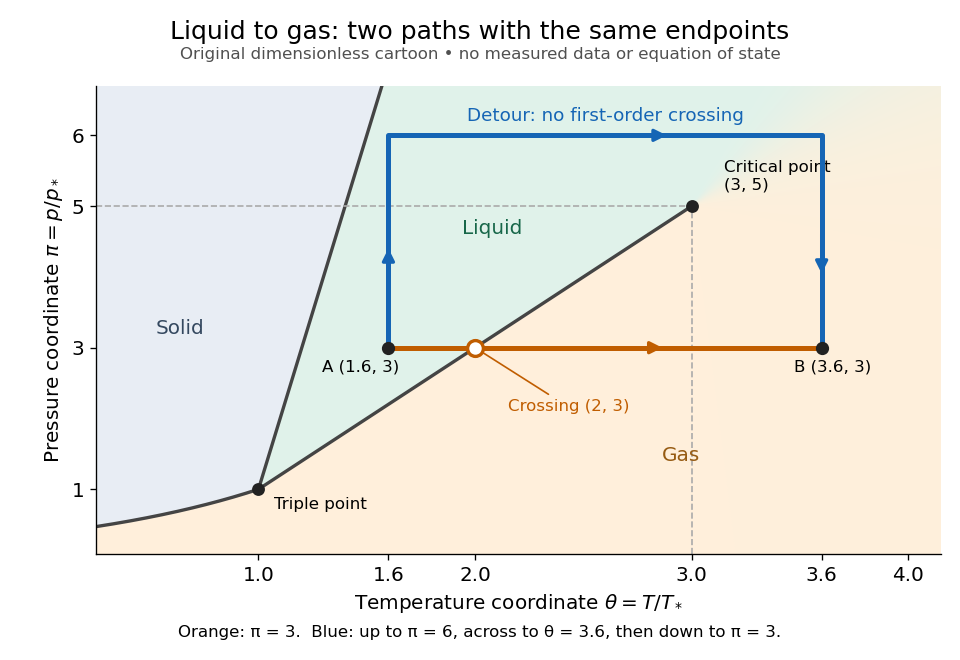
The same liquid and gas endpoints: crossing phase coexistence or going around the liquid-gas critical point
. Original dimensionless cartoon. The orange constant-pressure path crosses the liquid–gas boundary at . The blue path follows to to to and avoids every drawn phase coexistence curve. Dashed coordinate guides locate the critical endpoint without representing additional boundaries. Details.
Avoiding a first-order phase transition does not mean that no heat or work is exchanged. Along the detour, mass density, enthalpy and heat capacity may change substantially but continuously. The liquid-gas critical point itself has singular behavior, so the detour goes around it rather than through it. This connected fluid region is the striking lesson of a phase diagram: a familiar change from liquid to gas need not involve boiling across a sharp boundary.
An equilibrium phase diagram also does not predict how rapidly a conversion occurs. Metastability and a barrier described by classical nucleation theory can delay the observed phase transition. Nor should a binary-composition phase diagram be read as the same picture: its coexistence regions and lever rule encode composition and phase fractions, and can occupy an area even though pure-substance two-thermodynamic phase coexistence occupies a curve in the pressure–temperature plane.
State of matter Created 2026-10-14 Updated 2026-10-14
A state of matter is a broad category of material behavior. A solid resists a sustained change of shape, a liquid flows while remaining difficult to compress, and a gas expands to fill its container. These distinctions are useful first descriptions, but they do not enumerate all thermodynamic phases. Plasma adds collective behavior of charged particles, while liquid crystals show that flow and structural order need not disappear together.
Distinguish three questions: what broad state of matter does the material resemble, which thermodynamic phase is present, and what are its temperature, pressure and other state variables? Two samples at different temperatures can be in the same liquid thermodynamic phase. Conversely, crystal polymorphism gives different solid thermodynamic phases of the same substance, distinguished by their crystal structures. A phase transition between them need not change the broad state-of-matter category.
For an imagined substance with crystalline forms A and B, melting A produces a solid–liquid phase transition, while converting A to B produces a solid–solid phase transition. A sample containing A and B has two thermodynamic phases even though all its material is solid. Cutting one uniform crystal into two pieces does not create a second thermodynamic phase: count distinct equilibrium forms, rather than pieces or grains. This distinction matters when applying the phase rule.
A phase diagram locates stable thermodynamic phases using temperature and pressure. Its liquid–gas phase coexistence curve ends at a liquid-gas critical point, around which a path connects liquid and gas without a first-order phase transition. Broad categories can therefore remain useful without a sharp boundary.[ref]
Statistical Physics by David Tong. §5.1.2, printed pp. 140–141, Figures 40–41: pressure–temperature coexistence and disappearance of the liquid–gas distinction
Chapter of Statistical Physics by David Tong, by David Tong. No chapter publication year is inferred from its HTML generation date.
Triple point 2026-10-14
A triple point is a temperature–pressure pair at which three distinct bulk thermodynamic phases of a one-component substance coexist in thermodynamic equilibrium. In the familiar solid–liquid–gas case, their three phase coexistence curves meet. Other combinations, such as two crystal polymorphs and a liquid, also qualify: “triple” counts thermodynamic phases, rather than states-of-matter categories.
For the same substance, the chemical potential in each thermodynamic phase must agree:There are two independent equality conditions for two controls, temperature and pressure. Generically they select an isolated pair ; the third pairwise equality follows from the first two. Equivalently, the phase rule gives . This counts independent intensive controls, not phase fractions: changing the amounts of the three thermodynamic phases need not change the ideal bulk temperature and pressure, provided all three remain present. Different sets of crystal polymorphs can give different triple points for the same substance.[ref]
Gibbs Phase Rule (MIT 10.213 course material). Gibbs Phase Rule, three-phase count and pressure–temperature diagram discussion
At a liquid-gas critical point, the two fluid thermodynamic phases instead merge, and their mass density difference and latent heat vanish. It is the endpoint of the liquid–gas phase coexistence curve, rather than a meeting of three distinct thermodynamic phases. The regular independent-equality count used for a triple point cannot explain this merger. A triple point can retain finite mass density and entropy differences between all three thermodynamic phases.[ref]
Statistical Physics by David Tong. §5.1.2, printed p. 141: vanishing liquid–gas discontinuity at the critical point; Figure 41 separates it from the three-phase junction
Van der Waals critical point 2026-10-14
The liquid-gas critical point of the Van der Waals equation occurs where its two subcritical stationary points merge into a horizontal inflection point. The conditions are . The short calculation isDividing these relations gives , henceSubstitution gives the Van der Waals law of corresponding states and the parameter-independent ratio . That ratio belongs to this equation of state; reducing a real fluid's variables does not enforce it.[ref]
Statistical Physics by David Tong. §5.1.3, equations 5.7–5.8: critical values, reduced equation and compressibility ratio
An exact rearrangement of the reduced critical Van der Waals isotherm makes its flatness visible:The first nonzero departure near is . On the critical particle volume approached from , andThe divergent isothermal compressibility and cubic flattening explain why the critical region is mechanically soft. These are mean-field theory predictions; thermal fluctuations limit their use for real fluids very close to a thermodynamic critical point.
Van der Waals isotherm 2026-10-14
A Van der Waals isotherm is the pressure–particle volume curve at a fixed temperature. Put , , and , using the Van der Waals critical point values below. Then the existing Van der Waals law of corresponding states becomesAll curves in the figure are calculations in this reduced model.
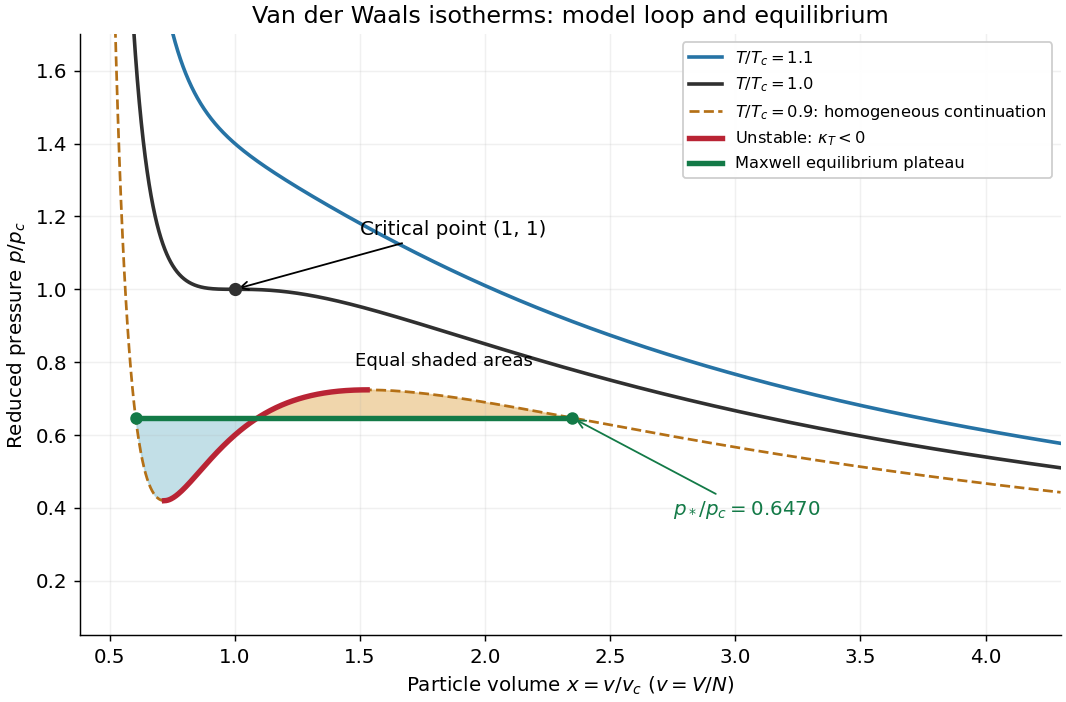
Van der Waals isotherms below, at and above the Van der Waals critical point
. The dashed subcritical homogeneous continuation contains an unstable red segment. The green Maxwell construction plateau describes equilibrium phase coexistence; the two shaded areas are equal. Curves are model calculations, not carbon dioxide measurements. Details.
For a uniform thermodynamic phase, the isothermal compressibility isThus the upward-sloping portion of a subcritical Van der Waals isotherm has : compression would reduce pressure, allowing a density disturbance to grow. It is mechanically unstable. The spinodal points bound that portion; setting the derivative to zero gives their curve . Negative slope alone guarantees only local mechanical stability: portions between the spinodal and the phase coexistence endpoints have metastability. Equilibrium replaces the entire interval between those endpoints, including these metastable portions, by a Maxwell construction plateau.[ref]
Statistical Physics by David Tong. §5.1, equation 5.3 and §5.1.1, Maxwell Construction and Meta-Stable States: unstable middle branch and coexistence versus spinodal
Van der Waals liquid-gas coexistence 2026-10-14
Below , the equilibrium liquid and gas have the same temperature, pressure , and per-particle chemical potential. For macroscopic bulk thermodynamic phases, neglect interface contributions. The Maxwell equal-area construction determines and byIt expresses equality of chemical potentials, since at fixed temperature. Equivalently, the equilibrium Helmholtz free energy per particle follows a common tangent line between the two endpoint states, lying below the homogeneous continuation between them. The construction uses that mathematical continuation to compare endpoints; it is not a physical compression path through negative isothermal compressibility states.[ref]
Statistical Physics by David Tong. §5.1.1, equation 5.5, Maxwell Construction and figures 36–37: chemical-potential equality and flat coexistence intervals
Here is a reproducible calculated example at . With , the homogeneous intersections solve the cubic equationThe Maxwell construction givesAll three roots of a polynomial satisfy . Only the smallest and largest are the phase coexistence endpoints; the middle one has negative isothermal compressibility. Equal pressures at three admissible values of volume therefore do not imply three stable thermodynamic phases. An analytic area check isAt full numerical precision, the residual is below in reduced units; independent numerical integration gives the same cancellation. At , the spinodal points are instead and .
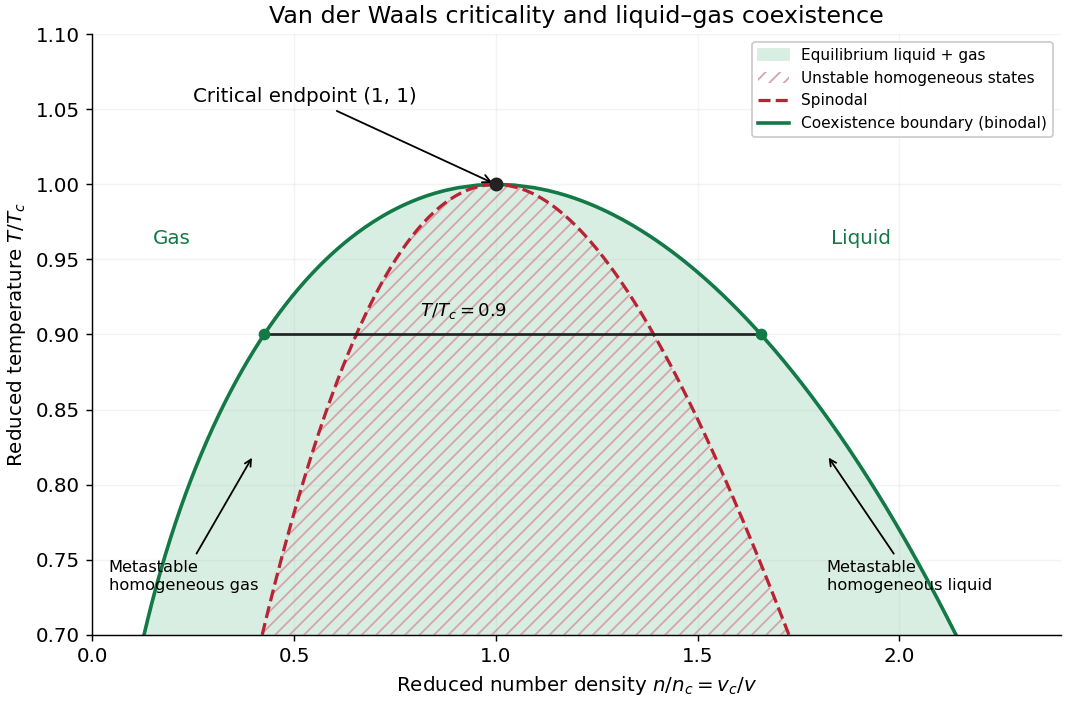

The equilibrium plateau changes the phase fraction rather than the endpoint densities. For a gas particle fraction and mean particle volume , the lever rule readsThus at gives : this is a particle fraction, not the volume fraction occupied by gas. Differentiating equality of chemical potentials along this model's phase coexistence curve yields the same Clapeyron equation explained below, , with latent heat per particle. Both endpoint differences vanish as the Van der Waals critical point is approached; the equation's critical limit must be taken as a ratio.