
Plant embryo Created 2026-10-14 Updated 2026-10-20
SEC protein conformation experiment 2026-10-14
An authored manufacturer experiment used an Agilent 1260 Infinity Bio-inert Quaternary LC with Bio SEC-3 columns, diameter and or length. Four pump channels mixed water, sodium chloride, and two phosphate solutions into phosphate at pH , varying salt from to . At and , the readouts were diode-array absorbance, differential refractive index, and scattering at and . A supplied protein standard mixture calibrated retention; bovine serum albumin calibrated scattering constants and inter-detector delay. Increasing salt improved separation of two α-chymotrypsinogen A peaks; two columns also resolved peaks that one column did not. At salt, the two scattering-derived estimates were about and . The author inferred a possible size-changing conformation difference, rather than doubling of molar mass. The same poster shows delayed, tailing lysozyme peaks from unwanted interactions.[ref]
Size Exclusion Chromatography of Biomolecules – Detector Combinations to Obtain Maximum Information with Minimum Effort by Andrew Coffey. Andrew Coffey, Size Exclusion Chromatography of Biomolecules – Detector Combinations to Obtain Maximum Information with Minimum Effort, HPLC 2013, poster 901: Experimental; Figures 3–7; Table 1
The salt comparison and the independent mass readout constrain interpretation, but do not uniquely prove a particular protein structure. Salt can change protein folding, protein aggregation, and packing interactions together. In ideal SEC there is no adsorption; attraction from the hydrophobic effect or forces described by electrostatics can cause additional retention, tailing, and loss of recovered sample. Repulsion can instead reduce pore entry. A peak beyond contradicts the simple nonbinding model, rather than extending its size calibration.
Useful proposed controls compare a solvent blank, fresh calibration standards bracketing the sample, several injection amounts and volumes, and recovered sample quantity with injected quantity using an appropriately calibrated detector. Keep temperature and volumetric flow rate fixed while testing pH or ionic strength. Compare an independent mass readout before declaring an early peak an aggregate. Loss of an insoluble species during filtration, on-column association or dissociation, overloading, and broad unresolved peaks can all hide the original sample population. These are interpretation checks and limitations, not measurements invented for the figures.
SEC detector response 2026-10-14
A SEC detector response must be specified before interpreting a peak area. Ultraviolet absorbance depends on a species' response factor and concentration, as described by the Beer-Lambert law; differential refractive index detection depends on how the dissolved species changes refractive index. Equal amounts need not produce equal signal areas across unlike species.
Even a calibrated mass-proportional trace is not a chain-count probability distribution. In an original two-population example, equal recovered masses of chains with molar masses and contain four times as many chains in the lighter population. Thus equal signal areas, assuming equal response per unit mass, correspond to number fractions and : their number-average molar mass is , while their weight-average molar mass is . Converting a continuous trace additionally requires response correction and the appropriate change of variables between elution and molar mass bins.
Schur complement determinant identity 2026-10-14
When is an invertible matrix, the factorization in block elimination has outer triangular factors with determinant one. Hence , without a symmetry assumption. For the original example under block matrix inverse, this gives . An invertible block therefore reduces the question of whether the full matrix is an invertible matrix to the smaller Schur complement; a singular makes a singular matrix.
Let be a real symmetric matrix with a positive-definite matrix. Its quadratic form satisfies the completing the square identityFor each fixed vector , the unique minimizing vector is , so the minimized value is . Also, is a positive-definite matrix exactly when is a positive-definite matrix, under the stated assumption on .[ref]
An original scalar example isHere , , , and the Schur complement is . Holding would give , but letting relax to reduces the quadratic form to . At the respective values are and . Eliminating a variable therefore changes the effective cost of the retained variable.
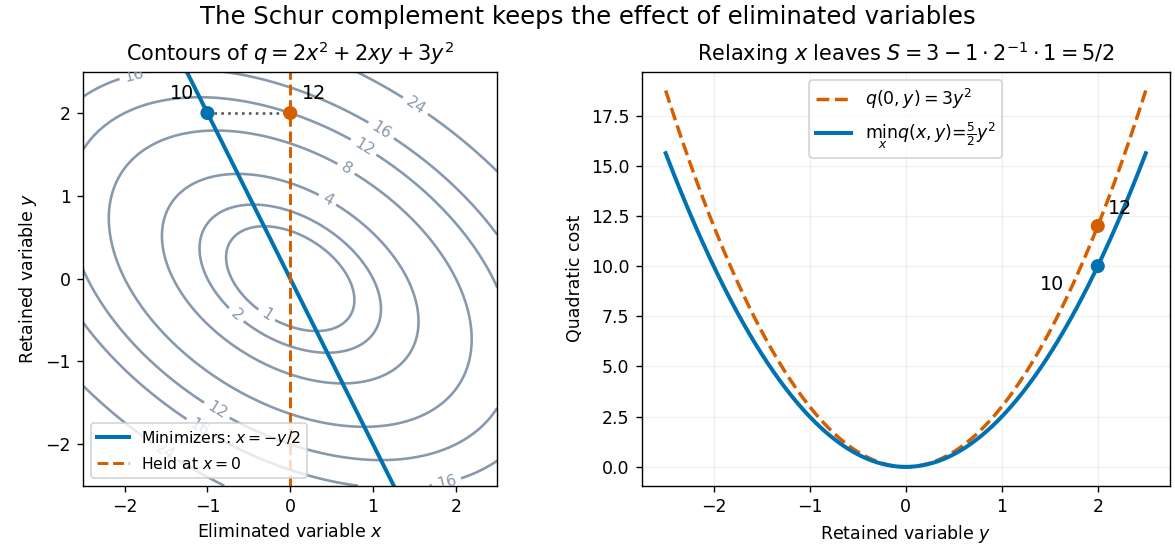

This interpretation supports quadratic optimization and the positive-definite symmetric matrix tests used in Cholesky decomposition. In a multivariate normal distribution, a covariance matrix also gives a conditional covariance through a Schur complement; the required probabilistic hypotheses are supplied by conditional multivariate normal distribution, rather than by the algebra alone.
Supersaturated solution 2026-10-14
A supersaturated solution has an ion product above the relevant solubility product. It can persist through metastability: nucleation must first create a sufficiently large new solid region. Added surfaces, impurities and mixing history can affect that barrier. Therefore a clear sample during a finite observation does not prove undersaturation, and visible cloudiness does not measure the ion product.
Explicit Runge-Kutta method 2026-10-14
An explicit Runge-Kutta method has whenever . Its stage matrix is strictly lower triangular: compute each Runge-Kutta stage using already known slopes, starting with . In contrast, an implicit Runge-Kutta method requires solving coupled stage equations, whose existence is addressed by stage solvability of an implicit Runge-Kutta method.
Runge-Kutta stage 2026-10-14
A Runge-Kutta stage consists of a trial state at the time node and the corresponding vector field evaluation . In the slope convention, . Stages belong to the construction of one Runge-Kutta method step; they need not have the same accuracy as its final output. Stage states can leave the physically allowed region even when the endpoint lies inside it, so must be defined at every stage used.
Work by Robert Lee 2026-10-14
Work by Robert J. Lefkowitz Created 2026-10-14 Updated 2026-10-25
Point reflection Created 2026-10-14 Updated 2026-11-05
A point reflection about sends each point to . The point is the midpoint of and its image, and applying the map twice is the identity. It is a Euclidean isometry since preserves the Euclidean norm. In the Euclidean plane it is a rotation through ; in dimension its determinant is , so it reverses orientation exactly in odd dimension. A figure invariant under this map has as a center of symmetry.
Work by Richard Rusby 2026-10-14
Respiratory quotient 2026-10-14
The respiratory quotient compares carbon dioxide production with molecular oxygen consumption over the same interval. Complete glucose oxidation in the net equation above gives . In the ideal respirometer gas balance with no absorber, , that conversion gives : substantial cellular respiration can occur without any net gas contraction. A zero contraction therefore does not by itself demonstrate zero metabolism.
Other fuels, incomplete conversion and concurrent synthesis can alter the ratio. Absorber-based respirometry isolates molecular oxygen uptake by deliberately removing the other gas signal; it cannot independently determine the respiratory quotient or identify glucose as the consumed fuel. Separate carbon dioxide measurement would supply the missing account.
Gaussian regression toward the mean 2026-10-14
Take the original synthetic model and , mutually independent random variables, with the second argument denoting variance. The pair has a multivariate normal distribution with mean zero, unit marginal variances, and Pearson correlation coefficient . Its conditional multivariate normal distribution isFor a first reading , the second reading has conditional expectation and conditional variance , hence standard deviation . There is still conditional probability of , a movement farther from zero, where is the standard normal distribution function. The line describes a conditional mean, not an individual trajectory.
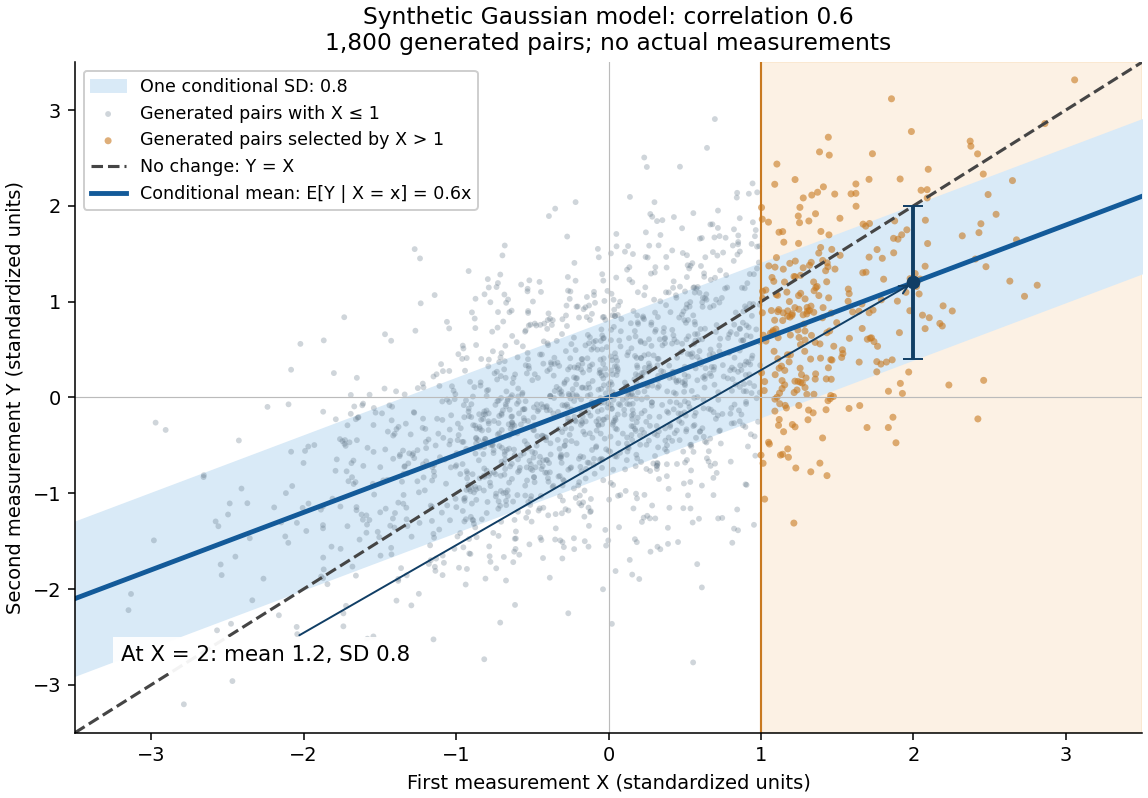

A short derivation isolates . Its covariance with is zero and its variance is . Because has a multivariate normal distribution, zero covariance implies independence: independently of . This also explains why reversing the two measurements gives . The statistical association does not identify a direction of causal effect.
RT-qPCR 2026-10-14
RT-qPCR applies qPCR after reverse transcription. Differences in RNA recovery and conversion into Complementary DNA can affect its inferred starting amount as well as differences in PCR efficiency.
Constant random variable Created 2026-10-14 Updated 2026-10-31
A constant random variable takes the same fixed real number at every outcome in its sample space. Its probability distribution puts mass one at . An almost surely constant random variable may differ on an event of probability zero, while having the same probability distribution.
Work by Randall M. Schoonover 2026-10-14
Microwave Created 2026-10-14 Updated 2026-11-05
A microwave is a short-wavelength radio wave, commonly on millimetre-to-centimetre scales. Like other electromagnetic waves, it carries energy through coupled electric fields and magnetic fields; its scale makes conducting waveguides and resonant cavities practical.
A source, conducting guide, movable probe and detector can map a standing wave produced by reflection. Neighboring amplitude maxima are separated by half the guide wavelength, which need not equal the free-space wavelength because guided propagation has its own dispersion relation. Microwaves also drive suitable molecular or spin transitions, linking cavity apparatus to spectroscopy.
Work by R. F. Irvine 2026-10-14
A 2018 photonic experiment makes the distinction between populations and quantum coherence controllable. A 400-nm laser pumped a crystal to generate paired photons, filtered near 800 nm. One photon triggered collection; the other entered the apparatus. A half-wave plate and polarizing beam splitter selected horizontal photon polarization; another half-wave plate prepared balanced quantum superpositions. Separated polarization paths and diffraction gratings let a spatial light modulator control their frequency-dependent quantum phases and spectral weights. Recombined paths passed through quartz plates whose adjustable thickness controlled polarization–frequency coupling. Quarter- and half-wave plates plus a polarizing beam splitter selected tomography bases; jointly registered photodetector events supplied the readout. Quantum state tomography inferred polarization density matrices at each thickness. The dephasing model preserves diagonal populations while changing off-diagonal quantum coherence. Here the unobserved photon frequency acts as the environment for the polarization qubit. Finite modulator resolution and imperfect spectral shaping limited agreement with the intended dynamics; this experiment does not establish exact preparation or the ideal probabilities above. [ref]
Experimental implementation of fully controlled dephasing dynamics and synthetic spectral densities by Zhao-Di Liu and others. Experimental implementation of fully controlled dephasing dynamics and synthetic spectral densities, Nature Communications 9, 3453 (2018), Results: Experimental setup, Fig. 1, equations (1)–(5); Using a photon to simulate qubit coupled to Ising chain, systematic-error discussion after Fig. 3
There are unlisted articles, also show them or only show them.