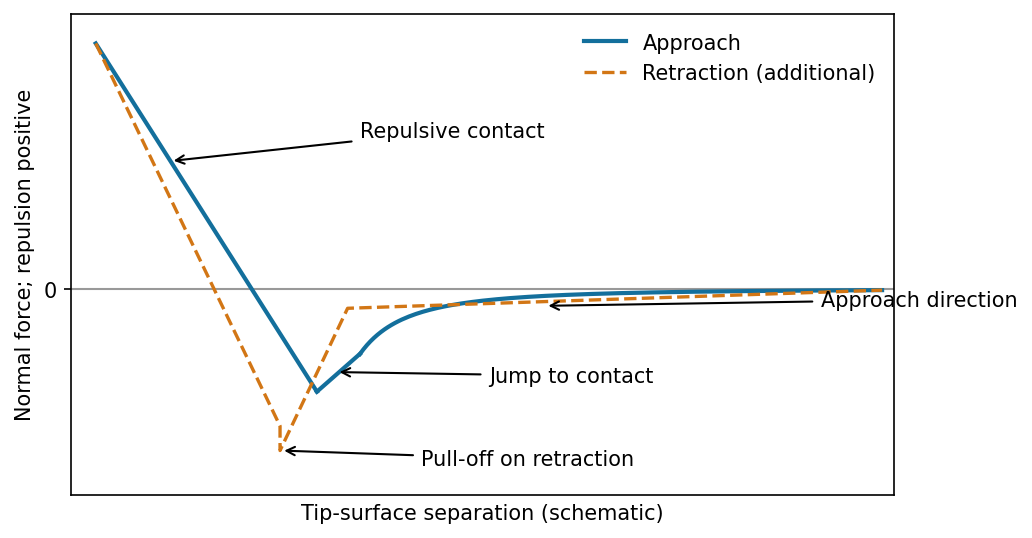
The atomic force microscope measures the cantilever deflection , converted to normal force by after calibration. On approach, the force is initially almost zero, then attractive; a sufficiently steep attractive force gradient causes jump-to-contact. After contact, further approach bends the cantilever and indents the sample, giving a rising repulsive branch. With tip-surface separation increasing to the right, approach proceeds from right to left. The instability occurs when the magnitude of the attractive force gradient exceeds the cantilever stiffness. The contact-branch slope depends on both cantilever and sample compliance.
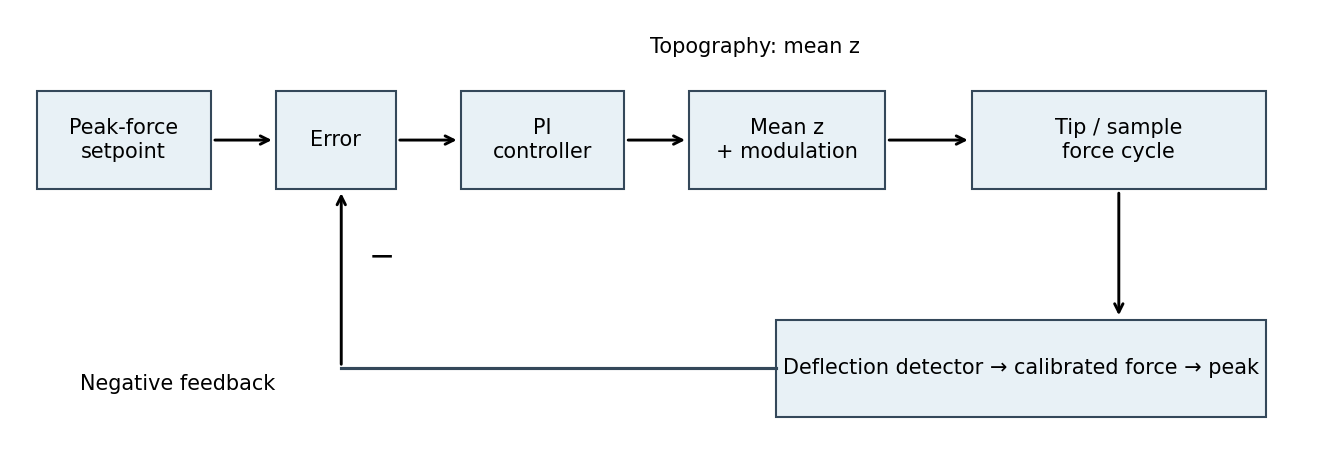
The controlled quantity is the maximum repulsive force in each tapping cycle. In PeakForce quantitative nanomechanical mapping, a vertical modulation below the cantilever resonance produces a force-distance cycle at each pixel. The optical lever measures deflection; the calibrated cantilever stiffness converts this to force. Subtract the measured peak force from the setpoint and use proportional-integral control to adjust the mean vertical scanner position. Excessive peak force makes the controller withdraw the sample or tip; insufficient force makes it approach. The scanner position required to maintain the setpoint supplies the topography signal. This controls the top of the repulsive branch in the preceding curve, rather than the oscillation amplitude used in conventional tapping mode.[ref]
Two useful properties are adhesion and contact elastic modulus. The pull-off force, the most negative force on retraction relative to the noncontact baseline, maps adhesion. Fit the contact part of the force-indentation relation using a suitable contact mechanics model to obtain a reduced elastic modulus; for example, the DMT contact model useswhere , is the calibrated tip radius and is indentation. Converting to a sample Young's modulus also requires the tip modulus and the two Poisson's ratios. The approach curve alone does not supply a retraction pull-off measurement. The loop area can additionally map dissipated energy; it is not automatically a purely viscous loss.[ref]
Treat the magnetic electron lens as a paraxial thin lens. A point in the specimen sends rays through different lens positions; the lens brings these to a conjugate point in the image plane, with and transverse magnification . Conversely, waves leaving different specimen points at the same angle are focused to the same point in the back focal plane. This plane therefore contains the electron diffraction pattern, with radius for small scattering angle . The specimen is just beyond the front focal plane, giving a magnified real image farther downstream.
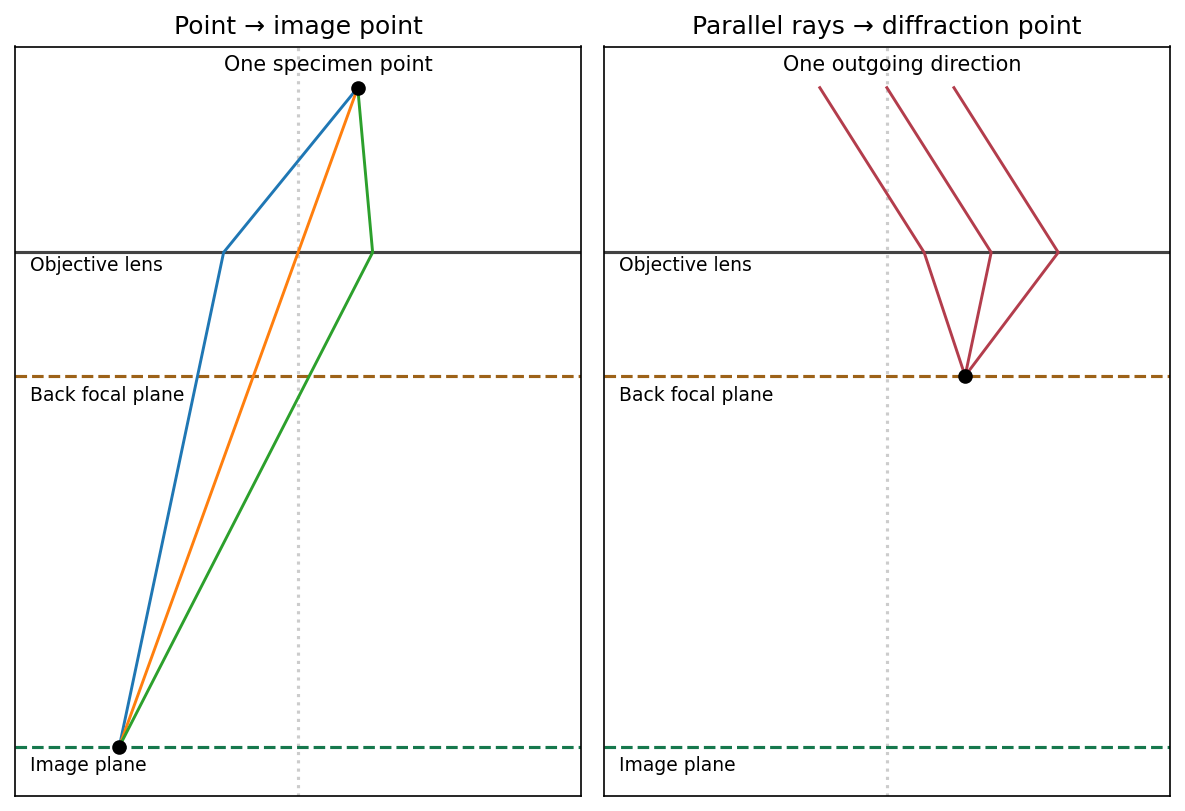
The sketch assumes a thin specimen, coherent approximately parallel illumination, small angles and an ideal lens without aberrations. Quantitative diffraction intensities may require dynamical scattering; the ray sketch only establishes the plane conjugacies.[ref]
Objective lens by JEOL. Objective image formation
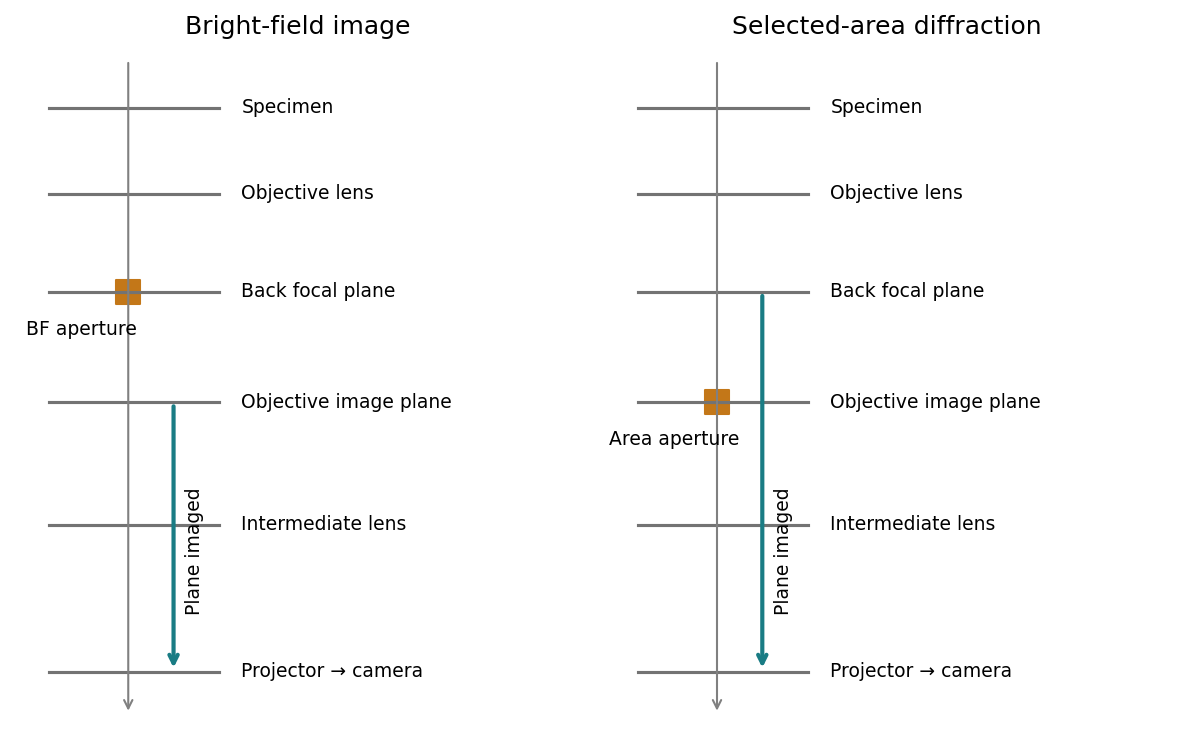
For bright-field transmission electron microscopy, place the objective aperture in the back focal plane around the transmitted beam, excluding most diffracted beams. Adjust the intermediate lens to image the objective's real-space image plane; projector lenses enlarge that image onto the screen or camera. Regions removing electrons from the admitted beam tend to be darker, although phase contrast can also contribute.
For selected-area electron diffraction, put the selected-area aperture in the objective image plane to choose a specimen region. Remove or open the objective aperture and change the intermediate-lens excitation to image the objective's back focal plane onto the camera. The projector then magnifies the diffraction pattern, rather than the specimen image. Thus the two apertures act in different conjugate planes.
[ref]
Selected-area diffraction by JEOL. Area-selection aperture in the objective image plane and conjugate diffraction-plane imaging
The resolved graphitic fringes indicate high-resolution phase contrast in a multi-walled carbon nanotube. Interference of transmitted and diffracted electron waves produces lattice fringes; their darkness is controlled by defocus, thickness and the contrast transfer function, so a dark fringe is not an unqualified map of individual carbon atoms. The weakly scattering central channel is lighter than the multilayer walls. Curved, roughly parallel fringes at its sides identify concentric graphitic shells; the dense fringes at the lower edge arise from overlapping graphitic material or another tube, not necessarily the wall count of the central tube.
Using the printed scale bar, the central tube has an outer diameter of roughly – and an inner channel of roughly –, depending on the cross-section selected away from the overlap. Several wall fringes are resolved on each side, with separations of order , consistent with graphitic interlayer spacing. These are approximate image measurements, not a determination of chirality, chemical purity or an exact shell count. The image alone cannot establish those quantities.
A high-pressure Mercury arc lamp is a conventional source for proximity photolithography. An electric discharge excites Mercury vapour; radiative transitions produce strong spectral lines, selected by filters and delivered through collimating optics. Common lines are (i-line) and (g-line). The finite mask-wafer gap gives near-field Fresnel diffraction, rather than the far-field approximation. Diffracted light spreads into nominally dark regions, limiting the minimum printable feature.
With the proximity-resolution convention , the maximum mask-wafer gap isFor and , at . If the g-line is used instead, at . The wavelength must be specified; the question's preceding choice of two lamp lines does not select a unique number. This estimate neglects extra loss of resolution from finite resist thickness, mask imperfections and angular illumination spread.
Projection lithography images a mask through reduction optics; its resolution scales approximately as . It offers parallel exposure, high throughput and accurate repeat patterning, but small features demand short wavelengths, large numerical aperture, costly optics and high-quality masks, with a shrinking depth of focus.
Electron beam lithography directly writes a programmable pattern using a focused electron beam. Its much shorter wavelength and small probe permit nanometre-scale features without an optical mask, making it attractive for research prototypes, low-volume devices and mask fabrication. Its limitations are serial writing time, charging of insulating substrates, beam drift, field stitching and forward/backscattering proximity effects in electron-beam lithography. Electron wavelength alone does not set the resist resolution. E-beam is often preferable for a few very small custom structures; projection remains preferable for high-volume repeated manufacture.
Use thermal evaporation or electron-beam evaporation: evaporated Au travels approximately ballistically to the Si wafer. For line-of-sight deposition, the gas mean free pathshould greatly exceed the source-wafer distance . Increasing the chamber's useful transport length therefore requires a proportionately lower pressure to retain the same , for fixed gas and temperature. There is no universal pressure requirement determined by chamber volume alone.
A distant compact source gives a more uniform angular flux across the wafer, but the deposition rate falls roughly as . For an ideal cosine-emitting point source and a parallel wafer, the relative thickness at lateral radius is approximately . Mitigate the trade-off with wafer rotation and planetary motion, multiple or extended sources, shaped masks and suitable source/wafer geometry. Rotation averages azimuthal variation; ordinary rotation alone does not remove a purely radial thickness gradient. A thin Ti or Cr adhesion layer may be needed for robust Au adhesion to oxidized Si.
The arrangement is diode sputter deposition: the Au target, a, is attached to the upper cathode assembly c; positive Ar ions bombard it and sputter Au onto the wafer. The lower wafer-holder electrode b is the anode in the simple two-electrode arrangement shown.
Unlike evaporation, sputtering needs enough inert gas to sustain a discharge. Over a low-pressure operating interval, raising Ar pressure can increase ionization and ion current and hence the sputtering rate at comparable applied voltage. This is not a universal monotonic law: at higher pressure, scattering and thermalization of sputtered Au reduce the fraction reaching the wafer; at fixed regulated power, target voltage and current also adjust. A pressure increase can initially increase the rate, but excessive pressure lowers transport efficiency.
DLVO theory adds short-range attractive Van der Waals forces to repulsive overlap of the electric double layer. Increasing salt concentration raises the ionic strength and shortens the Debye length, screening the repulsion. The repulsive barrier falls, so thermal collisions can carry particles into the primary attractive minimum and cause colloidal coagulation. An intermediate shallow secondary minimum can instead produce weak, potentially reversible association.
The figure's assignments are a: low salt; b: intermediate salt; c: high salt. Curve a has the largest protective barrier, b a lower barrier and secondary minimum, and c no effective repulsive barrier. This explanation assumes the surface charging chemistry does not independently reverse or radically change the surface potential.
The critical coagulation concentration is the electrolyte concentration at which rapid, approximately diffusion-limited colloidal coagulation begins: the electrostatic barrier has become ineffective and nearly every sufficiently close encounter sticks. It is an operational threshold for the specified colloid and electrolyte, not a universal concentration or a guarantee of a mathematically exact zero barrier in every system.
In the usual high-surface-potential Schulze-Hardy rule approximation, , where is the magnitude of the counterion valence. Consequently,Multivalent counterions screen surface charge much more effectively and strongly lower the electrostatic barrier. The sixth-power estimate includes the way the critical ionic strength and screening condition change with valence; merely scaling the ordinary Debye length at fixed salt concentration would not derive it. Specific adsorption, charge regulation or ion correlations can produce substantial deviations.[ref]
Schulze-Hardy rule in the IUPAC Gold Book. Counterion-valence sensitivity of the critical coagulation concentration
Use steric stabilization: attach or strongly adsorb a dense layer of polymer chains or compatible ligands, with tails well solvated by the nonpolar liquid. Overlap of these layers costs osmotic and conformational free energy and prevents particle cores reaching the strongly attractive contact region. The anchoring groups must bind the particle while the exposed chains prefer the solvent; sufficient coverage and a good solvent are essential. Nonpolar media do not make charging impossible, but electrostatic stabilization there requires an appropriate ion-generation and charge-stabilization mechanism, rather than assuming aqueous dissociation behaviour.
Adsorbed or grafted polymers stabilize a colloid through steric stabilization when coverage is high and the solvent keeps the chains extended. Charged chains can add electrostatic repulsion, giving electrosteric stabilization.
They can destabilize it through polymer bridging flocculation when a chain adsorbs onto two particles, especially at incomplete coverage; through depletion force when nonadsorbing polymer is excluded from the gap and the surrounding solution's osmotic pressure pushes particles together; or through collapse of an adsorbed layer in a poor solvent. Polymer identity, molecular size, solvent quality, adsorption and concentration determine which mechanism dominates.
The discharge reaction is . It transfers two electrons and has per reaction as written. The reversible open-circuit voltage isThe supplied free energy is already at approximately the requested temperature, so an additional temperature factor is unnecessary. Actual activities or discharge polarization could alter the terminal voltage.
The stored energy is , and the load draws . HenceThis is an ideal energy-budget estimate using 365.25 days per year. It assumes the stated energy is usable at this load, constant current and voltage, and negligible self-discharge, ageing and reserve capacity. No biological operating model is required.
The Seebeck effect produces an open-circuit voltage when a material has a temperature gradient: for the stated sign convention. A circuit containing dissimilar thermoelectric legs converts this into useful voltage and current. The intrinsic thermoelectric figure of merit isHere is electrical conductivity and total thermal conductivity. has units ; is dimensionless. A large Seebeck coefficient and electrical conductivity, together with low thermal conductivity, favour efficient conversion.
At low carrier concentration, can be large but electrical conductivity is too small. Increasing the carrier concentration usually increases , while decreases. Electronic thermal conductivity rises approximately as by the Wiedemann-Franz law; lattice conduction supplies an additional background. Thus neither an insulator nor an ordinary metal usually maximizes .
Heavily doped semiconductors and semimetals often give the useful compromise, near a maximum of as doping is varied. The optimum is material- and temperature-dependent; there is no universal optimal concentration.
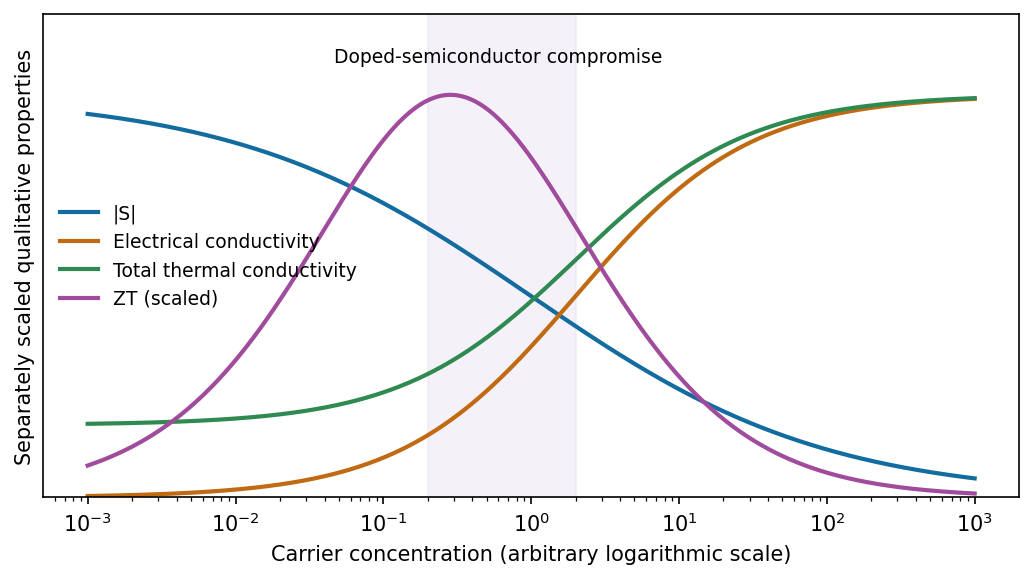
[ref]
Complex thermoelectric materials by G. Jeffrey Snyder and Eric S. Toberer. Carrier-concentration trade-off and thermoelectric optimization
Tune doping to the optimum carrier concentration; a rise in conductivity is useful only if it outweighs the accompanying loss of thermopower and extra electronic heat conduction. Band convergence, favourable density of states and energy-dependent transport can improve the power factor , provided mobility is retained.
Reduce lattice thermal conductivity through alloy disorder, heavy or complex unit cells, grain boundaries and nanoscale inclusions that scatter phonons. Aim to scatter heat-carrying phonons much more strongly than charge carriers; indiscriminate disorder can reduce both thermal and electrical conductivity. Nanostructuring and interfaces can therefore help, but an improvement must be demonstrated in total at the operating temperature, not inferred from lower alone.[ref]
Complex thermoelectric materials by G. Jeffrey Snyder and Eric S. Toberer. Strategies for improving electronic transport and reducing lattice heat conduction
One image takes if means one completed scan line per second. The slow-axis speed is . Recording a wire spanning along that axis therefore takes . Meanwhile the fast-axis drift is , giving a transverse displacement of . The apparent straight-line length isIts slow-axis projection remains ; the overestimate refers to length along the slanted trace.
With the wire along the fast axis and drift along the slow axis, its length is acquired within one line, so . Taking a forward sweep of across , the wire is crossed in and the perpendicular displacement is only . The corresponding length change is about , far below the pixel pitch. For the convention in which one hertz includes a forward and reverse sweep, that already negligible displacement halves. The slow-axis calculation still uses one completed line per second.
Place the wire parallel to the fast scan axis. The endpoints are then recorded in a fraction of a line period, rather than tens of seconds apart, minimizing the differential drift accumulated between them.
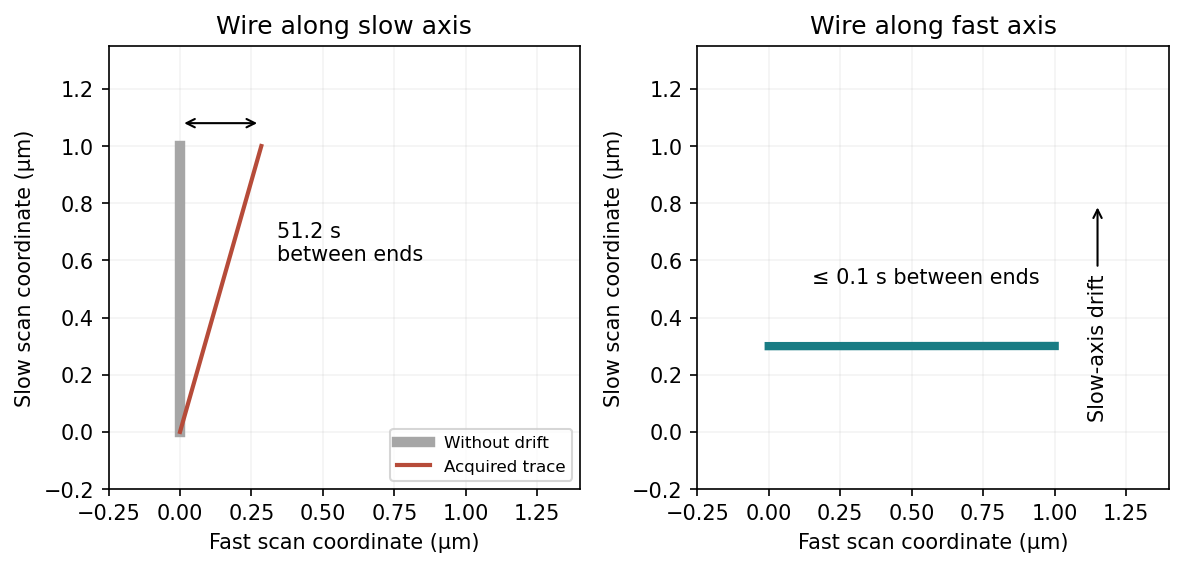
This does not remove drift of the wire's transverse position or apparent width between successive lines. A very thin wire parallel to the fast axis may fall between the discrete slow-axis scan lines, so a smaller scan area or denser sampling can be needed. Tip convolution, pixel resolution and feedback lag remain; trace/retrace comparisons and allowing thermal equilibration are still valuable. Increasing the scan speed indefinitely is limited by the scanner and feedback bandwidth.
Scanner bow is the relevant artefact. A piezoelectric tube scanner bends to produce lateral displacement; its moving end also follows a curved vertical trajectory. Cross-coupling of lateral and vertical motion therefore gives a roughly quadratic height background even over a flat reference. Over a wide scan it can mimic or conceal a genuine parabolic sample profile; its sign depends on scanner geometry and height convention.
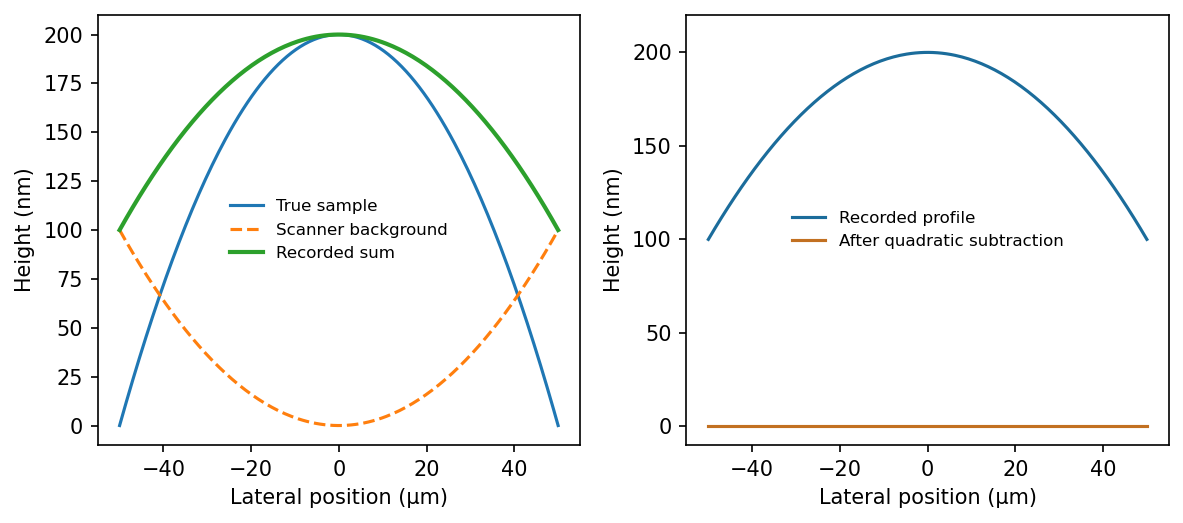


Common processing fits and subtracts a low-order polynomial background, often a quadratic surface or a polynomial for each scan line. This AFM image flattening removes scanner curvature on an assumed flat sample. Here the desired specimen signal is itself roughly quadratic, so such subtraction can remove the actual bulge along with the artefact. The two contributions cannot be separated by polynomial fitting to this image alone. A plane subtraction removes tilt but does not independently calibrate curvature.
Measure a genuinely flat calibration reference over the same scan range, scanner position and operating conditions, then subtract its reproducible bow background from the specimen data. Retain reference flat regions outside the feature if available, fitting only those regions rather than the bulge. A scanner with independently measured vertical motion or suitable closed-loop correction reduces the instrumental uncertainty. Translating or rotating the specimen checks whether a feature follows the specimen or the scanner coordinates; independent optical or stylus profilometry can corroborate its height. For a rotationally symmetric parabola, rotation alone is not sufficient. Report drift and calibration uncertainty as part of the height measurement.
The left transistor is an n-channel MOSFET in a p-type silicon substrate; the right is a p-channel MOSFET in an n-well. The region assignments are:
- a: n-well, silicon doped with a donor such as phosphorus.
- b: p+ substrate contact, heavily boron-doped silicon.
- c: n+ source of the nMOS device, arsenic- or phosphorus-doped silicon.
- d: n+ drain of the nMOS device, with the same donor dopants.
- e: p+ drain of the pMOS device, boron-doped silicon.
- f: p+ source of the pMOS device, boron-doped silicon.
- g: n+ well contact, heavily donor-doped silicon.
- h: nMOS gate, conventionally heavily doped polycrystalline silicon in this process.
- i: thin nMOS gate dielectric, conventionally silicon dioxide.
- j: pMOS gate, conventionally heavily doped polycrystalline silicon.
- k: thin pMOS gate dielectric, conventionally silicon dioxide.
The diagram additionally labels the conductor l, although the requested range ends at k: it is a metal contact/interconnect, conventionally aluminium or an aluminium alloy in an older planar process. Modern processes can use metal gates, high-permittivity gate dielectrics and different interconnect stacks; these are alternatives, not evidence that the illustrated conventional gate is aluminium.
For a CMOS inverter, join h and j to the input and d and e to the output. Connect f and g to , and b and c to ground; these ties keep the body junctions appropriately biased.
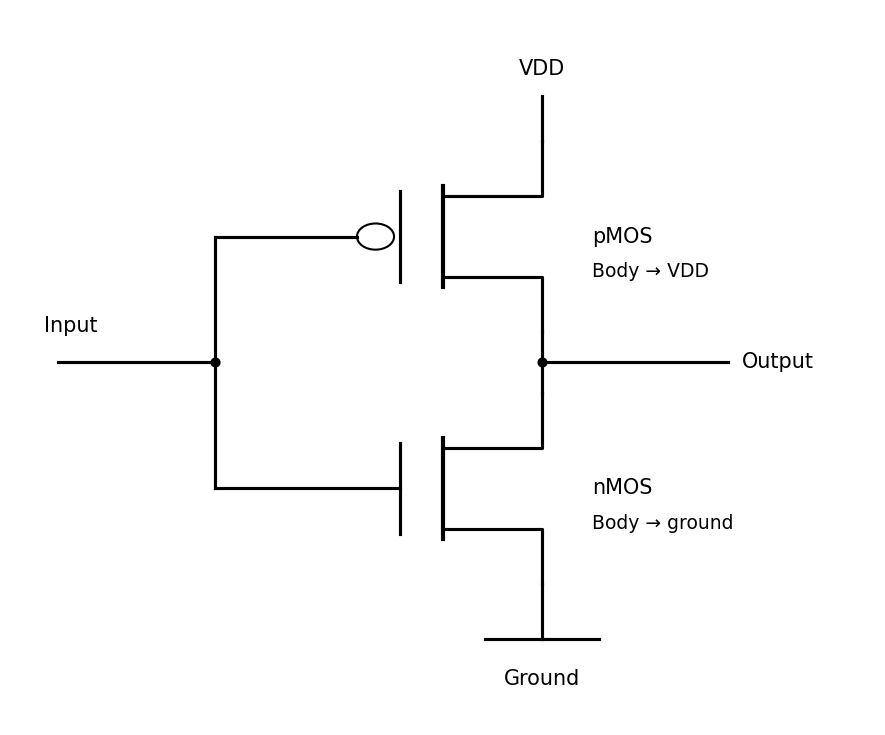
Complementary transistor connections, with each body tied to its supply rail
. Source. Details. 
A MOSFET is a voltage-controlled three-terminal switch: the insulated gate controls a conductive channel, giving high input impedance and useful current gain at the circuit level. A CMOS inverter actively restores either logic rail, has voltage gain near its switching threshold, and ideally draws no static supply current in either settled logic state. Real devices have leakage and consume energy while switching.
A single p-n junction is a two-terminal diode; its current is controlled by its own terminal voltage, so it does not by itself provide an independently controlled switch, gain and restoring inversion. Cross-coupled CMOS inverters form a bistable memory element. A lone inverter is not itself a complete memory cell, and a p-n junction can still serve useful rectification or capacitance functions.
Start with a lightly boron-doped p-type Si wafer. Define an implantation opening for the pMOS region using an oxide/nitride implantation mask, then implant donor ions, commonly phosphorus, at energies and doses giving the required well depth and concentration. An anneal activates donors and repairs damage; thermal drive-in can deepen and smooth the well profile. The donor concentration must exceed the original acceptor concentration in the well. Retain p-type material outside it for the nMOS device. Form a later n+ well contact to tie the n-well to the positive supply; the p+ substrate contact ties the substrate to ground. Diffusion from a donor source is an alternative to ion implantation and drive-in.
Clean the exposed silicon and grow a thin, high-quality SiO2 gate dielectric by controlled dry thermal oxidation. Deposit polycrystalline silicon, conventionally by low-pressure chemical vapour deposition from silane, dope it in situ or by subsequent implantation and activation, and pattern/etch it to define the two gates. Phosphorus or arsenic gives n+ polysilicon; boron gives p+ polysilicon where the selected gate-work-function process requires it. A traditional single-poly process may use a common gate doping instead; gate and source/drain doping need not be identical.
The patterned gates subsequently serve as self-alignment masks for donor-doped nMOS source/drain and acceptor-doped pMOS source/drain regions. Annealing activates these dopants. Keep the oxide thin and uniform enough for strong electrostatic control but free from pinholes and excessive leakage. A high-permittivity dielectric deposited by atomic layer deposition with a metal gate is a modern alternative, rather than the conventional polysilicon/SiO2 stack drawn.
A soap film has two air-water interfaces. The Young–Laplace equation therefore givesThe radius is half the specified diameter; using the single-interface droplet expression would miss a factor of two.
For the same ideal gas composition and temperature, , hence . The bubble volume is . The gas's mass in excess of displaced ambient air isThis is a positive buoyant mass, meaning a net downward weight after subtracting ordinary air buoyancy. It is not an upward lifting capacity. Temperature, humidity and gas-composition differences have been excluded.
Treat the two film surfaces as an effective interfacial tension . The relevant Bond number for the gas-density difference is . Substituting the Young–Laplace equation and the preceding density relation givesThus the formal crossover gives . This compares gravity on the excess gas with capillary restoration and neglects film weight. It does not say gravity-driven drainage of a real water film is negligible below kilometre scales. At this enormous radius, treating ambient pressure and density as uniform is itself no longer quantitatively reliable.
Approximating the skin as a uniform thin water shell with density ,This is about 2500 times the buoyant mass of the enclosed gas. The film weight therefore dominates the bubble's downward gravitational force under the stated assumptions. Equal-temperature air inside does not provide a net lift to balance it: an apparently floating bubble can be transiently supported by air currents or have different internal temperature/composition. Film thickness is generally nonuniform and changes with drainage and evaporation; the uniform thickness is an estimate, not a stable equilibrium condition.
For a spherical liquid droplet, the Kelvin equation isHere , soThe formal answer is about . At molecular dimensions, bulk surface tension, incompressible-liquid and continuum curvature assumptions are only approximate. There is one liquid-vapour interface here, unlike a soap bubble's two interfaces.
Under uniform geometric scaling, write . Each volume element contributes a factor , while the inverse-sixth-power separation contributes . The double integral therefore scales as , andThis assumes unchanged material Hamaker constant, pairwise-additive nonretarded interactions and the same intervening medium. It is a simultaneous scaling of both body sizes and their separation, not merely moving fixed bodies apart.
For nonretarded attraction between planar half-spaces, the interaction free energy per area is . The Derjaguin approximation gives , with for equal spheres. ThusThe force is , attractive. Scaling both radii and the gap by two gives , or attractive. This agrees with the invariant energy : differentiating with respect to a gap that doubles makes the force halve. The approximation requires and neglects roughness and retardation.
A lead-acid battery is suitable. Its positive electrode reduces PbO2 to PbSO4 and its negative electrode oxidizes Pb to PbSO4. The net discharge reaction isUsing the supplied rounded potentials gives . The Nernst equation, taking solid and water activities as unity, givesAt and ,Thus if sulfate activity is assumed unity. The pH alone does not specify sulfate activity, particularly where bisulfate formation and nonideal concentrated acid matter; without that assumption the numerical voltage is underdetermined.
For recharge, reverse both electrode reactions without irreversible loss of active material. Use porous, electronically connected Pb and PbO2 on acid-compatible conducting grids, with enough pore volume for PbSO4 formation and electrolyte transport. Fine, reversible sulfate deposits are desirable; coarse persistent crystals cause sulfation. The separator must remain acid-resistant, electronically insulating and permeable to electrolyte ions while preventing shorts; selective ion exchange is not intrinsically required. A compatible lead-alloy grid is preferable to assuming any metallic substrate survives the positive electrode's oxidizing acidic environment. Control current and charging voltage to limit hydrogen evolution, oxygen evolution, water loss, corrosion, heating and active-material shedding. Nickel hydroxide-based alkaline electrodes are poor choices in this acidic electrolyte because their phase stability and reaction conditions differ from those of their tabulated alkaline half-reactions.
An alkaline zinc-air battery combines a porous Zn negative electrode, aqueous KOH, an ion-permeable separator and a gas-diffusion positive electrode. At discharge, oxygen is reduced at the air electrode:Zinc oxidation can be written , followed by ZnO precipitation and hydroxide regeneration. The net reaction is .
High energy requires high accessible Zn loading and low inactive mass; high power requires short ion paths, good electronic conduction and a large catalytically active gas/electrolyte/electron interface. A porous hydrophobic gas-diffusion layer admits oxygen while controlling electrolyte flooding and drying. Zn morphology and electrolyte composition must avoid premature passivation, excessive corrosion and hydrogen evolution; atmospheric CO2 can carbonate the alkaline electrolyte. A very high loading can impair transport, so energy and power must be optimized together.
Electrical recharge is possible, but is not guaranteed by a primary Zn-air design. It requires reversible Zn deposition with controlled morphology and an oxygen electrode that can evolve oxygen efficiently without rapid catalyst or support corrosion. Dendrites, shape change, ZnO redistribution, gas evolution and large oxygen-reaction overpotentials limit cycling. Bifunctional oxygen catalysts, or separate oxygen-reduction and oxygen-evolution electrodes, help. Mechanical replacement of spent Zn is a different form of refuelling.[ref]
Phase-transition tailored nanoporous zinc metal electrodes by Liangyu Li and others. Demonstration of rechargeable alkaline Zn-air electrodes and transport/passivation limitations
Articles were limited to the first 100 out of 226 total.
Articles by others on the same topic
There are currently no matching articles.