2016 paper: Public original PDF, physical page 807. Student-answer availability for this paper remains unverified.
Original source: Cambridge FOI 2023/399 released PDF, physical pages 807–809.
Choose the baseline vector from the first antenna to the second. Apart from a sign convention for receiver delay, the geometric delay is , and the phase difference is . For equal received source powers , adding the voltages and averaging over many wave periods givesUncorrelated receiver noise adds a mean level but not the source's coherent cross term. For an east-west baseline and one choice of hour-angle sign, . Earth rotation therefore sweeps the phase; locally the fringe frequency is . Tracking the antenna pointing keeps the source in the primary beam. Electronic fringe stopping is a separate operation: it can remove this phase evolution, making a source at the phase centre constant in the corrected complex visibility. The oscillating power above is the geometrical fringe before that correction.
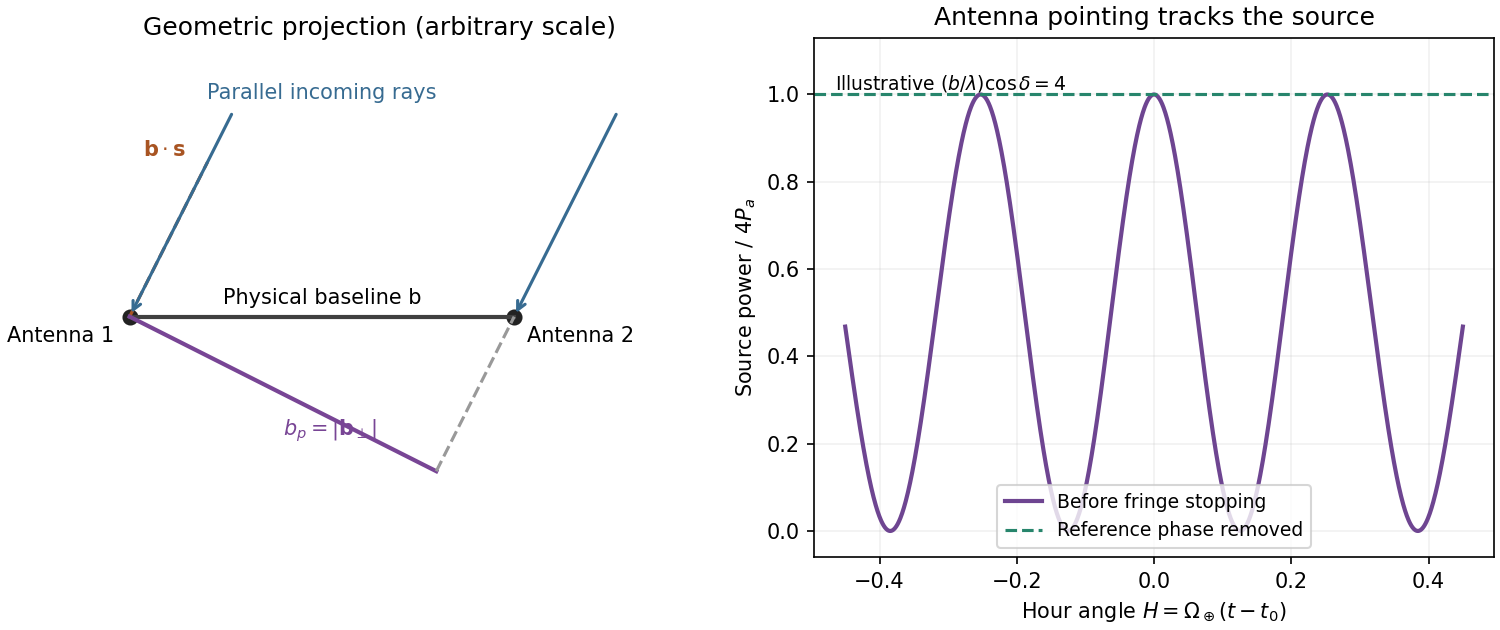
Projected interferometer baseline, geometric delay and illustrative fringes before electronic fringe stopping
. Details. For a small angular displacement along the projected baseline, . One full fringe therefore spans . Here . This is the angular period of the measured Fourier component and the characteristic resolution scale when such long baselines are synthesized; precise beam width and image ambiguity also depend on baseline coverage and weighting. A single pair by itself does not give an unambiguous complete image.
Writing , the expansion immediately gives the Rayleigh-Jeans law,The factor two counts the two independent modes of polarization of waves. A small brightness-temperature perturbation thus has in this limit.
Hot intracluster electrons inverse-Compton scatter the microwave-background photons. The scattering optical depth is and the characteristic thermal fractional energy transfer is of order . The integrated distortion is therefore controlled byScattering conserves photon number while shifting photons toward higher frequencies, giving a low-frequency decrement and a high-frequency increment. Thus the printed estimate correctly gives a negative change of order . Its numerical coefficient, however, is not the standard Rayleigh-Jeans coefficient. For nonrelativistic electrons and small , the Kompaneets equation gives . At small , , so andEquivalently the thermodynamic-temperature spectral factor is . The original PDF really prints the estimate with , not ; both numerical conventions are retained below. Relativistic corrections at the supplied are small compared with this factor-of-two difference.[ref]
Relativistic corrections to the Sunyaev-Zel'dovich effect by A. D. Challinor and A. N. Lasenby. abstract and Rayleigh-Jeans limit: the leading coefficient is minus twice the conventional Compton y parameter
The uniform cube has a constant line-of-sight depth . Using the supplied cross-section rather than replacing it with a more precise value givesAdopt , explicitly an external measured constant, not a temperature supplied in the question. The values , and set the physical units. Hence the printed relation gives ; the standard Rayleigh-Jeans result gives . Keeping the answer as , or twice that, avoids needing a numerical background temperature.[ref]
The Temperature of the Cosmic Microwave Background by Dale J. Fixsen. abstract, literature-combined temperature K; adopted value rounded only at the end
The face is a square, so its solid angle is , not the area of a circular six-arcminute aperture. At ,Thus using the printed estimate, or using the standard factor two. The sign denotes missing brightness relative to the surrounding microwave background. At this frequency ; the exact nonrelativistic spectral intensity differs from the strict Rayleigh-Jeans approximation by about one percent. This precision does not affect the estimates.
For the array noise, the system temperature sets the receiver noise scale; let be the effective area of each dish, and let describe correlation losses. No efficiencies or polarization of waves count are supplied, so first take and a single independent polarization of waves. An unpolarized point source produces antenna temperature , and the system-equivalent flux density is . The interferometric radiometer equation gives one baseline an rms flux error . There are cross-correlation baselines; averaging their independent thermal noise for a point source givesThe ideal single-dish effective area is , giving andCombining two independent parallel-hand polarization of waves measurements gives . Nonunit efficiencies increase these estimates by . Here signal equal to noise means a weak-source signal-to-noise ratio of one after integration; it does not mean equating the source to the entire unaveraged receiver-noise power.[ref]
Sensitivity by Joan Wrobel. 2004 Synthesis Imaging Summer School, slides 6–12 and 20: SEFD, independent baseline noise and single-polarization synthesis-image sensitivity
At the band centre, . Taking a representative maximum projected baseline of gives arcminutes. A corner-to-corner baseline of would give about arcminutes before projection and weighting. The exact antenna locations and source declination are not supplied, so neither a unique synthesized beam shape nor an exact FWHM is determined. The individual-dish primary-beam scale, roughly arcminutes, is the field of view, not the synthesized resolution.
To extract the cluster signal, retain frequency-resolved complex visibilities and fit an extended SZ template together with contaminating compact sources. For the ideal uniform square centred at the phase centre and with a nearly constant primary beam across it, the Fourier transform isThis is why the integrated decrement must not be treated as a point-source flux on every baseline. The first axial visibility null occurs at . Short baselines carry most of the large-scale decrement; the longest baselines are useful for separating unresolved positive radio sources. natural visibility weighting or a suitable taper gives a clearer extended-source image than emphasizing the longest baselines, while a visibility-domain matched filter uses all samples with weights proportional to template amplitude divided by noise variance. Its amplitude estimate is for a real template amplitude. A joint fit propagates radio-source uncertainty instead of subtracting exact, noise-free source models.
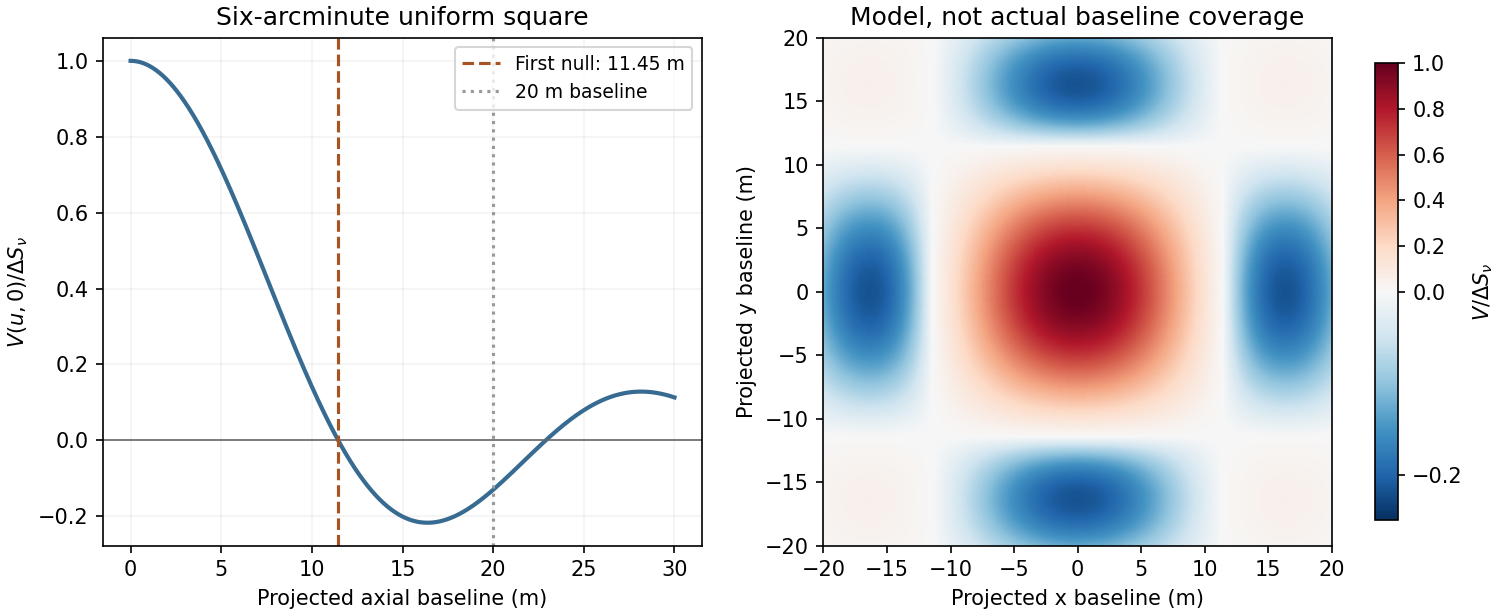
Normalized visibilities of the six-arcminute square cluster and their suppression on long baselines
. Details. Earth-rotation and multifrequency synthesis improve Fourier coverage, but each channel must use its own baseline in wavelengths, primary beam and SZ spectrum. Use the longer baselines and spectra to identify variable point sources, flag bad data, and test the decrement with time, antenna and frequency splits. Primary-beam and absolute-flux calibration must be included. Large-scale microwave-background fluctuations and residual ground or atmospheric signals can remain even below the thermal-noise estimate. The narrow low-frequency band alone gives limited separation of SZ and primary microwave-background temperature structure. There is no zero-spacing interferometric datum: integrated flux is model dependent unless sufficiently short baselines or additional total-power information are available. Exact cluster detection significance cannot be obtained from the point-source noise alone without the actual projected baseline distribution and weighting.
For data , parameters and model , conditional probability givesThe likelihood describes the measurement process, the prior encodes parameter information before these data, and the Bayesian evidence normalizes the posterior. A prior is a probability density with respect to a specified measure; a uniform prior in distance is not uniform in parallax. Bayes' theorem combines conditional probabilities and does not itself select an appropriate likelihood or prior.
An astronomical application starts with a forward model. For measured fluxes with predictions and known Gaussian covariance , . Correlated calibration errors belong in or in explicit calibration nuisance parameters; assuming every filter or epoch is independent can give falsely narrow uncertainties. For a faint photon-counting source, the more appropriate likelihood can instead be , with nonnegative expected source and background counts. Background measurements constrain , which is then marginalized rather than set to an exact subtracted number. The observed background-subtracted count can be negative even though the physical expected source count is nonnegative.
For a simple flux example with and a Gaussian calibration prior , completing the square givesThis explicitly shows how independent information combines. A physical nonnegative-flux prior would truncate or replace that illustrative Gaussian prior. Photometric-redshift fitting similarly compares predicted galaxy colours with measured fluxes, then integrates over luminosity, dust and other nuisance parameters to obtain . Multimodal posteriors should be retained when different spectral features produce similar colours; a best fit alone hides that ambiguity. The same framework applies to orbit parameters, stellar temperatures, cosmological parameters and cluster SZ amplitudes.
credible intervals state posterior probability conditional on the model and prior. posterior predictive checks compare replicated observations with the data and can reveal a deficient noise or source model. Sensitivity to plausible priors is especially important for weak signals and inverse problems. For competing models, posterior odds equal prior odds times the Bayes factor ; the evidence averages fit quality over the prior volume and therefore depends on proper, physically justified prior ranges. Detection thresholds and catalogue selection must enter the sampling model when inferring a population, otherwise a carefully calculated posterior can still describe a biased sample. The practical gain is a joint uncertainty distribution with nuisance parameters propagated, not merely a single fitted number.
Atmospheric refractive-index fluctuations impose a changing phase screen on the pupil. For a telescope much larger than the Fried parameter , long-exposure resolution is approximately , rather than the diffraction scale . The scaling makes the seeing width proportional to for fixed turbulence. An atmospheric coherence time sets the exposure or correction cadence needed to freeze the phase, while the isoplanatic angle sets the useful angular separation from a reference source. These are atmospheric quantities, not improvements automatically supplied by a larger mirror.
First reduce avoidable turbulence: choose a good high site, control mirror and enclosure temperatures, ventilate the dome, and observe when the line of sight crosses less turbulent air. Guiding removes telescope drift, and a fast tip-tilt correction removes image motion. Slow active optics corrects mirror figure and alignment; it cannot by itself follow all atmospheric phase fluctuations. These measures improve the input wavefront but do not guarantee diffraction-limited performance.
In adaptive optics, a wavefront sensor measures the reference-star wavefront, a reconstructor estimates its aberration, and a fast control loop commands a deformable mirror and tip-tilt element. A Shack-Hartmann sensor obtains local slopes from the displacement of focused lenslet spots. The science beam receives the corresponding optical-path correction. Residual phase variance limits the Strehl ratio approximately as when the residual is small. Enough corrected spatial modes, adequate reference photons and a response faster than atmospheric changes are all needed. infrared correction is easier because a given path error has smaller phase in radians and the atmospheric coherence length is larger. A faint or distant guide star leaves larger errors and a core-plus-halo point spread function. The NACO manual documents these reference-star and anisoplanatic limitations.[ref]
NACO User Manual by European Southern Observatory. §§3.1–3.2, printed p.13; §4.3, printed p.19: atmospheric coherence, real-time correction and anisoplanatism
A laser guide star supplies a wavefront reference in fields lacking a bright suitable star, but a finite-altitude beacon samples a cone rather than the full stellar cylinder. It also does not by itself supply the absolute celestial tip-tilt reference; a natural source is still required for that measurement. Multiple guide stars and conjugate correction planes can improve wider-field compensation, with greater hardware and reconstruction demands. The point spread function can vary across the field and with time, so reference stars and telemetry are needed to calibrate astrometry and photometry; a sharper image alone is not a guarantee of accurate science.[ref]
Adaptive Optics by European Southern Observatory. Laser guide stars: artificial reference sources, limited sky coverage and retained natural-star requirements
Short-exposure methods provide another route. Exposures shorter than the atmospheric coherence time freeze speckle patterns. speckle interferometry uses calibrated Fourier statistics of many frames to recover diffraction-scale information; phase information requires methods such as bispectrum reconstruction, not just averaging the blurred frames. lucky imaging selects the best short frames, registers them and combines them. It sacrifices photons through selection and can be read-noise limited for faint targets, so it is most effective with enough reference photons. Ordinary shift-and-add mainly corrects motion; it does not remove every high-order phase error. Deconvolution using a measured point spread function can recover supported structure but amplifies noise and cannot reliably invent spatial frequencies absent from the observations. Good-site engineering, fast wavefront correction and short-exposure reconstruction address different limitations and can be combined.
An electron accelerated in an ion's Coulomb field emits bremsstrahlung. Both electron states are unbound, giving free-free radiation rather than a discrete bound-state line. Averaging over a Maxwellian electron distribution gives an optically thin spectral emissivity with dependenceHere depends on the emissivity convention, and the Gaunt factor supplies the quantum correction. No numerical emissivity normalization is needed for these diagnostics. For a mixture, sum over ion species. The bolometric emissivity is proportional to with a frequency-averaged Gaunt factor. Thermal electron speeds control the spectrum while the encounter rate supplies its density-squared dependence.
temperature can be measured from the high-energy exponential cutoff at photon energy of order , provided the spectrum spans that turnover and foreground absorption and nonthermal contamination are modelled. At radio frequencies , the exponential is nearly one, so the optically thin continuum is a poor thermometer by slope alone. Kirchhoff's law, , and the Rayleigh-Jeans law give for an isothermal thermal plasma. The transfer solution isin the radio limit. A resolved optically thick region therefore measures its electron temperature through brightness temperature, if it fills the beam. The turnover between thick and thin emission constrains the line-of-sight emission measure for a hydrogen-dominated fully ionized plasma. In the thin regime , rather than . The slowly varying Gaunt factor gives a nearly flat optically thin radio flux-density spectrum, in contrast to the thick limit at fixed projected area.[ref]
Essential Radio Astronomy by James J. Condon and Scott M. Ransom. chapter 4, §4.3, especially equations (4.57)–(4.58): emission measure, absorption and optically thick/thin diagnostics
To obtain density, one also needs geometry. An angular extent and independent distance give a transverse size; an assumed shape provides a depth or volume. For approximately uniform emitting gas with astrophysical volume filling factor , , so . Alternatively a measured column emission measure and assumed path length give an rms density. Clumping raises the mean squared density relative to the square of the mean: the inferred value is not automatically the mean gas density. Free-free brightness alone does not uniquely determine temperature, density and physical size. Resolved imaging, a distance, optical-depth information or an independent column-density diagnostic is needed to remove those degeneracies. Cluster SZ data are complementary because their leading signal depends on , whereas free-free emission depends on density squared. Metal lines, unresolved temperature structure, foreground absorption, synchrotron emission and background subtraction must be controlled before attributing the continuum to a single thermal component.
Type Ia supernovae are standardizable candles. Repeated multiband photometry measures peak apparent magnitude, light-curve width and colour; spectra identify the supernova class and determine redshift, often from the host galaxy. Nearby objects calibrate the relation between light-curve shape, colour and absolute luminosity. Applying those relations produces a corrected apparent magnitude , not an assumption that every event has identical luminosity. The distance modulus then givesA common uncertainty in is degenerate with the absolute distance scale, but does not erase the redshift-dependent shape of the Hubble diagram.
luminosity distance probes the expansion history. In a spatially flat model,For fixed low-redshift calibration, a negative increases the second-order distance relative to a decelerating model. Objects at a given redshift are therefore fainter. A Hubble diagram spanning enough redshift can distinguish this curvature from the common magnitude intercept. In matter-plus-cosmological-constant models, ; fitting the distances can test whether . The two original supernova teams found distances supporting an accelerating expansion in that framework.[ref]
Observational Evidence from Supernovae for an Accelerating Universe and a Cosmological Constant by Adam Riess and others. abstract and cosmological interpretation of standardized supernova luminosity distances
[ref]Measurements of Omega and Lambda from 42 High-Redshift Supernovae by Saul Perlmutter and others. abstract; cosmological likelihood constraints and tests of systematic uncertainty
The comparison requires matched rest-frame passbands and K corrections, correction for redshift time dilation in the light curves, a common photometric calibration, and explicit uncertainty propagation. Dust extinction can imitate dimming; multicolour and infrared observations test reddening and the adopted extinction law. Evolution in the progenitor population or host-galaxy dependence can alter standardization, so one compares matched populations and fits host-dependent terms where warranted. Flux-limited discovery introduces Malmquist bias and other selection effects, which must be modelled through the survey detection efficiency. peculiar velocities matter at low redshift, while gravitational lensing and intrinsic scatter broaden the distant sample. Classification and outlier tests reduce contamination by other transient types.
Independent data reductions, nearby anchors, spectroscopic checks and a fit over the full redshift range distinguish an expansion-history signal from one instrumental offset. Complementary cosmological observations help separate matter density, curvature and dark-energy parameters. The acceleration inference comes from the relative distance-redshift relation, conditional on standardization and an expansion model. Distant supernovae integrate the past expansion history; they do not directly measure the instantaneous second time derivative of today's scale factor without such modelling.
In a CCD, absorbed optical photons create photoelectrons collected in electrostatic wells beneath gate electrodes. During readout, clock voltages move the charge packets row by row into a serial register; serial clocks move them one pixel at a time to an output node. The node converts charge to a voltage, approximately , which is amplified and digitized. pixel addresses are recovered from the row and serial-clock sequence. Resetting and sampling the output between packets establishes the baseline. Efficient transfer preserves charge; trapping or incomplete transfer produces loss and trailing. This is CCD clocked charge transfer, not independent wiring of an amplifier to every imaging pixel.[ref]
ASCA Technical Description: SIS by NASA HEASARC. §7, SIS: charge generation, electrode-clock transfer and preamplifier readout
dark current is thermally generated charge accumulated even without illumination. If its mean rate is electrons per pixel per second, a single exposure adds mean and Poisson variance . Cooling the detector and using low-defect material suppresses this generation. A dark calibration removes the reproducible mean pattern, but cannot remove the dark electrons' random shot noise in the science exposure. read noise comes from measuring the output packet and resetting the sense node, amplifiers and electronics; write its rms as electrons per read. correlated double sampling reduces reset and correlated offsets by subtracting the baseline measurement from the signal measurement. Low-noise electronics and an appropriate slower readout reduce the remaining contribution. The CCD noise budget for separate exposures combined over total time contains independent dark and read contributions , not . Long exposures reduce repeated read noise, but saturation, cosmic rays and tracking requirements constrain the exposure length. On-chip binning can reduce read-noise penalties for a fixed binned area at the cost of angular sampling.
For the source and sky calculation, define the count conversion factor and the source flux per pixel . The ideal source and background electron counts are and . These assume unit throughput and quantum efficiency, approximately constant quantities across the band and a well-determined mean sky level from many background pixels. Source and sky photons have independent Poisson fluctuations, so the variance after subtracting that mean sky is . Subtracting a background removes its mean, not its photon noise. ThereforeThus the required expression follows directly from adding photon-count variances. Finite sky-estimation noise, dark current and read noise would add further variance. A nonunit common efficiency replaces by the effective collecting area; a nonflat spectrum requires the corresponding frequency integral. For example, estimating the sky from one equally exposed background pixel would add an extra , whereas a large sky region makes that extra term small.
With and the supplied photon frequency, the sky flux per pixel is . Multiplying arcsecond-squared pixel area by brightness per arcsecond squared already gives a flux: no additional steradian conversion belongs in this product. Rearranging givesUsing yields
The first case is mainly source-shot-noise limited, while the last is strongly sky limited. At high source brightness ; at low source brightness it approaches . Reducing source flux by ten can therefore require nearly a hundred times the exposure once sky noise dominates. These are per-pixel values for the ideal model, not guaranteed integration times including calibration, cosmic rays or read noise.
Increasing the diameter increases both source and sky photon rates as for fixed angular pixels. In this ideal limit the required exposure decreases as , whereas the stated telescope cost increases as : collecting area grows only as cost to the power . A larger ground telescope does not remove atmospheric photons or recover arbitrary wavefront information lost in a long seeing-limited exposure. Space observations avoid atmospheric airglow, weather and atmospheric turbulence, and offer stable high-resolution imaging and access to very faint structure. They still have zodiacal light, instrumental backgrounds and their own calibration limits. adaptive optics can provide excellent ground-based resolution in suitable fields, but its guide-star, wavelength and field-dependent limitations do not remove the need for space-based continuum imaging. The need is for complementary low-background, stable and high-resolution measurements; the cost exponent alone is not a proof that every imaging programme is cheaper in space.
For X rays, one fully absorbed photon produces many electron-hole pairs in silicon, rather than one optical photoelectron count. At moderate surface brightness, the probability of two photons landing in the same event island during one CCD frame is small. The charge packet or sum over neighbouring split-event pixels then supplies a pulse height for each photon, while its pixel position supplies the image coordinate. Calibrating pulse height against energy produces an event list from which a spectrum can be accumulated for any spatial region. photon pile-up at larger occupancies merges photon energies and corrupts both spectra and event grades, so fast enough frames and event-pattern screening are essential.[ref]
ASCA Technical Description: SIS by NASA HEASARC. §7, SIS: silicon electron-hole yield, charge collection and imaging spectroscopy
A measured silicon pair-creation energy gives electrons for a photon. Let be the Fano factor of pair production, the number of independently read pixels in the event sum, and the rms read noise per pixel. ThenThe Fano-limited X-ray CCD energy resolution using the representative silicon value gives an ideal Fano-limited at , or resolving power . Finite read noise, charge loss and event summing broaden this; an order-of-magnitude practical estimate is a few tenths of a keV, but the particular detector's value is not determined by the given optical-pixel parameters. These and values are external detector properties, not supplied question data. Treating every pair as independent Poisson production instead would give rms, or FWHM; stating which width is meant avoids conflating those estimates. Radiation-induced charge-transfer inefficiency requires additional gain and spectral-response calibration.[ref]
The ASCA Data Reduction Guide by NASA HEASARC. §4.7, non-uniform CTI: silicon yield, Fano factor near 0.12 and FWHM resolution formula
Within-model inference. The data are the measurements, specifies a statistical model including its sampling assumptions, and is its unknown parameter or parameter vector. The posterior describes parameter uncertainty after the observation. The likelihood describes how that observed data set depends on a proposed parameter. The parameter prior encodes information before these data. The evidence is the prior predictive probability density of the data and normalizes the posterior:For continuous observations the likelihood and evidence are densities in data space, rather than probabilities of one exact observation. The evidence compares different models only when they use the same data and reference measure.
Uniform parameter priors. Normalize each model's top-hat prior, so inside its allowed interval and zero elsewhere. ThenThus evidence is the average likelihood over the allowed parameter range, not its maximum and not the unnormalized area alone. Interpret the supplied measured distribution as proportional to a common likelihood, , where the common constant cancels in model comparisons. If that distribution were instead a posterior calculated using a nonuniform reference prior, it would first need to be divided by that prior. No such alternative prior is specified here.
Evidence calculation. Put . The three integrals, divided by the same , areConsequently the three pairwise Bayes factors may be given asB has the largest evidence. Model A is narrow but lies away from the likelihood peak. Model C contains that peak but spreads much of its normalized prior over less well-fitting values. Model B concentrates its parameter prior near the peak and achieves the best average. Width is therefore not a universal penalty by itself: changing an interval can also improve its location. At fixed centre near a localized likelihood peak, extending the interval into poorly fitting values dilutes the evidence.
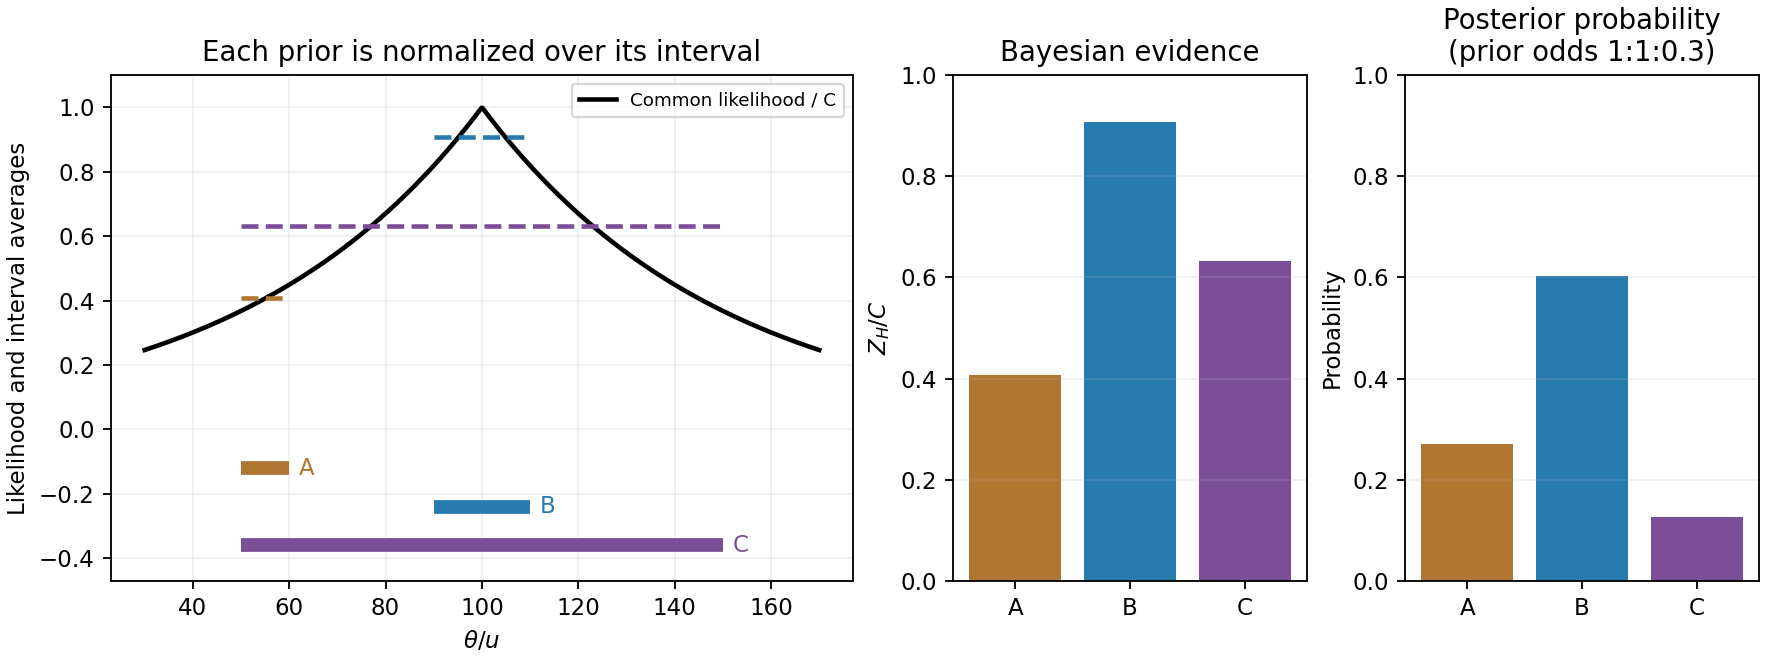
Original likelihood averages over the three top-hat prior intervals; bars show evidence and separately prior-weighted model probabilities
. Details. Between-model prior information. The supplied are model prior odds, distinct from each model's uniform parameter prior. They multiply the evidences to give posterior model weights. The corresponding posterior odds areNormalizing these weights gives , and . B is preferred with either equal model priors or the stated theoretical prior odds. Multiplying by changes posterior odds; it does not redefine the Bayes factors.
Euclidean luminosity selection. In a flux-limited catalogue, a source with isotropic luminosity is detected out toA homogeneous Euclidean population with intrinsic luminosity function is sampled approximately as . Brighter objects occupy a much larger accessible volume and are overrepresented; at a fixed large distance the faint tail is missing entirely. This is Malmquist bias. Using the selected population as if it were representative can bias luminosity calibrations or inferred correlations with . A selection function, a volume-limited sample, or appropriate accessible-volume weighting can address the sampling effect, subject to completeness assumptions.
The Euclidean derivation concerns flux-limited luminous objects or selected tracers associated with the structures. A CMB temperature map is a diffuse surface-brightness field on a cosmological last-scattering surface: it is not automatically a Euclidean catalogue of identical inverse-square point sources. For a particular CMB-structure catalogue, its actual detection statistic and selection function must be specified before applying this luminosity-weighting law quantitatively.
Delay-compensated geometry. Choose an east-west baseline vector and let the upward unit vector be . A ray direction at zenith angle in their plane has . Its signed geometric path difference is . Removing the phase-centre delay leaves the residual pathWith the receiver ordering chosen to give positive phase for this path, a complex correlator measuresThe reverse ordering complex-conjugates the expression without changing its information. A single real multiplier supplies its cosine component; the stated exponential represents an in-phase/quadrature correlator. Equal cable lengths to the central correlator remove a fixed instrumental difference but do not remove the changing geometric delay. Pointing the antennas and electronically compensating the path are separate operations.
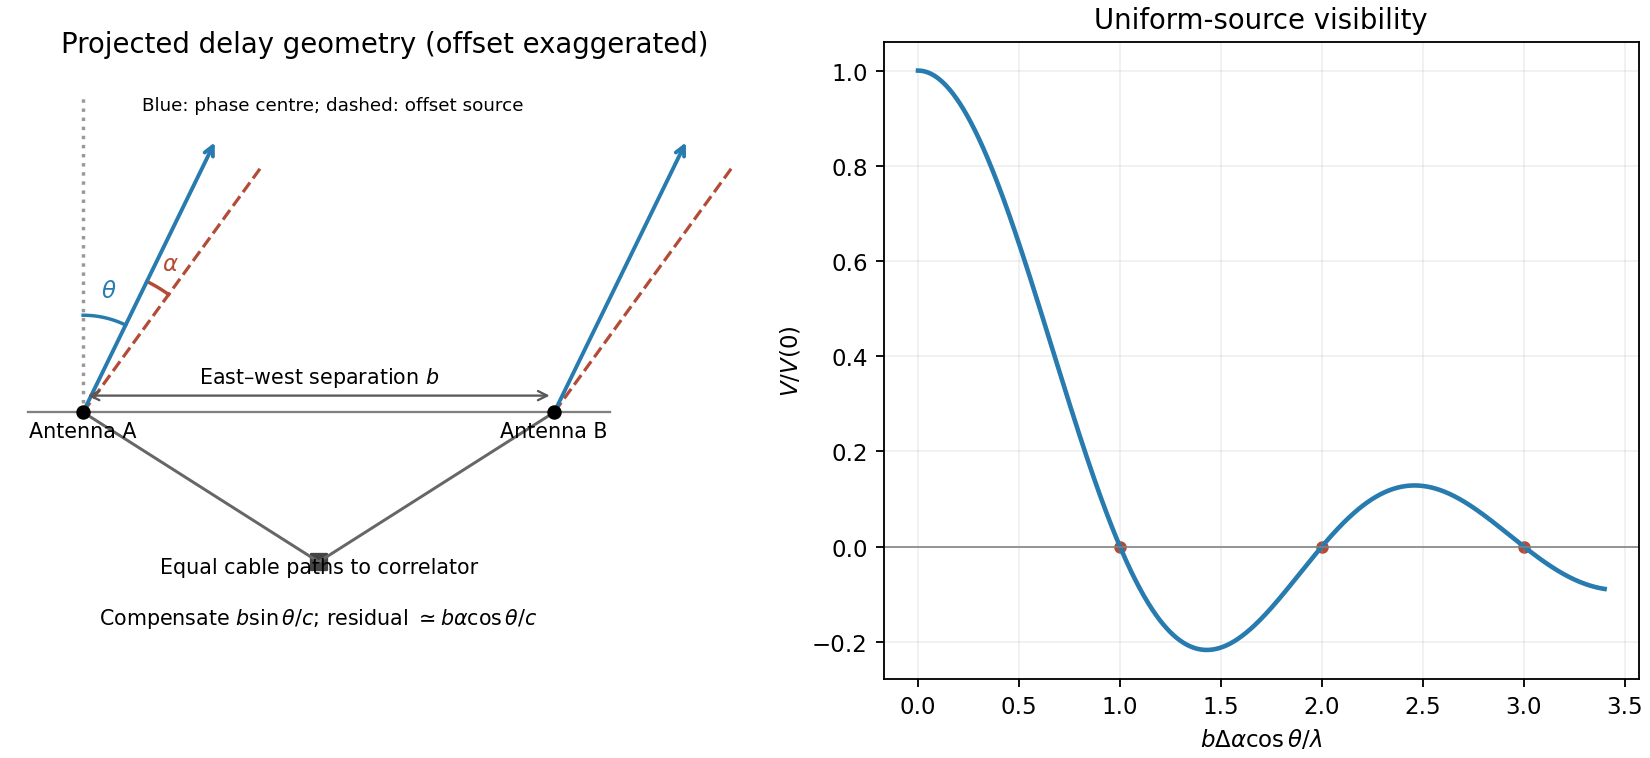
Original east-west interferometer geometry and normalized visibility of a centred one-dimensional uniform source
. Details. Resolved uniform source. Contributions from mutually incoherent sky elements add as brightness-weighted complex visibilities. Put over and zero elsewhere, and define . Integrating givesThereforeThe zero-argument value is defined by continuity as one. Normalization by isolates the visibility shape from total flux. The first null occurs when the source spans one fringe period, . A negative real visibility beyond a null is a phase reversal, not negative surface brightness.
Path-compensation precision. A finite observing band sets a coherence envelope. For a rectangular band of width , an uncorrected residual delay multiplies the correlation byCoarse delay steps must leave if decorrelation is to be small. Thus a coarse path-step scale must be well below the coherence length , with the precise bound determined by the tolerated amplitude loss and maximum quantization residual. A digital fine-delay or phase-rotation system can separately correct the central-frequency phase.
If there is no such carrier-phase correction, the steps must also be a small fraction of to avoid large untracked phase jumps or time-averaging loss. For a step rounded to the nearest setting, and the maximum carrier-phase error is . Bandwidth controls coarse group-delay decorrelation; wavelength controls the precision of untracked carrier phase. No numerical delay step can be inferred from the central frequency alone without a bandwidth, loss tolerance and compensation architecture. Earth rotation additionally sets how rapidly the delay setting must be updated.
Largest sampled angular scale. For a near-zenith view take the shortest projected baseline as . At , . The inverse shortest spatial frequency givesThis is an order-of-magnitude largest fringe scale. A convention defining maximum recoverable source size as would instead give about arcminutes; source profile, weighting and projected baseline coverage determine the operational value. The antenna diameter and primary beam can further restrict the usable field but were explicitly neglected in the source's initial idealization. Ten antennas supply pairwise baselines; their number improves sampling and sensitivity, not the inverse-shortest-baseline scale by a factor of ten. The longest baseline is not supplied, so the finest synthesized resolution is not numerically fixed.
A suitable observing programme. A compact centimetre-wave array is well suited to CMB temperature anisotropy on degree to sub-degree scales sampled by its baselines, and, with sufficiently long baselines and suitable foreground control, thermal Sunyaev-Zeldovich structure in galaxy clusters. At the thermal Sunyaev-Zeldovich signal is a decrement relative to the CMB. The compact baselines retain sensitivity to extended brightness features; the spatial frequencies measured by each baseline have a direct statistical interpretation in CMB analysis.
Compared with lower radio frequencies, synchrotron foregrounds are generally reduced, while thermal dust rises toward higher frequencies; observing near this centimetre-wave atmospheric window is therefore useful, although foregrounds are not absent. Correlation and phase switching reject mean uncorrelated receiver offsets and some instrumental drifts. Receiver thermal noise still contributes variance, and atmosphere, ground pickup or cross-talk can be correlated and require control. Additional long baselines can identify compact radio-source contaminants for subtraction, but the question does not specify enough array geometry to guarantee that capability. There is no zero baseline in ordinary pairwise cross-correlation, so the array does not directly measure the sky monopole or arbitrary larger-scale smooth emission.
Stellar reflex motion. A planet and its host orbit their common barycentre. The star's line-of-sight velocity shifts its absorption lines by at low speeds. A time series can be fitted withHere is true anomaly, the argument of periastron and an arbitrary systemic velocity offset. At small companion mass and known stellar mass, the orbit supplies , not the true planet mass without an inclination constraint. Long monitoring helps distinguish a reproducible Keplerian signal from stellar oscillations, magnetic activity, spots and instrumental trends.
The Lick reference-cell implementation. Starlight passes through a temperature-controlled cell of molecular iodine before entering the Hamilton high-resolution echelle spectrograph. The cell imprints a dense pattern of reference absorption lines on the stellar spectrum, predominantly in the approximately – interval. These lines share the same exposure and downstream optical path as the stellar light. A calibrated high-resolution Fourier-transform iodine spectrum and an iodine-free stellar template allow the wavelength solution and instrumental line-spread function to be fitted along with the stellar Doppler shift. The method corrects shifts and line-shape changes that a separate calibration exposure would not necessarily follow.[ref]
Precision Radial Velocities with an Iodine Absorption Cell by Geoffrey W. Marcy and R. Paul Butler. Marcy and Butler (1992), sections 3–4, printed pages 271–274: Hamilton setup, iodine wavelength interval, templates and in-situ instrumental profile
A useful forward model for one short spectral segment isfollowed by pixel integration, continuum scaling and a fitted wavelength calibration. Here is the intrinsic stellar spectrum, the cell transmission and the instrumental line-spread function. The spectra multiply before convolution; simply dividing a recorded blended spectrum by the laboratory iodine spectrum is not equivalent to this model. The iodine pattern is stationary in the observatory frame while stellar lines move relative to it. Separate spectral segments accommodate wavelength dependence of the instrumental profile.
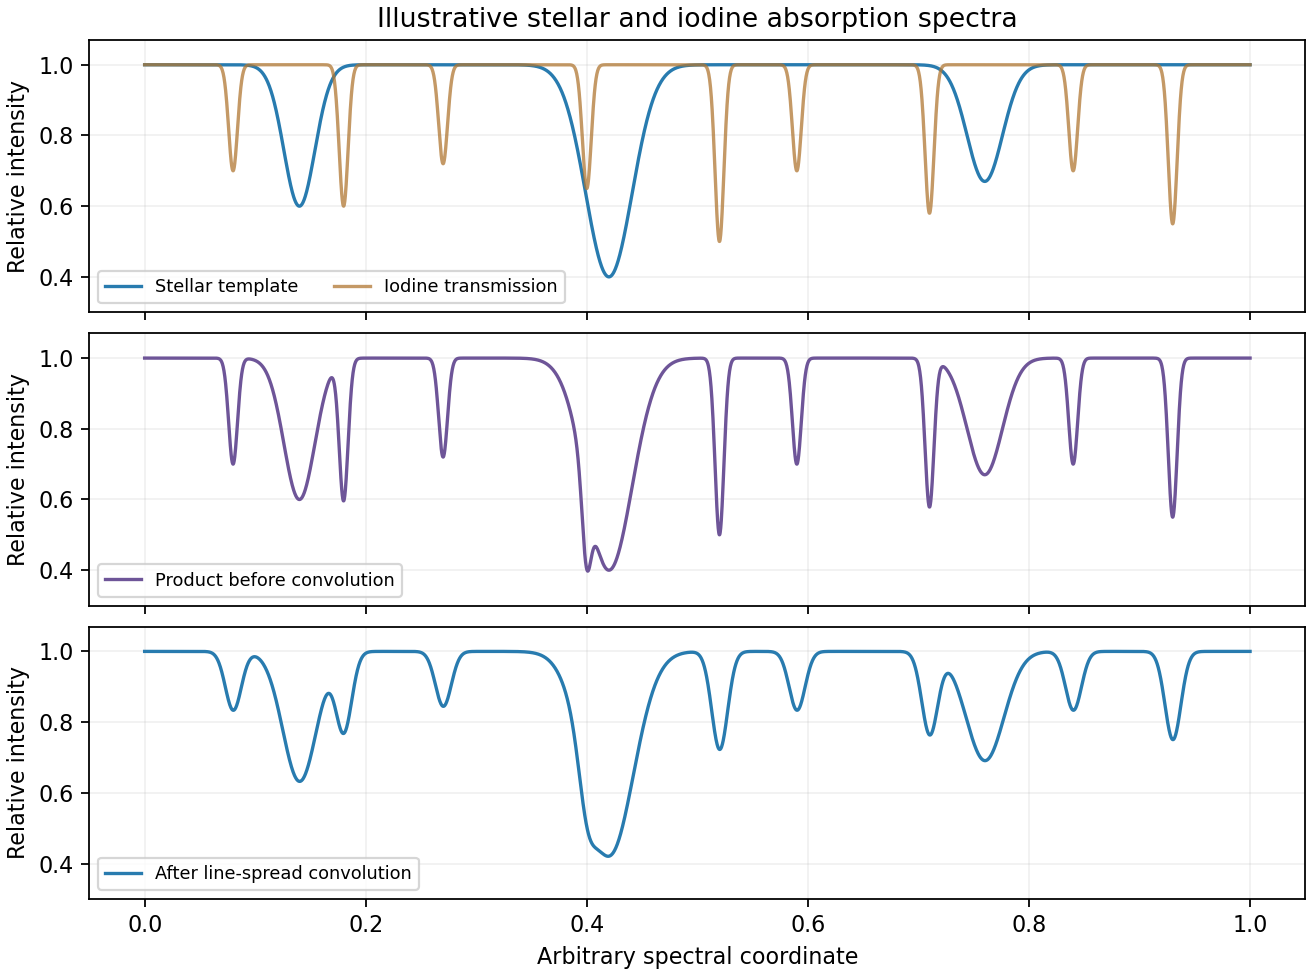
Original synthetic iodine-cell forward model showing multiplication before instrumental convolution; all line positions and strengths are illustrative
. Details. Earth's rotational and orbital velocities must then be removed with a barycentric correction using accurate timing, ideally weighted by photon arrival rate. Many stellar lines constrain a shift smaller than one instrumental resolution element; spectral resolution alone is not the velocity error. Photon statistics, template quality, instrumental-profile modelling and intrinsic stellar variability limit the precision. The method measures changes relative to a template and does not by itself provide a perfectly absolute centre-of-mass velocity. No particular discovery, modern precision floor or historical observing performance is assumed here.
Atmospheric turbulence produces time-dependent refractive-index fluctuations and phase errors across the telescope pupil. A large aperture's long-exposure point spread function is broadened approximately to , where is the Fried parameter, rather than the diffraction scale . For fixed turbulence, , so the seeing angle improves weakly as . The atmospheric coherence time scales with divided by an effective wind speed. This temporal scale concerns changing turbulence, not the optical bandwidth's coherence time.
Reduce the disturbance. A good high-altitude site, favourable weather, observing near the zenith, thermal control and dome ventilation reduce atmospheric and local seeing. They improve the uncorrected image but do not remove all high-order wavefront distortion. Active optics slowly maintains the main mirror's figure and alignment; it is distinct from the rapid adaptive correction of atmospheric phase errors.
Correct the wavefront. Adaptive optics uses a nearby natural guide star or artificial laser guide star, a wavefront sensor, a real-time controller and a deformable mirror. A Shack-Hartmann sensor estimates local wavefront slopes; mirror actuators apply the opposite optical-path distortion fast enough to track the atmosphere. A separate fast steering element or the mirror can correct image motion. In an ideal well-corrected direction this approaches diffraction-limited resolution and increases the concentration of light in the central image.
Finite guide-star flux, actuator sampling, control latency and anisoplanatism leave residual errors. A laser beacon samples a finite-height cone rather than the full distant-source cylinder, and a conventional laser reference does not determine absolute tip-tilt, so a natural reference remains useful. Multiple guide stars and multiple conjugate mirrors can widen the corrected field, with extra sensing and reconstruction complexity. These are fundamental geometry and control limits, not claims of a universal corrected sky fraction.[ref]
Adaptive Optics by European Southern Observatory. Single Conjugate Adaptive Optics and Multi-Conjugate Adaptive Optics sections: bandwidth, fitting, anisoplanatism, laser-beacon tilt and cone limitations
Freeze and reconstruct. Short exposures can freeze the instantaneous speckle pattern. Speckle interferometry uses calibrated Fourier statistics to recover diffraction-scale structure; power-spectrum information alone loses phase, while bispectrum or other phase-sensitive measurements support image reconstruction. Lucky imaging selects sharp short frames, registers them and combines them, trading photon efficiency for improved image quality. Tip-tilt alignment alone removes image motion rather than all high-order aberration. These methods require sufficiently bright sources or references and can incur substantial read-noise penalties. Deconvolving a long-exposure image is useful only where a known point spread function and adequate signal preserve information; it cannot recover arbitrarily lost spatial frequencies. Moving to space avoids atmospheric seeing, although it changes the observing platform and its limitations rather than correcting a ground-based telescope.
Weak transitions in dilute gas. A forbidden emission line is a transition absent in the electric-dipole approximation because of its selection rules, but permitted through weaker channels such as magnetic-dipole or electric-quadrupole radiation, sometimes aided by state mixing. It is not an impossible transition. Its upper atomic level is relatively long lived, so collisions can deactivate it before a photon is emitted in dense gas. Low-density astrophysical plasmas allow radiative decay to compete successfully.
In a schematic two-level statistical equilibrium,The critical density is for this simple level system; multiple radiative and collisional channels require summed rates. At each collisional excitation is likely to produce radiation, so . At high density collisional de-excitation suppresses the line relative to this low-density expectation. The rate need not decrease absolutely with increasing density; the suppression is relative to the naive excitation scaling.
A temperature-sensitive ratio. For a Maxwell-Boltzmann electron distribution,where is an effective collision strength. Lines from upper levels with different excitation energies therefore have a strongly temperature-dependent ratio. Using one ion reduces sensitivity to abundance and ionization fraction compared with comparing unrelated species.
A standard example is doubly ionized oxygen: the and angstrom lines descend from toward the ground term, while the angstrom line connects to . The higher excitation threshold makes the auroral line relatively stronger in hotter gas. In the low-density Maxwellian approximation, with slowly varying collision strengths,The numerical form is a useful approximation, not a universal exact atomic law; a multilevel atomic calculation with current collision strengths is needed for precise work.[ref]
Resolving the electron temperature discrepancies in H II regions and planetary nebulae: kappa-distributed electrons by David C. Nicholls and others. Section 4, equation 18 and the following approximation warning; arXiv:1204.3880v2, PDF pages 5–6
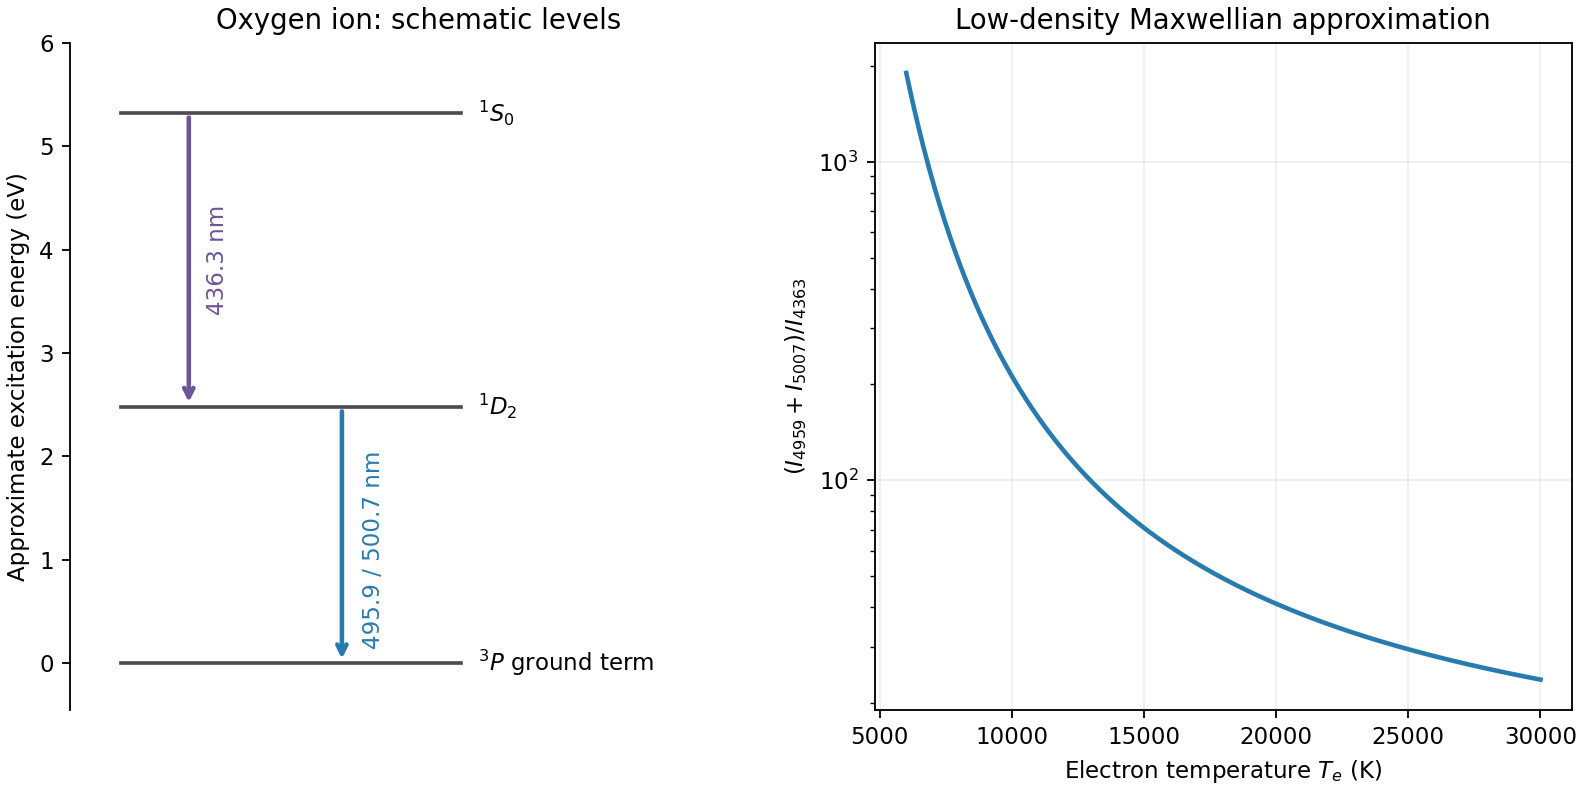
Original oxygen forbidden-line level schematic and low-density Maxwellian temperature-ratio curve; level spacings are approximate
. Details. In an active galactic nucleus these lines commonly diagnose the relatively dilute narrow-line gas; dense broad-line gas can collisionally quench them. Measure and deblend the fluxes, subtract continuum and stellar features, correct differential extinction, and check density independently. The ratio mainly tests radiative branching and calibration because both lines share one upper level; it is not the required temperature thermometer. Temperature gradients, multiple density components, shocks, ionization structure and departures from the Maxwellian electron distribution can bias a single inferred temperature. Without a measured ratio and density regime, no particular AGN temperature is numerically determined here.
Measure counts in electrons so that photon and detector noise can be combined directly. For source electrons , aperture pixels, total time , sky rate per pixel, dark-current rate per pixel, reads with rms read noise per pixel, and an independently estimated mean background per pixel of variance , an ideal aperture-sum budget isThe last term represents the propagated calibration uncertainty if it can be treated as a random variance; systematic residuals can instead bias the measurement and need an explicit error model. For a background estimated from independent, equally exposed sky pixels, one approximation is . Correlated resampling, detector cross-talk or a spatially structured sky invalidates the independent-pixel simplification.
Photon counting and sky. Source photon shot noise has variance and cannot be calibrated away. Longer integration or greater throughput improves its fractional error as . Sky photons, including moonlight, airglow and scattered light, add their own Poisson fluctuations. A dark site, appropriate observing time and filter, good baffling and a smaller or optimally weighted source aperture reduce sky contributions. Better seeing or adaptive optics can concentrate a point source into fewer noise-bearing pixels. Sky subtraction removes the mean background but not the random sky photons already recorded, and the sky estimate adds uncertainty of its own.
Dark and read noise. Thermal dark current contributes a mean and shot noise. Cooling reduces its rate; well-matched dark frames remove a reproducible mean and map hot pixels, but do not undo the science exposure's random dark-current fluctuations. Each read adds electronic noise. At fixed total integration, many short exposures add more read variance than fewer long exposures, so use exposures long enough to become sky limited when saturation, cosmic rays and temporal changes permit. Multiple non-destructive reads can help on detectors that support them. Subtracting a bias frame corrects an electronic offset, not the stochastic read noise.
Calibration and non-Poisson effects. Pixel sensitivity differences, illumination gradients, fringes, nonlinearity, imperfect charge transfer and electronic pattern noise leave calibration errors. High-count flat fields, stable operating conditions, linearity calibration, dithering and appropriate detector models help, while the finite signal-to-noise of calibration frames propagates into the result. Cosmic-ray hits, hot pixels, satellite trails and scattered-light artefacts are not ordinary stationary Gaussian noise: identify or mask them, often using several exposures. Overaggressive clipping can remove real transient or compact-source signal.
Atmospheric scintillation adds correlated intensity fluctuations, especially in short bright-star measurements; seeing changes and guiding errors move flux between pixels or apertures. Differential photometry using appropriate reference stars and stable apertures reduces common variations but does not guarantee removal of chromatic or position-dependent effects. For a constant flux-limited source in independent stationary noise the final signal-to-noise usually grows as once background limited; a systematic floor or correlated sky can stop that improvement. Distinguish improvement of calibration, which removes reproducible bias, from elimination of intrinsically random photon arrivals, which is impossible.
Original public paper: FOI release, physical pages 667–668; questions on page 668.
The detector is intended for arcsecond-scale astronomical seeing, rather than the telescope's diffraction limit. A circular aperture of this area has diameter , giving a Rayleigh criterion angle about arcsec at the observing wavelength. One-arcsecond pixels conventionally sample an astronomical seeing profile of roughly two arcseconds across with two samples; a one-arcsecond profile would be undersampled. The pixel scale alone does not determine an exact astronomical seeing width.
Use the supplied surface brightness as radiative flux integrated over the photometric passband: its units contain no inverse hertz. Treat as the representative photon energy, and assume unit throughput and quantum efficiency. A genuinely frequency-specific brightness would require a bandwidth. With angles measured consistently in arcseconds, an annulus has area square arcseconds, soThis is flux per collecting area; collected energy is . There is no extra conversion to steradians when both brightness and angular area use square arcseconds.
For Poisson photon counting, a pixel with expected count has energy and standard deviation . Thus the local four-sigma rule gives , or 16 photons at the boundary. With pixel area ,Consequently arcsec andIntegrating to the model's outer radius arcsec instead givesThe pixel cut retains 51.6% of this total. It is an imposed isophotal photometry rule, not a fundamental limit: averaging annuli or fitting a justified profile can recover signal below the per-pixel cut.
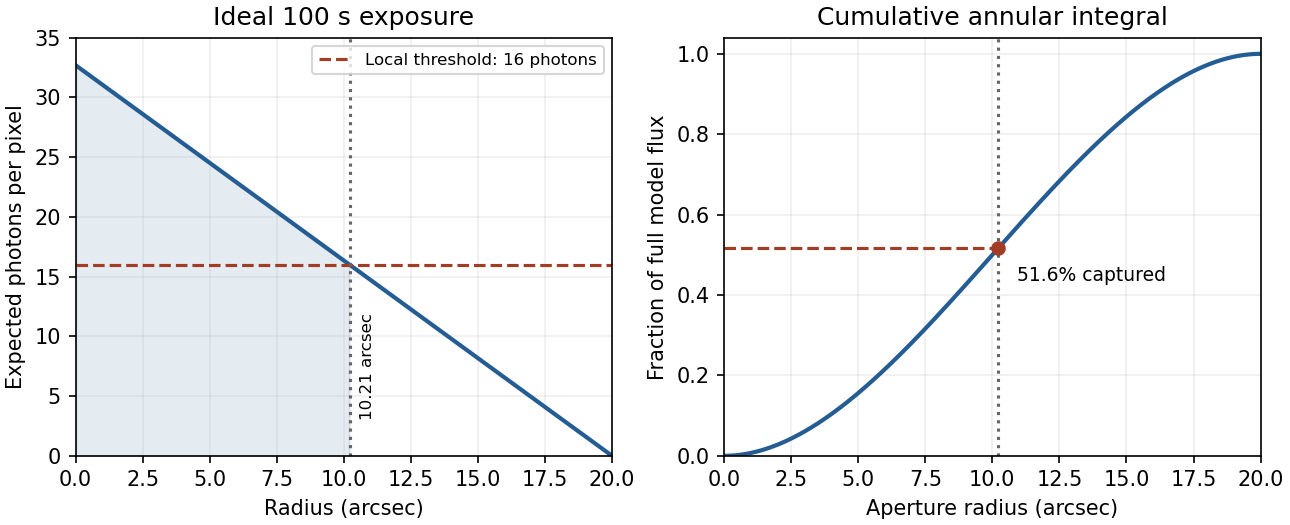
In practice, sky background photons add shot noise even after subtraction of the mean sky. read noise, dark current, imperfect flat-field correction, throughput calibration and atmospheric extinction also matter. At large radius the dominant uncertainty can be a tiny error in the sky level, scattered light or the wings of the point spread function, rather than source photon statistics. Mask foreground stars and background objects, compare blank-sky regions and dithered exposures, and check profile recovery by inserting artificial extended sources. astronomical seeing and finite pixels convolve the intrinsic profile; model that response when extrapolating the total.
The luminosity convergence of an outer surface-brightness profile follows directly: contributes , hence at large radius for . For either shallow index considered, ever larger annuli dominate: extending the law to infinity gives an unphysical divergent luminosity. Such a law must eventually steepen or truncate. Over a finite range, however, substantial light can lie below a surface-brightness selection threshold and be mistaken for sky. This biases galaxy luminosities, the luminosity function and the inferred diffuse light budget; distant diffuse galaxies become especially incomplete because bolometric cosmological surface-brightness dimming scales as . An assumed finite-aperture total is therefore a model-dependent quantity.
The observed population is the parent population filtered by an astronomical selection function and measurement errors. Malmquist bias arises because a flux-limited galaxy selection admits luminous objects from larger volumes: in Euclidean space and . Thus observed luminosity counts are weighted by . Even a nominal standard candle with intrinsic scatter is preferentially observed on its bright side near the limit; ignoring this can underestimate distances. A volume-limited sample or a justified weighting helps, subject to completeness, geometry and evolution assumptions. Separately, Eddington bias occurs when noise scatters a steeply rising population across a detection threshold: more faint objects enter than bright objects leave.
Lutz-Kelker bias concerns noisy stellar parallaxes and population/selection weighting. Locally uniform spatial density gives and, by changing variables, over the model's valid finite range. More distant stars are available to scatter into a parallax-limited sample than nearby stars to scatter out. Inverting an uncertain parallax also introduces a distinct nonlinear-estimation problem. There is no universal magnitude correction for every star: spatial density, luminosity, extinction and how the sample was selected all matter. The classical treatment motivates this issue; it should not replace an explicit generative model.[ref]
On the Use of Trigonometric Parallaxes for the Calibration of Luminosity Systems: Theory by T. E. Lutz and D. H. Kelker. PASP 85, 573–578; classical uniform-density calibration model
Bayes' theorem combines the measurement likelihood function with a justified prior distribution. For example, with a Gaussian parallax error and consistent distance/parallax units,A proper distance prior for parallax inference might have with a justified scale ; extending to infinity gives an improper posterior here. Negative measured parallaxes remain valid noisy data. For selection conditioning in Bayesian inference, distinguish individual inference from population inference: if selection is determined entirely by the exact data already conditioned on, it adds no further information about that individual's parameters. For population parameters , the selected-data likelihood must instead include the detection normalization . Applying a cut twice is also an error.
Selection can depend on surface brightness, angular resolution, dust, sky coverage, colour and observing cadence as well as total flux. Crowding and unresolved binaries bias distance calibrators. Transit surveys favour large planets and short periods, with an additional geometric transit probability approximately for small planets on circular orbits; injection/recovery tests quantify the remaining transit survey completeness. Cluster catalogues select noisy mass proxies from a steep abundance distribution. Planck's 2013 SZ catalogue explicitly characterized detection completeness and reliability rather than identifying every detection with an unbiased mass census.[ref]
Planck 2013 results. XXIX. Planck catalogue of Sunyaev-Zeldovich sources by Planck Collaboration. abstract and selection-function/completeness analysis, 2013 preprint
Calibrators, artificial-source tests and a forward model of detection, measurement and follow-up are the practical checks on any correction.The thermal Sunyaev-Zeldovich effect is inverse Compton scattering of cosmic microwave background photons by hot cluster electrons. For an optically thin, nonrelativistic thermal plasma,The Compton y parameter measures the electron pressure column. The distortion is a decrement below roughly 217 GHz, an increment above it, and has in the Rayleigh-Jeans law limit. Relativistic electron corrections modify the spectrum and null.[ref]
Multifrequency maps separate this spectrum from primary Cosmic microwave background anisotropy, radio sources and dust; atmospheric subtraction, beams and calibration require control. The kinetic Sunyaev-Zeldovich effect has and a CMB-temperature-like spectrum, so it is both a contaminant and a peculiar-velocity probe. Planck demonstrated blind multifrequency cluster detection with external confirmation and a measured selection function.[ref]
Planck 2013 results. XXIX. Planck catalogue of Sunyaev-Zeldovich sources by Planck Collaboration. abstract; multifrequency detection and catalogue validation
For a fixed physical pressure column, has no ordinary cosmological surface-brightness dimming: the distorted spectrum and CMB redshift together. The integrated Compton parameter still scales as for fixed integrated physical pressure. SZ observations therefore find distant clusters and measure thermal pressure; integrated is a useful mass proxy, requiring calibration and a selection model for cosmological counts. X-ray emission scales approximately as , while SZ scales as . Combining them and a measured temperature constrains density, depth and, with angular geometry, distance. gas clumping factor, asphericity, temperature structure and nonthermal support limit that inference.
An astronomical interferometer combines light from collectors separated by projected interferometric baseline . For a distant, narrowband, spatially incoherent source, the Van Cittert-Zernike theorem gives normalized complex visibilityThe resolving scale is , while the individual collector and beam combiner restrict the field of view. Delay lines compensate geometric path differences. To see broadband fringes, residual optical path length mismatch must lie within the coherence length of order ; fringe tracking follows rapidly changing atmospheric piston in interferometry. Baseline changes and Earth-rotation aperture synthesis sample additional spatial frequencies.
For an ideal uniform circular star of full angular diameter ,Real limb darkening changes the conversion. Several baselines constrain binaries, stellar radii and circumstellar structure; orbital angular separations combined with radial velocities can give physical orbital scales. calibration stars test contrast losses, alongside wavelength, photometric imbalance, polarization and bandwidth controls. For three collectors the closure phase cancels telescope-based phase errors: retains source asymmetry information. Sparse baseline coverage still leaves image/model ambiguities.
In stellar intensity interferometry, thermal-light correlations instead give for an ideal single-polarization resolved temporal mode. The Sirius experiment correlated separate detector outputs rather than optically combining the beams.[ref]
A Test of a New Type of Stellar Interferometer on Sirius by Robert Hanbury Brown and Richard Quentin Twiss. Nature 178, 1046–1048 (1956)
Pure atmospheric phase shifts do not alter local intensities, but finite detector bandwidth dilutes the correlation and photon statistics limit sensitivity; the two-detector observable also loses the complex phase.annual stellar parallax uses the known Earth-orbit baseline, with . Repeated positions separate parallax from proper motion; calibration offsets, binarity and noisy-parallax selection require checks. Nearby stars calibrate absolute luminosities. Extinction-corrected distance modulus then givesmain-sequence fitting compares a cluster sequence with nearby calibrated stars; age, metallicity, reddening and unresolved binaries limit the match. Cepheid variables extend the range to nearby galaxies: measure periods and mean multiband magnitudes, calibrate the Cepheid period-luminosity relation, and correct for extinction, metallicity, crowding and pulsation mode. RR Lyrae stars and the tip of the red giant branch provide complementary population-II routes with their own composition and calibration dependence.
Some anchors bypass intermediate rungs. An eclipsing-binary distance starts from a double-lined eclipsing binary: velocities give ; eclipses give inclination and relative radii , hence physical radii. An independently calibrated surface-brightness/colour relation gives angular radii and distance; alternatively corrected bolometric flux satisfies for a component. temperature, extinction, third light and surface-brightness calibration remain systematic errors. Eight late-type binaries gave a 2.2%-accuracy LMC anchor in 2013.[ref]
An eclipsing-binary distance to the Large Magellanic Cloud accurate to two per cent by G. Pietrzyński and others. abstract, Nature 495, 76–79; photometric and orbital information
A maser-disk geometric distance uses water masers orbiting in the nearly edge-on nuclear disk of NGC 4258. very-long-baseline interferometry, Doppler velocities, proper motions and accelerations constrain its orbit scale and distance. In an ideal circular, matched-radius example and ; real fits account for disk warp and different maser locations. This geometric method calibrated an extragalactic distance independently of stellar luminosities.[ref]
A 4% Geometric Distance to the Galaxy NGC4258 from Orbital Motions in a Nuclear Gas Disk by J. R. Herrnstein and others. abstract; orbital proper motions and accelerations, 1999
These overlapping anchors cross-check the nearby-galaxy ladder; no Hubble-flow fit is needed here.thermal bremsstrahlung is continuum radiation from electrons accelerated in ion electric fields. For Maxwellian electrons,At high frequency the exponential cutoff constrains ; X-ray fitting must also model foreground absorption, line emission, detector response and possible multitemperature or nonthermal components. At radio frequencies, , an optically thin free-free spectrum is almost flat, with the weak frequency dependence set mainly by the Gaunt factor.
For pure ionized hydrogen, radio free-free opacity givesThe turnover constrains emission measure; a resolved, optically thick source has brightness temperature approaching . An unresolved source has an unknown beam filling factor, so its observed brightness need not equal its electron temperature. Angular size and an independent distance give a geometric depth ; a uniform model then yields . Clumping instead measures a density-squared average, not the mean density.[ref]
Essential Radio Astronomy by James J. Condon and Scott M. Ransom. chapter 4, equations (4.57)–(4.60); emission measure and thick/thin spectra
A free-free spectrum alone does not uniquely determine density and size. The density-depth degeneracy of free-free radiation is explicit: for a resolved uniform column, , leaves both emissivity-integrated brightness and optical depth unchanged at fixed temperature. With independent SZ information and known , the electron column is ; thenThese equalities require consistent composition and geometry, and uniform density and temperature. Relating to angular extent can give distance; asphericity and the gas clumping factor are important limitations of this combined cluster method.
Original public paper: Physical PDF pages 596–597. Both long questions and all four optional notes are covered.
Bayes' theorem relates a model parameter and observed data by . The posterior describes the parameter after observation, the likelihood describes the data for a specified parameter, the prior describes the parameter before these data, and the evidence normalizes the posterior. Likelihood is a function of the unknown parameter; it is not automatically a normalized probability density over that parameter.
Stellar parallax is the apparent annual change of a nearby star's direction relative to distant background objects as the observer moves around the Sun. The conventional parallax angle uses a one-AU baseline, so in radians, or in parsecs and arcseconds. Many small approximately independent centroiding and reference-frame errors can yield approximately Gaussian parallax errors through the central limit theorem. Correlated calibration errors, outliers and low-signal image fitting can violate that approximation; Gaussian measurement errors also need not produce Gaussian errors after taking a reciprocal distance.
For a locally uniform spatial population, the number in a spherical shell is proportional to . Changing variables using givesThis is a local population-density rule on its valid distance range. It needs a finite population or survey boundary to be a normalized global prior. An unbounded volume prior combined with a Gaussian parallax likelihood can otherwise yield an improper posterior, as explained by the proper distance prior for parallax inference.
For the requested top-hat calculation, distinguish the unknown true parallax from the reported likelihood center . Take a known fixed half-width , so the likelihood is constant over . Assume this interval lies inside the applicable population range. The top-hat parallax posterior under a uniform-volume prior is thenSetting givesThe greater available volume at smaller true parallaxes weights that side of the likelihood more strongly. This inference is not an additional measurement of the star's actual parallax.
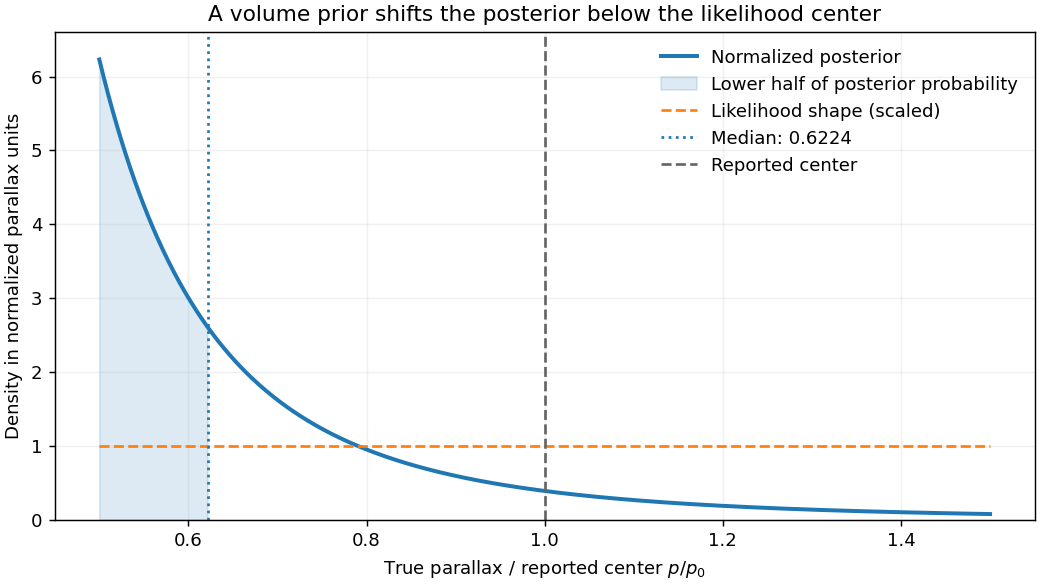


The printed notation uses both for the unknown true parallax and for the top-hat center in the numerical comparison. The distinct notation above states the consistent fixed-width interpretation yielding its result. If the half-width instead varies with the unknown parameter as , the normalized likelihood has an additional factor and different support; the same posterior calculation cannot be reused unchanged.
To improve distance inference, use independent information on luminosity, spatial density, extinction and sample selection. If the common luminosity in the measured band is calibrated, a flux measurement supplies another distance constraint through . If that common luminosity is unknown, it can be treated as a population parameter rather than silently assumed known. A finite distance distribution and the actual selection function specify which prior is appropriate. The classical Lutz-Kelker bias is a sample-calibration problem; a posterior shift under a justified prior is not itself an error to remove by a universal correction.
With flux-limited selection for identical standard candles and a noise-free threshold, there is a maximum observable distance, hence a minimum true parallax. The selected prior is truncated there. There is no luminosity-preference Malmquist bias if every object truly has the same luminosity. With a luminosity distribution, the accessible Euclidean volume scales as , preferentially including brighter objects; this is the Euclidean accessible-volume luminosity weighting underlying Malmquist bias. Flux errors additionally scatter numerous faint sources upward across a threshold, biasing selected measured fluxes. Extinction, different spectral energy distributions in a selection band, crowding, completeness and parallax-quality cuts can alter the effective population. These effects require a joint selection and error model rather than a single blanket parallax correction.
The wavelength is . Thirty dishes give interferometric baselines. The longest projected baseline sets the finest angular scale, while the individual dish beam sets the instantaneous field of view. At the maximum separation,A aperture instead has primary-beam width of order , about arcseconds; the Airy first-null convention gives about arcseconds. Illumination taper changes the precise beam definition. The array therefore resolves many synthesized beams within one pointing, but it does not image an arbitrarily wide field at that resolution.
The shortest useful baseline determines missing large-scale structure. A common estimate is . If dishes can be packed with usable center separations near , this is of order arcseconds. A more extended layout has a smaller recoverable scale. The site diameter does not specify or the actual Fourier coverage, and low-elevation shadowing can remove short spacings. Mosaicking expands sky coverage but does not supply all zero-spacing information; suitable total-power or compact-array data help recover extended emission. Earth rotation and reconfiguration improve sampled baseline coverage, sidelobes and image reconstruction, with a tradeoff between resolution and surface-brightness sensitivity.
For dish aperture efficiency , . The system-equivalent flux density of one dish isFor independent receivers, natural weighting, correlator efficiency and equally sensitive polarization products contributing to intensity, the unresolved-source thermal rms isHere is usable bandwidth and integration time. A numerical sensitivity is therefore conditional on these unspecified observing choices. For an illustrative bandwidth, one hour, two polarizations and , it is about , or at . Resolved-source brightness sensitivity also depends on beam area and missing flux. The sensitivity expression assumes naturally weighted data and the stated polarization convention.[ref]
Earth rotation changes geometric delay. At a baseline , can be of order , here , and a raw fringe-rate bound isThe actual rate depends on geometry and source direction. Correlator delay tracking and fringe stopping compensate the chosen phase center rather than averaging rapidly rotating uncorrected fringes away. Off-center directions retain residual delays and rates.
Finite bandwidth causes chromatic phase averaging and radial bandwidth smearing. A direction offset has residual delay of order ; a channel should satisfy for small decorrelation. Across a field of order radians on the longest baseline, the one-cycle frequency scale is about , so substantially narrower channels are required for accurate wide-field imaging. Similarly, time averaging should keep ; the associated one-cycle scale is about seconds in this example. Frequency-resolved visibilities and shorter dumps control these field-dependent averaging losses in radio interferometry; they are averaging losses, not ordinary glass-lens chromatic focusing.
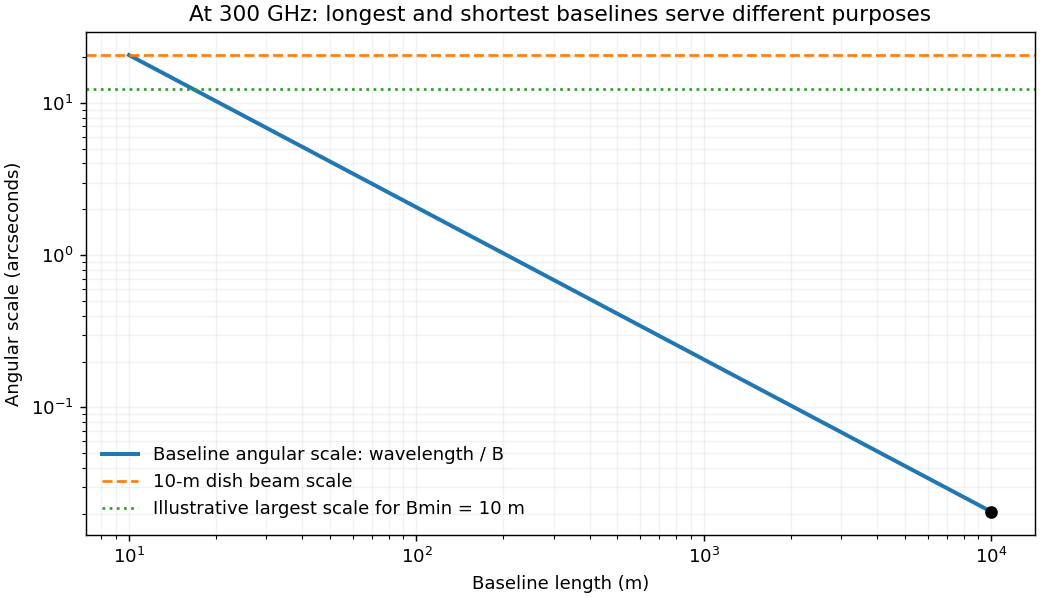
Millimeter-array baseline tradeoff: angular resolution and the loss of large-scale structure
. Details. 
At , atmospheric water vapor produces absorption, thermal emission and path-length fluctuations. A high dry site reduces these effects, while phase fluctuations can still destroy coherence on long baselines. A one-radian phase corresponds to path fluctuation , motivating frequent phase calibration or atmospheric path monitoring. Surface errors must also be small relative to the wavelength: the Ruze efficiency factor is . Pointing errors matter relative to a primary beam only tens of arcseconds wide.
Important systematic errors include antenna gains and bandpasses, delay and baseline-coordinate errors, polarization leakage, pointing, atmospheric opacity, correlator response and flux-scale calibration. Nearby compact calibrators, bandpass standards, appropriate total-power information and repeated configurations address different parts of this problem. High nominal collecting area and longest-baseline resolution alone do not determine image dynamic range or reliable extended-source flux.
Forbidden emission lines arise from transitions strongly suppressed in the electric-dipole approximation, often between metastable levels. They can radiate in dilute gas because collisions are infrequent enough for a slow radiative decay to occur. In a two-level optically thin approximation, statistical equilibrium givesThe critical density of an atomic transition is . At densities well below it, almost every collisional excitation radiates; above it, collisional de-excitation quenches the line relative to its low-density scaling. Collision coefficients and level populations determine the detailed multi-level diagnostic.
To measure temperature, compare lines of the same ion with significantly different upper-level excitation energies. The excitation coefficient contains a factor roughly times a collision strength. The oxygen forbidden-line temperature diagnostic compares the relatively high-excitation -angstrom line with the strong - and -angstrom lines. Their ratio is sensitive to electron temperature while canceling much of the common ionic abundance and emission measure.
To measure density, use upper levels with similar excitation energies but different radiative lifetimes and critical densities, as in . Their relative collisional quenching changes the ratio over an intermediate density range. At very low and very high densities the ratio approaches limiting values and loses sensitivity. A practical analysis fits density and temperature together, corrects wavelength-dependent extinction and calibration, checks blends and optical-depth assumptions, and uses reliable atomic transition and collision data. A single measured ratio generally constrains an emitting-gas model rather than proving every point of a nonuniform nebula has the same temperature.
The thermal Sunyaev-Zeldovich effect is inverse-Compton scattering of cosmic microwave background photons by hot electrons in the intracluster medium. Electron thermal energy shifts photons toward higher frequencies, changing the spectrum relative to neighboring sky. In the nonrelativistic, small-optical-depth limit its amplitude is controlled by the Compton parameterIt measures line-of-sight electron pressure. At low frequencies the apparent Rayleigh-Jeans temperature changes by . The thermal spectral distortion crosses through zero near for the usual CMB temperature and then becomes an increment; relativistic corrections matter for hot gas. Multi-frequency measurements distinguish this spectrum from dust, radio sources and an ordinary CMB temperature fluctuation.
The surface-brightness contrast has no ordinary dimming for the same cluster pressure integral: the incident CMB temperature and the observation's frequency redshift scale together. Angular extent and integrated flux still depend on distance. This makes the effect useful for selecting distant clusters and mapping their thermal pressure. The solid-angle integral scales with total thermal energy divided by angular-diameter distance squared, providing a mass proxy when its gas-physics calibration is specified.[ref]
Planck 2013 results. XXIX. Planck catalogue of Sunyaev-Zeldovich sources by Planck Collaboration. cluster survey and integrated-SZ selection context
X-ray surface brightness depends roughly on , whereas depends on . Combining X-ray spectra, brightness and resolved SZ data constrains density and line-of-sight depth. With a justified geometry, comparison to angular size gives a distance estimate; clumping and elongation can bias it. Cluster abundances and their redshift evolution test cosmological structure growth after selection and mass calibration are modeled.
The kinetic Sunyaev-Zeldovich effect additionally probes bulk line-of-sight motion, with leading in a stated velocity-sign convention. Its approximately blackbody temperature spectrum differs from the thermal distortion. These are complementary measurements of thermal pressure and gas motion, requiring foreground and instrumental control.
A charge-coupled device converts incident optical photons into collected electrons in pixel potential wells. Exposure accumulates charge; clocked transfers move it to readout amplifiers. Quantum efficiency, gain, read noise, dark current, saturation and charge-transfer behavior determine the usable signal. Bias or overscan estimates remove electronic offsets, dark frames characterize dark signal where needed, and flat fields correct relative response and illumination. Multiple exposures help identify cosmic rays and defective pixels, while astrometric alignment permits stacking.
For aperture photometry, sum the source aperture and subtract an estimated local sky contribution. A point-spread-function fit can instead use the expected spatial shape, particularly in crowded fields. Detector gain converts recorded units to electrons before applying a Poisson noise calculation. Let the aperture contain pixels, total expected source charge , sky charge per pixel, dark charge per pixel and rms read noise per pixel. With a perfectly known background mean,If the background is estimated from independent comparable blank pixels, its subtraction adds approximately , givingThe extra term is uncertainty in the estimated mean; it does not replace the sky shot noise already present in the source aperture. A more exact budget propagates the actual bias, dark and flat calibrations and any pixel correlations. The existing aperture photometry with an estimated background derives this distinction.
For one exposure in the photon-limited regime, signal grows as and its counting noise as , so SNR grows as . Read-noise domination can favor longer individual exposures, but full-well saturation, cosmic rays, tracking and changing sky constrain them. Extraction uses an aperture correction or a calibrated PSF model to recover light outside the measured region. Flat-field errors, nonlinearity, imperfect sky gradients, blending and atmospheric transparency can dominate bright-source accuracy even when the formal photon error is tiny.
Type Ia supernovae are standardizable candles. Multi-epoch photometry measures peak brightness, light-curve shape and color; spectroscopy identifies the supernova type and supplies a redshift, preferably also using the host. Correcting the empirical width–luminosity relation and attenuation reduces the spread of absolute magnitudes. A nearby sample fixes a distance-ladder intercept, while distant events test the shape of the Hubble diagram. The observable relation isAn unknown common remains degenerate with the Hubble-constant intercept unless externally calibrated; relative distance-versus-redshift shape can still constrain acceleration.
For a cosmological spacetime described by an FLRW metric, the deceleration parameter is , and the low-redshift luminosity-distance expansion isA range of redshifts therefore tests the expansion history beyond the leading linear Hubble law. Within conventional matter-plus-cosmological-constant models, standardized distant supernovae fainter than a specified decelerating prediction imply larger luminosity distances and can favor . For late-time matter and a cosmological constant, . A flat example has . One brightness residual alone does not establish acceleration across arbitrary expansion histories or arbitrary attenuation models.
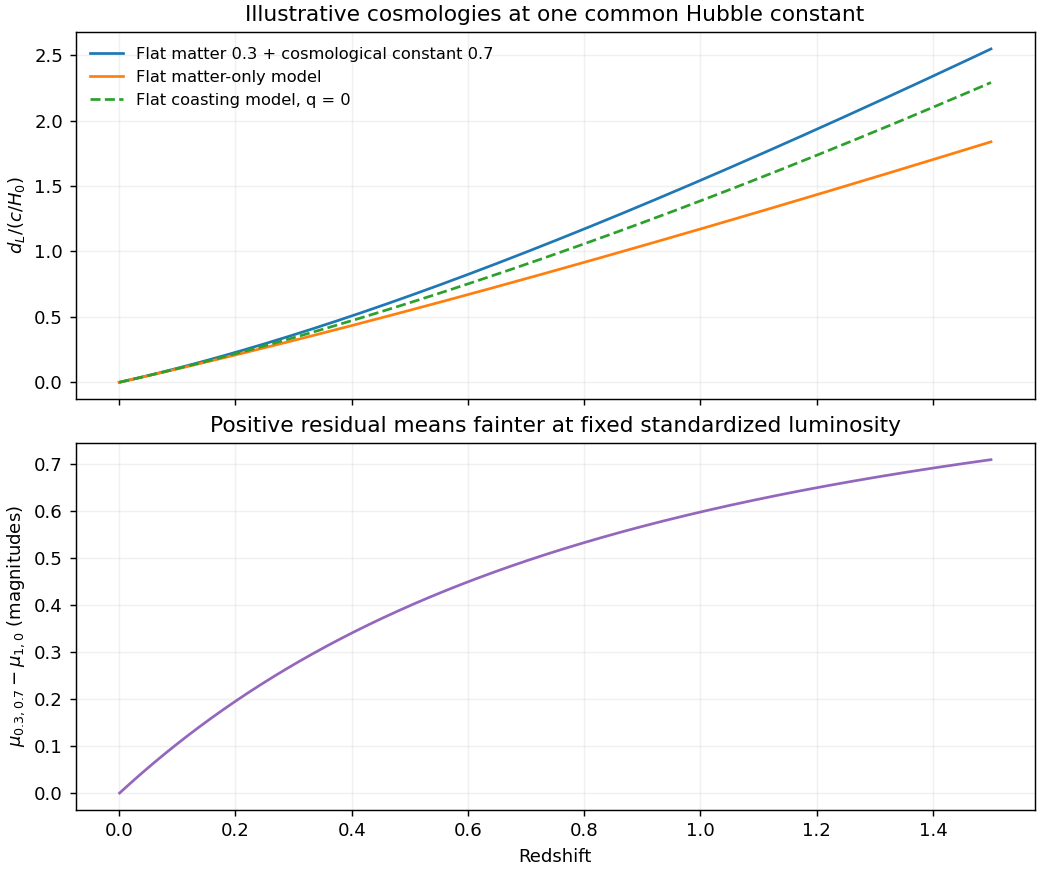
Illustrative luminosity-distance curves: expansion histories change standardized supernova magnitudes
. Details. 
The supernova discovery of accelerating expansion combined repeated imaging, difference-image candidate searches, spectroscopic classification and calibrated light curves. In the High-Z survey, CCD discovery images and later host images separated transient light from its host; point-spread-function fitting and artificial-star recovery tests checked the photometry. The measurements require K corrections between received and emitted passbands and account for the observed stretching of light-curve times.[ref]
Observational Evidence from Supernovae for an Accelerating Universe and a Cosmological Constant by Adam Riess and others. Sections 2.1–2.2, discovery imaging, spectroscopy and photometric controls
Relevant systematic tests include dust and color laws, possible population evolution, flux-limited selection, calibration across filters and telescopes, gravitational lensing and host contamination. An accelerating interpretation is assessed by fitting a specified cosmological family and its nuisance parameters, checking those effects and comparing independent observations. The two principal discovery teams provided independent distant-supernova analyses, including the 42-event Supernova Cosmology Project result.[ref]
Articles by others on the same topic
There are currently no matching articles.