Build a narrow-band wave packet from plane waves with wavenumbers close to :The Taylor expansion of the dispersion relation is , where . Put to obtainThe carrier's wave phase travels at the phase velocity , while the envelope has constant shape at constant . Its group velocity is thereforeThe approximation neglects higher derivatives of the dispersion relation. Those derivatives cause the wave packet to spread or distort over sufficiently long propagation times; the result describes the local envelope speed of a sufficiently narrow band.
Assume a massless junction and common tension . The characteristic impedance of a stretched string is , where is its linear mass density. The displacement reflection coefficient is , so the reflected fraction of power isSet . The positive solutions are , which are reciprocals. Thus the string density ratio for prescribed reflected power isThe impedance ratio is about , rather than the required density ratio. Reversing which string is on the incident side changes the reflected displacement sign but not the reflected power fraction.
A Michelson interferometer splits a collimated beam at a partially reflecting beam splitter. Two mutually perpendicular arms reflect from mirrors and recombine at the same beam splitter; the superposed returning beams produce interference fringes at the detector. Translate one mirror along its arm while holding the other fixed.
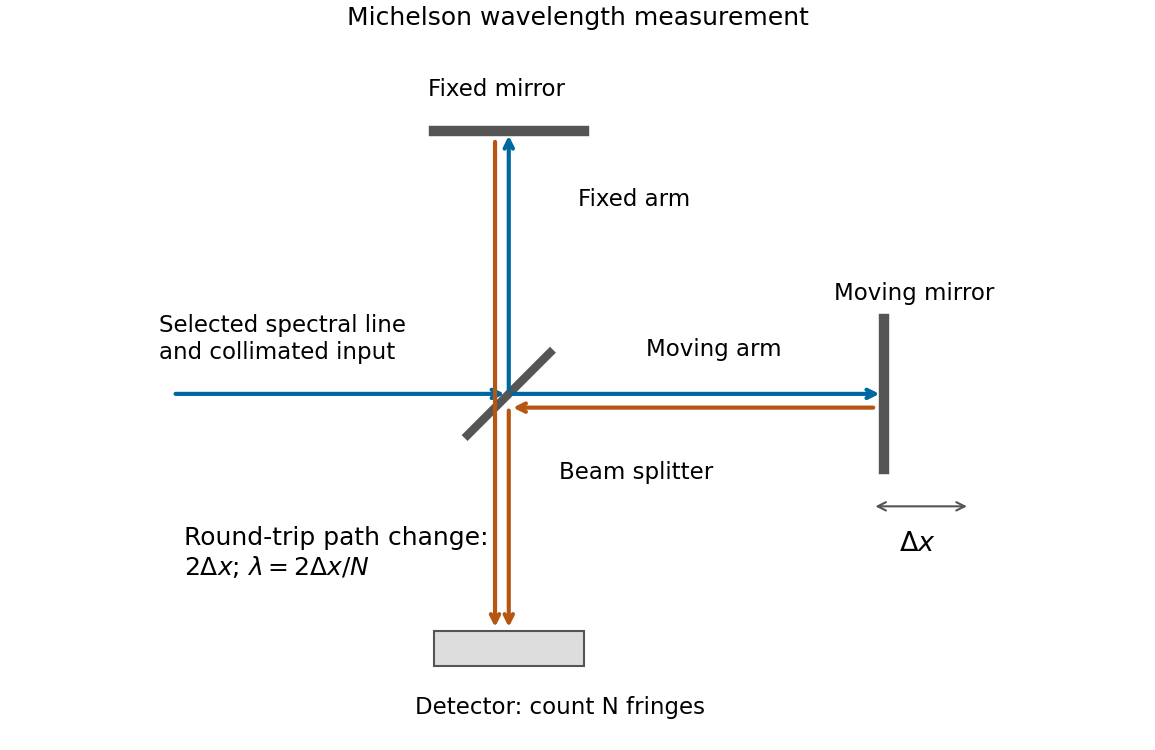
If that mirror moves a measured distance , the round-trip optical path difference changes by in air, approximated as vacuum. Every change of one wavelength moves one complete bright-dark-bright fringe cycle past a fixed detector point. Count such cycles to obtainUse a spectral line selected with a suitable optical filter, and count many interference fringes to reduce the fractional uncertainty of the distance and count. Keep the two arms within the source's optical coherence length and maintain overlap and alignment. If the vacuum wavelength is required for an arm filled with air of known refractive index , the corrected relation is at stable .
Take an abrupt equilibrium p-n junction with the p side at and the n side at . In the quasi-neutral bulk, electron holes are the majority carriers on the p side and Electrons are the majority carriers on the n side. With ionized dopant densities and nondegenerate statistics,where is the intrinsic carrier concentration. The semiconductor mass-action law applies at equilibrium. Both mobile populations are small in the depletion region compared with the dopant densities.
The charge and carrier density of an abrupt p-n junction must distinguish mobile populations from net charge. Diffusion leaves negatively charged ionized acceptor impurities on the p side and positively charged ionized donor impurities on the n side. Under the depletion approximation,The neutral bulks have large carrier densities but nearly zero net charge density. The electric field points from the positive donor region toward the negative acceptor region, balancing diffusion at equilibrium.
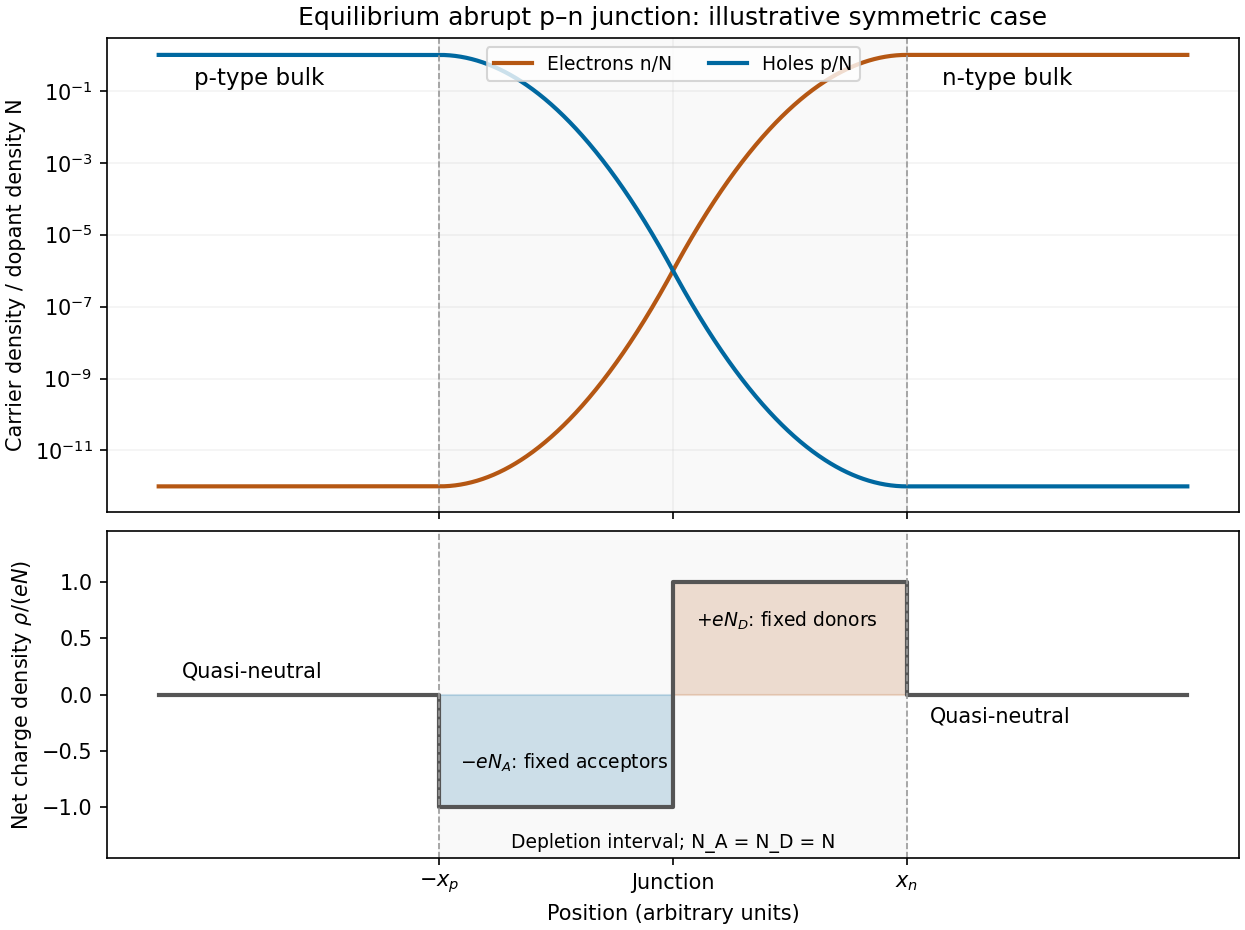
Illustrative equilibrium carrier densities and depletion-approximation net charge for a symmetric abrupt p-n junction
. Details. The figure uses equal dopant densities only to show a simple symmetric sketch. Generally the more lightly doped side has the wider depleted interval. The carrier profiles are smooth, whereas the step-shaped net charge density is the ideal depletion approximation.
Treat sodium as monovalent, with one mobile Electron per atom. Its mass density is , and its molar mass is . Using the Avogadro constant,The electron mobility relates the magnitude of drift velocity to electric field. The Drude model then givesUsing ,The inferred time is the momentum relaxation time. Identifying it with the mean time between collisions is the intended simple isotropic Drude model assumption; small-angle scattering need not relax directed momentum in a single event.
Draw the Fabry–Pérot etalon with parallel mirrors and an incident beam making internal angle with their normal. Every emerging transmitted contribution has undergone one more internal round trip than its predecessor.
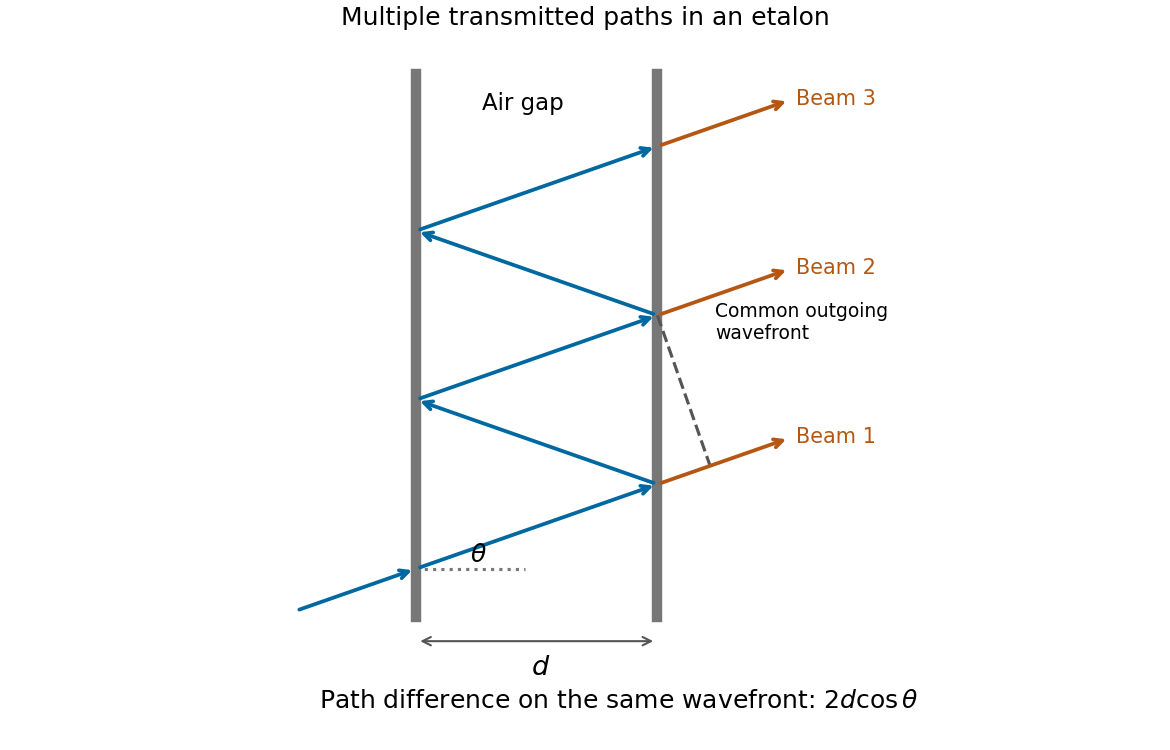


The extra internal path is , but successive contributions leave at laterally separated points, a distance apart. Comparing their phases on the same outgoing wavefront subtracts the path projection . Their net optical path difference in air isHence, in the reflection-phase convention implicit in the supplied transmission formula,For a gap of refractive index , replace by and use the vacuum wavelength. Coating reflection phases can add a round-trip offset; the expression above assumes that offset is absorbed in the resonance order, or is zero modulo as in the stated ideal model.
Write , keeping this coefficient distinct from the finesse . The transmission has maxima at . At a displacement from a maximum, its ratio to peak transmission is . Half maximum therefore requiresThis is the half-width in wave phase; the full width at half maximum is . Successive resonances are apart, so the exact ideal-model result isFor narrow peaks, , the small-angle approximation to the inverse sine givesThus the formula requested in the paper is the high-reflectivity approximation, not an exact identity at arbitrary . Ordinary half-maximum peaks exist only when , or ; below that threshold the transmission minimum never reaches half the peak. The prefactor cancels from this relative-width calculation.
Let , and . Requiring the separation to be at least times the measured full width at half maximum means a width no larger than , or a resolving power of approximately .
The etalon resolving power and order overlap constraints are particularly clear in frequency. Put . At normal incidence, the free spectral range is and the instrumental width is . ThusAvoiding ambiguity between the doublet and adjacent interference orders requires a free spectral range exceeding the doublet separation:Together these giveUsing the narrow-peak finesse from the previous part, gives , with a practical margin above that limiting value. At the exact limit, the gap between orders vanishes, so equality is not a sensible operating point.
One feasible ideal design is , , and . It has an approximate wavelength free spectral range of and instrumental width near the doublet. The doublet spacing is about widths. Even the spacing to the nearest replica of the other line exceeds widths in this example. If that latter separation is also required in general, impose the stronger condition , rather than just the two basic inequalities.
Such mirror reflectivities and submillimetre gaps are plausible for a high-quality Fabry–Pérot etalon. Flatness, parallelism, coating loss, angular spread, mechanical stability and source width limit the achieved finesse. A wavelength width of corresponds to a gap variation of order , so the ideal coating-limited estimate demands stringent uniformity. The paper expressly excludes intrinsic source broadening.
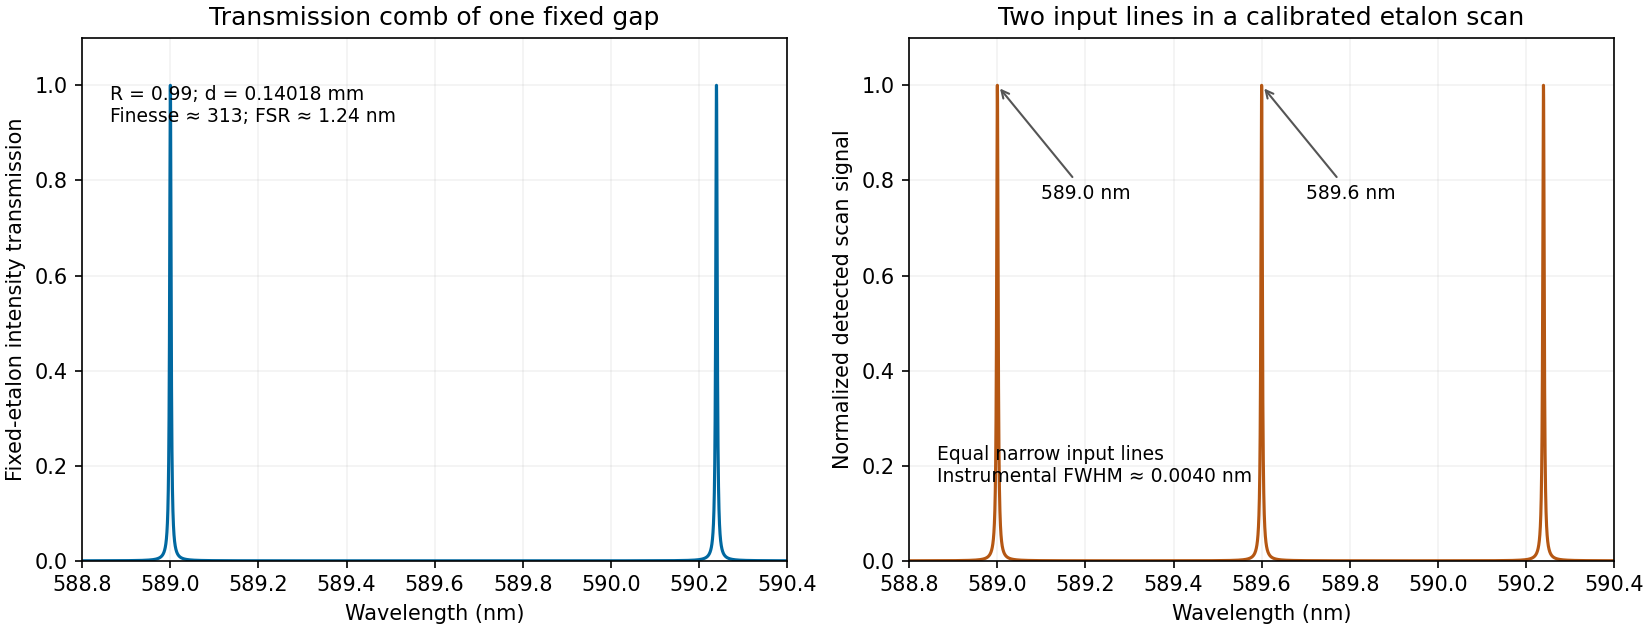
Calculated etalon transmission comb and a scanned doublet spectrum for an illustrative design meeting the width and order constraints
. Details. 
The first panel is the fixed etalon's transmission versus wavelength, a comb of resonances. It does not by itself have one peak at each sodium line. The second panel shows the two peaks obtained by scanning the etalon phase or gap and calibrating the scan to wavelength. A fixed-gap output spectrum is instead the incident spectrum multiplied by the transmission function. This distinction is needed to interpret a doublet measurement correctly.
A high-finesse Fabry–Pérot etalon obtains very narrow transmission peaks by summing many coherent round trips, allowing high resolving power with a compact optical path. It can transmit a substantial fraction of resonant light when coating absorption is small, and works well for precise relative line separations and narrow-line measurements. A diffraction grating may require many illuminated grooves to achieve the same resolving power.
The etalon's free spectral range is limited, and repeated orders cause ambiguity across a broad optical spectrum. It commonly needs scanning and an order-selecting optical filter or another dispersive element. Mirror alignment, flatness and illumination angle strongly affect peak positions and widths, and absorption lowers throughput. A diffraction grating instead separates a broad range of wavelengths spatially for simultaneous detection, although grating orders can also overlap. The preferred instrument depends on whether narrow-band precision or broad spectral coverage is the priority.
Here is displacement from equilibrium, in metres; is the oscillating mass, in kilograms; is the coefficient of linear viscous damping, in ; and is the spring constant, in . The terms , and are respectively the inertial term, the opposing velocity-dependent damping term and the opposing displacement-dependent restoring term when moved to the force side of Newton's second law.
is a possibly complex driving-force complex amplitude, measured in newtons. is the driving angular frequency in , and taking the real part of gives the physical sinusoidal force. Its frequency in hertz is . The natural undamped angular frequency and damping rate areThis damped harmonic oscillator model assumes a linear restoring force and a linear, instantaneous viscous damping law.
Set the drive to zero and try . The characteristic equation isFor underdamping, , the roots are , with . The displacement oscillates with an exponentially decaying envelope:For critical damping, , there is a repeated root , giving . The motion is nonoscillatory and is the limiting case between oscillatory and overdamped response.
For overdamping, , the roots are distinct negative real numbers and . Both components decay without sustained oscillation; strong damping gives a particularly slow late-time relaxation. Constants depend on the initial conditions. A nonoscillatory solution can cross equilibrium once for some initial data, so “nonoscillatory” does not mean monotone for every possible initial condition.
Let the initial conditions be and . The velocity-impulse response of a damped oscillator isAll curves start at the origin with the same positive slope . Underdamping gives a decaying sequence of positive and negative lobes. Critical damping gives one positive lobe followed by return to zero. Overdamping also remains positive for these initial data, but has a longer tail. The initial impulse changes velocity abruptly, not displacement.
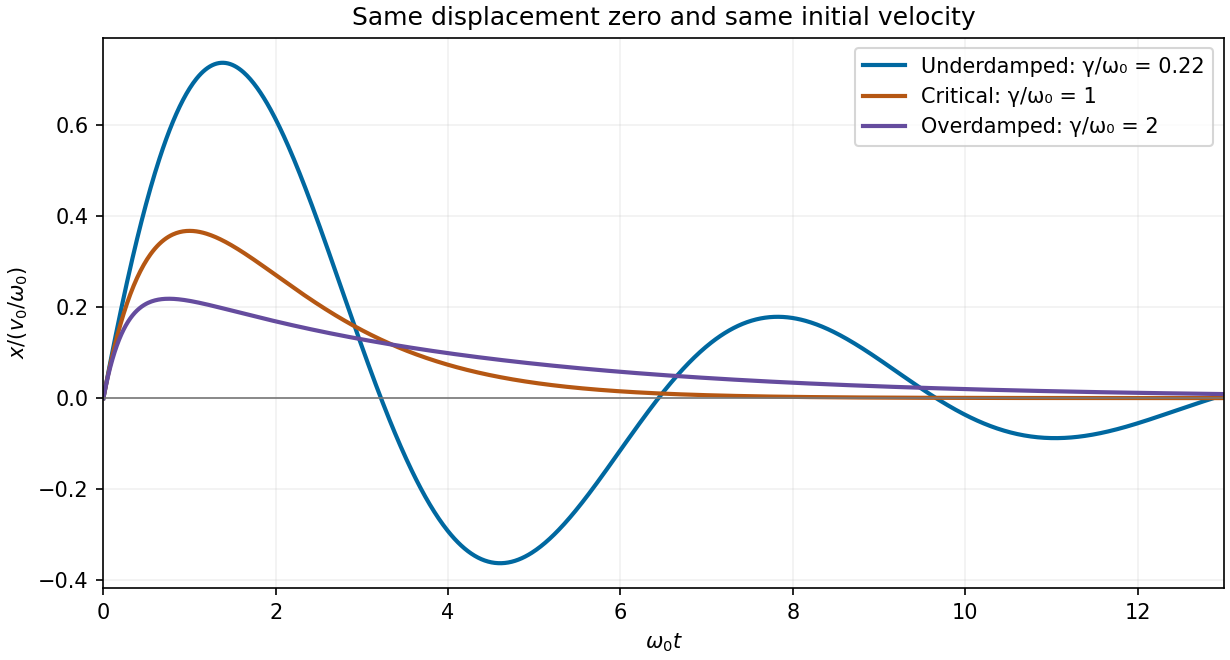
Calculated displacement after the same initial velocity impulse for underdamped, critically damped and overdamped oscillators
. Details. 
For underdamping, the general response is a free transient plus a particular driven response. Use the paper's convention. The steady displacement complex amplitude isThusHere , and the real constants enforce the initial conditions. For a real positive , the steady term is , whereFor light damping, and the transient decays slowly compared with an oscillation. The two-argument phase convention makes the displacement lag evolve from approximately zero below resonance through near to approximately far above it.
The response is quasistatic at low frequency, resonantly enhanced when the spring and inertia nearly cancel, and suppressed as at high frequency. The original graph gives approximate readings , and . These are graph estimates, not exact supplied measurements.
Use oscillator parameters from static and resonant displacement. The static spring constant isFor light damping, , givingNear resonance, , soIndependently, the resonance enhancement estimates the same quality factor. The half-power displacement level is ; its intersections are approximately and , giving bandwidth and .
The exact displacement-peak frequency is . At its difference from is only about , well below the precision justified by this printed curve. Greater numerical precision for the inferred parameters would be misleading.
In Fresnel diffraction, the propagation wave phase varies quadratically across the aperture and that curvature must be retained. For a transverse scale at propagation distance , its size is of order . In Fraunhofer diffraction, that quadratic term is negligible, approximately , while the linear phase encoding the observation angle remains. A lens can also form the far-field angular pattern in its focal plane.
For a normally incident plane wave and aperture transmission , the far-field complex amplitude is its Fourier transform:The detected light intensity is proportional to . For identical parallel slits, write the transmission as a sum of shifted copies of one slit. The Fourier shift theorem gives one single-slit transform multiplied by the sum of positional phase factors:The single-slit diffraction envelope sets the broad scale, while coherent interference between slit centres produces the finer array pattern. One sums complex amplitudes before squaring, rather than adding independent slit intensities.
Put the slit centres at . Each slit has the same width and illumination. Its contribution to the Fraunhofer diffraction complex amplitude isThe four phase factors pair into cosines:Therefore the four-slit Fraunhofer diffraction field isThe common factor can be absorbed in the proportionality constant, giving the requested form. In particular , as expected from four equal in-phase slits. Normalizing by the central intensity givesThe last form follows from and avoids apparent singularities in the usual sine-ratio array formula.
Let be horizontal position on the screen, , and use . The plotted interval is . With , and , the four-slit Fraunhofer diffraction intensity is the previous normalized expression evaluated at this angle. The total aperture width is , giving a Fresnel number of order , consistent with the far-field approximation.
Nominal principal array directions satisfy . Their screen positions areThus the visible nonzero orders are near , in addition to the central maximum. The even nonzero orders are missing diffraction orders: at the first envelope zero occurs at . The next envelope zero and direction lie at about , just beyond the screen edges.
At the nominal first and third array directions, and , respectively. The closest central minima satisfy , hence . Two small subsidiary array maxima occur between adjacent principal directions. The single-slit envelope slightly shifts the true off-axis maxima relative to the nominal principal array angles.
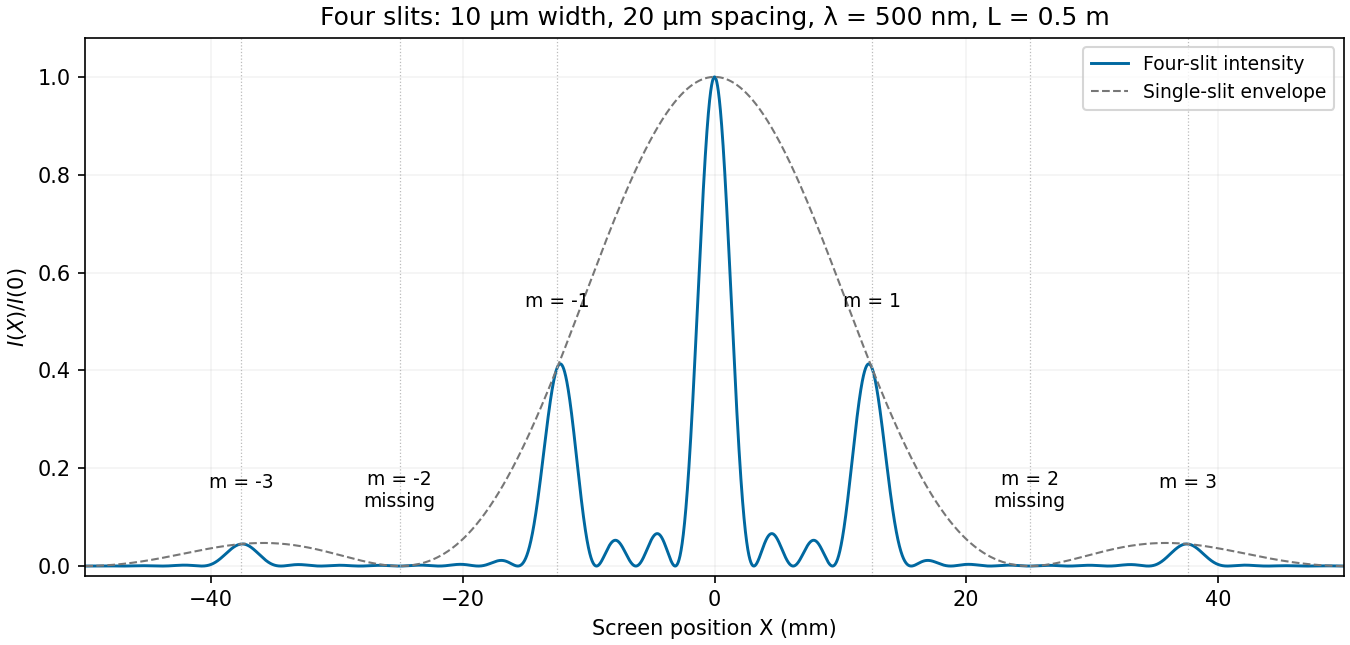
Calculated four-slit intensity across the specified screen, with principal array directions and missing orders marked
. Details. 
Model the two openings as identical axis-aligned rectangles of width in , height in , and centre separation along . Their Fraunhofer diffraction field has the formThe original image shows first broad envelope zeros near and . The horizontal interference period is about ; the first interference minima near distinguish that fine scale from the envelope. The rectangular-aperture dimensions from diffraction zeros are thereforeThe edge-to-edge gap is . The long direction is vertical. These dimensions also explain the suppressed alternate principal array maxima: .
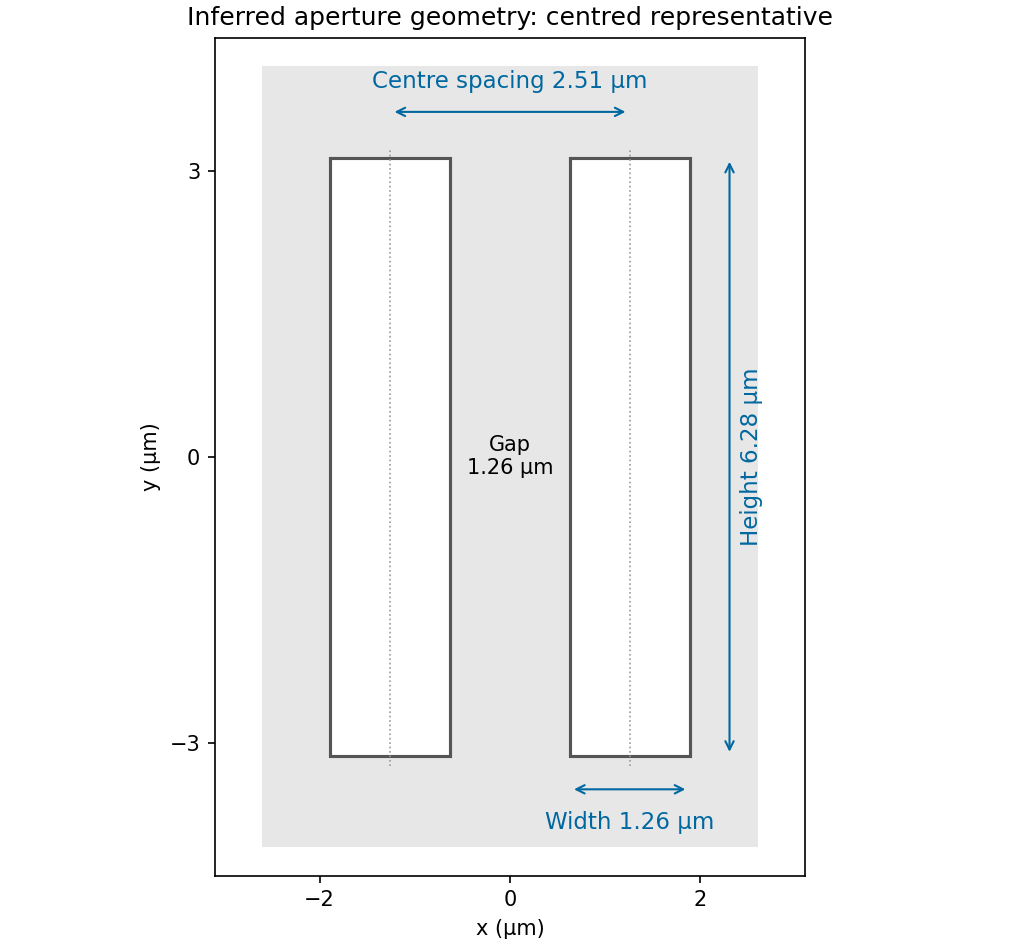
Inferred pair of rectangular openings, quantitatively labelled using the original angular-spatial-wavenumber axes
. Details. 
The factors are required by the stated convention; treating the plotted coordinates as cycles per micrometre would give different dimensions. The finite printed figure supports approximate dimensions. An overall translation and inversion of the aperture pair leave its Fourier intensity unchanged, so their absolute placement is not recoverable; the diagram chooses a convenient centred representative.
A waveguide confines the transverse structure of a wave while permitting propagation along a chosen route. It can deliver energy to a distant receiver without the same geometric spreading as an unguided beam, protect a signal from unwanted coupling, and select transverse normal modes. It also makes propagation paths and coupling to devices more controllable. Confinement does not eliminate wave absorption or scattering loss, and it can introduce wave dispersion and cutoff frequencies of a membrane waveguide or corresponding cutoffs for other wave types.
Two examples are an optical fiber, which guides light by its core-and-cladding refractive index structure, and a hollow electromagnetic waveguide used to carry microwaves between a source and an antenna. A duct for acoustic waves is a further example. Each uses different material and boundary conditions, but the common idea is controlled transverse confinement.
For the trial displacement , direct differentiation givesThe two-dimensional wave equation is therefore satisfied ifHere is the longitudinal wavenumber, the transverse wavenumber, and the speed of an unconstrained membrane wave. The physical displacement is the real part, multiplied by an arbitrary displacement amplitude. has units and is surface mass density in , so has units as required.
The fixed edge at is automatically satisfied by . At , the displacement must vanish at every , so . Thus the allowed transverse normal modes haveThe case gives zero displacement for this sine solution and is not a physical propagating mode. Negative only reverses the amplitude sign and does not create a distinct transverse mode. This discrete transverse spectrum is a consequence of the Dirichlet boundary conditions, rather than quantization of the longitudinal wavenumber in an indefinitely long guide.
For the th transverse mode, substitute into the membrane waveguide dispersion relation:Longitudinal propagation requires real nonzero , henceBelow the cutoff frequency of a membrane waveguide, , with , and a bounded excitation decays as rather than carrying a travelling wave along an infinite guide. At equality , the displacement has no longitudinal phase advance and the group velocity is zero; it is a cutoff oscillation, not a propagating mode carrying finite longitudinal power.
For positive angular frequency, the first three branches areEach branch is even in , has minimum , and starts with zero slope. At large , all approach the straight asymptote . Their group velocities are , whereas their longitudinal phase velocities are for , giving .
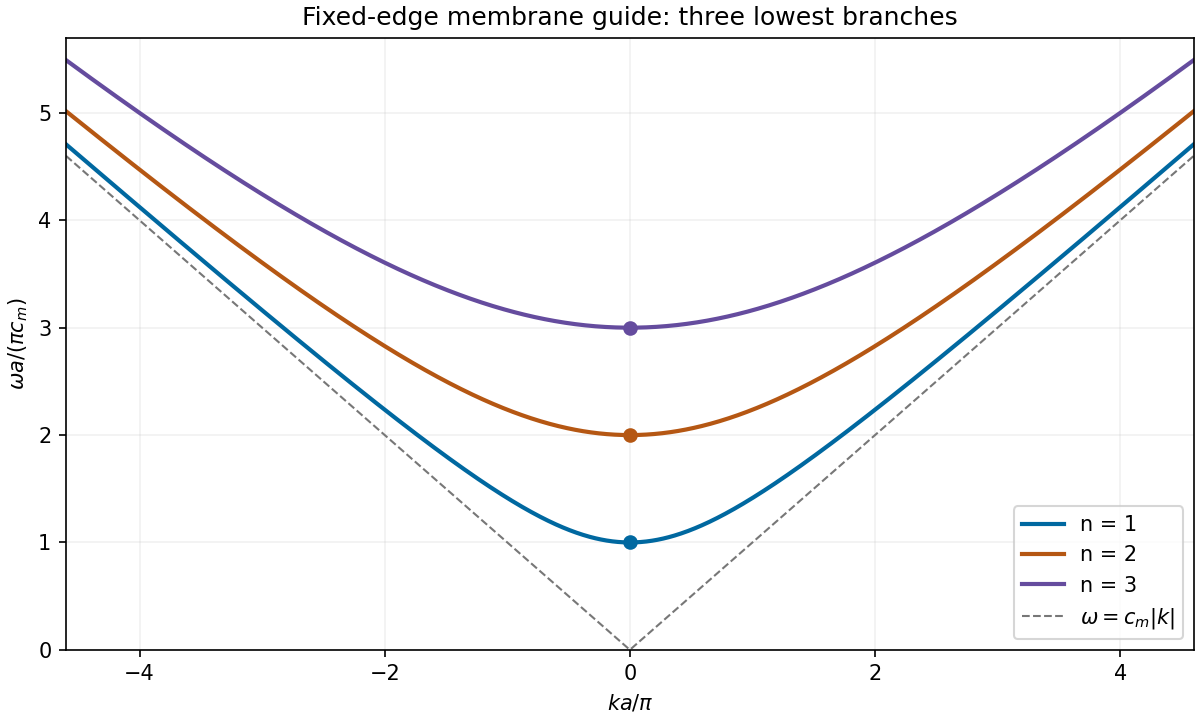
Three lowest membrane-waveguide dispersion branches, with their cutoffs and common large-wavenumber asymptote
. Details. 
Resistance to bending adds a restoring contribution that grows more rapidly with spatial curvature than the tension contribution. Short-wavelength modes are therefore stiffened especially strongly, raising their frequencies and changing the large-wavenumber behaviour.
For example, a thin plate of flexural rigidity has . When its edge conditions admit the same sine transverse mode, bending stiffness in a membrane waveguide givesThus the cutoffs increase, and bending-dominated propagation has at large , rather than approaching . Its phase velocity and group velocity then grow with . If “rigidly fixed” means a genuinely clamped plate edge, the slope must also vanish and the mode shapes change; the qualitative stiffening and stronger wave dispersion remain, but simple need not remain exact.
A Bravais lattice is the set of positions generated by integer combinations of independent primitive translation vectors, . Every lattice point has the same translational environment. A crystal may additionally have a basis of several atoms attached to each lattice point; those atoms are not automatically separate points of its Bravais lattice.
A unit cell is a region whose translated copies fill the crystal without gaps or overlaps. It can be chosen for convenient symmetry, and a conventional cell may contain several lattice points. A primitive unit cell is a smallest such repeating cell, containing exactly one lattice point when boundary sharing is counted. Its shape is not unique, but its volume is fixed for a given lattice. For a monatomic Bravais crystal, each primitive cell contains one atom.
Interpret the sphere as an atom of iron, and assume neighbouring atoms touch without overlap. Its radius is , and its mass is , using atomic mass unit .
In the face-centered cubic lattice, atoms touch along a face diagonal: , so . Four atoms occupy a conventional cube. The hard-sphere atomic volume in cubic lattices therefore givesIn the body-centered cubic lattice, atoms touch along the body diagonal: , so . There are two atoms per conventional cube, givingThese are primitive unit cell volumes, not the volumes of the conventional cubes or of the atomic spheres. The denser FCC contact packing gives the higher mass density in this fixed-radius model. Actual hot phases have temperature-dependent dimensions and bonding, so these numbers should not be treated as exact experimental phase densities.
The reciprocal lattice is the set of wavevectors satisfying for every direct Bravais lattice translation . Equivalently, is an integer multiple of . It describes the spatial periodicities that can produce coherent Bragg scattering.
For direct primitive vectors and oriented cell volume , the primitive reciprocal vectors areThey obey , and every reciprocal vector is an integer combination of them. Their units are inverse length. The reciprocal primitive cell volume is , so expanding a direct lattice contracts its reciprocal scale.
The direct body-centered cubic lattice has a face-centred cubic reciprocal lattice, whereas the direct face-centered cubic lattice has a body-centred cubic reciprocal lattice. Thus the reciprocal lattice change in a structural phase transition reverses the two cubic types: the reciprocal lattice changes from FCC to BCC when the real material changes from BCC to FCC. If the direct conventional side is , the reciprocal conventional side is in either case, with the appropriate phase-specific .
Within one phase, ordinary thermal expansion increases direct spacings and decreases reciprocal spacings. At the structural phase transition, reciprocal points acquire the new symmetry and allowed positions. A first-order transformation may show both phases simultaneously and may create differently oriented domains; it need not continuously preserve one perfect reciprocal array throughout.
Using the fixed-radius estimates from part (b), , so the reciprocal primitive cell volume would increase by about . That comparison belongs to the ideal contact model. The question supplies neither the actual thermal expansion nor a crystallographic orientation relationship, so it does not determine a unique trajectory of individual reciprocal points during the transition.
Use temperature-dependent X-ray diffraction, with the crystal in a controlled heating stage and a detector measuring diffracted directions. A reflection occurs when the scattering wavevector matches a reciprocal lattice vector, or equivalently when Bragg's law is satisfied. Record peak positions and intensities while heating to infer changes in lattice spacings and structure.
A monatomic conventional BCC cell has nonzero crystal basis structure factor only when is even. For FCC the indices must be all even or all odd. The change in reflection selection and peak positions therefore distinguishes the phases. For instance, BCC starts with a family whereas FCC starts with , when indexed in their own conventional cells.
The transformation can create multiple orientation variants, grains, strain and phase coexistence. A reciprocal point that formerly satisfied the diffraction geometry may disappear or move off a fixed detector; a loss of one spot alone does not identify the new phase. Thermal expansion shifts peaks, thermal motion weakens coherent intensities, and hot iron may oxidize without a protective atmosphere.
After transformation, scan crystal angle and scattering angle or use an area detector to locate the new reflections. If single-crystal order has been lost, powder X-ray diffraction or a sufficiently broad orientation survey collects rings or many grain reflections instead of relying on the original alignment. Index several new peaks using the FCC selection rule and fit their common lattice parameter; this probes the new structure even when the original crystal orientation is no longer usable.
The quantum free electron model treats conduction Electrons as independent particles moving in an approximately constant potential, with parabolic dispersion relation . Fermi-Dirac statistics successfully explains important features such as a Fermi energy and a small electronic heat capacity, but a constant potential gives no band gaps and cannot by itself explain why different band fillings produce metals, semiconductors and band insulators. It also misses lattice-dependent effective masses, detailed directional responses and the topology of real Fermi surfaces. Scattering and finite electrical resistivity require additional physics.
The nearly-free electron model introduces a weak periodic lattice potential. Bloch's theorem replaces individual free plane waves by Bloch states, and Fourier components of the potential mix plane waves whose wavevectors differ by a reciprocal lattice vector. Near degeneracy at a Brillouin zone boundary, this coupling opens a band gap; for a two-wave crossing its size is . Away from the crossing, energies remain close to free-particle values. Band curvature produces band effective masses, and band filling determines whether the Fermi energy lies inside an allowed band or a gap.
The improvement is the inclusion of lattice periodicity, rather than a switch from classical to quantum statistics: the quantum free electron model already uses Fermi-Dirac statistics. The strong delta barriers in the later numerical example are treated exactly by the Kronig-Penney model, rather than by assuming that their strength is perturbatively small.
A Bloch state on the loop has , with . Its circumference is , so . Single-valuedness after one complete circuit requires the periodic boundary conditionThereforeThe allowed Bloch wavevectors are spaced by . Values of differing by label the same crystal momentum modulo a reciprocal lattice vector, so there are inequivalent choices in one Brillouin zone. In this notation is the Bloch wavenumber, not a dimensionless phase; is dimensionless. Spin gives additional states but does not alter this condition.
Between delta barriers, and the Schrödinger equation gives , with for positive energy. Write the state and derivative as a two-component vector . Free propagation across one interval of length isThe wavefunction is continuous at a delta barrier, while its derivative jumps by , with . Thus the barrier matrix isBloch's theorem requires . Both and have determinant one, so the two eigenvalues of are and . Taking its trace givesTherefore the Floquet discriminant of the delta-comb Kronig-Penney model yieldsThis trace argument is the one-cell transfer method for the Kronig-Penney model. The loop imposes the additional discrete values of derived in part (b). Real requires the right-hand side to lie in , giving allowed energy bands; values outside this range are band gaps. The strength has units of energy times length, because a Dirac delta distribution has units of inverse length.
With length measured in units of , plot the real functionOnly the portions with can equal , so the strip between the horizontal lines and identifies allowed energy bands. The band edges of a repulsive delta-comb potential have the following approximate first intervals:Each interval corresponds to energy ; the intervening intervals are forbidden. The exact upper endpoints follow from . The lower endpoints solve inside . The divergence suggested by at the origin is removable, and , so there is no zero-energy state in the repulsive model.
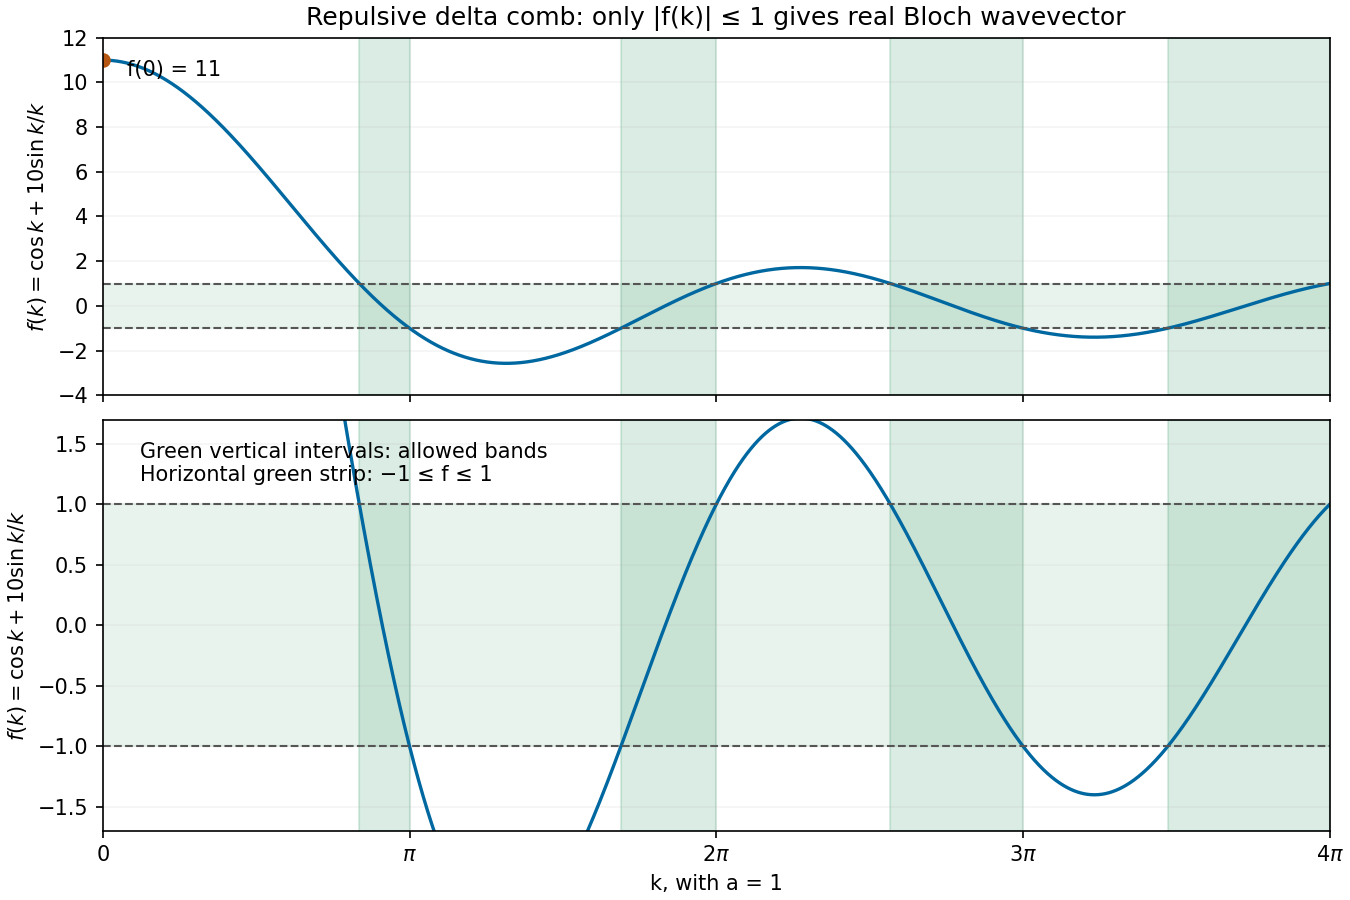
Calculated delta-comb discriminant for barrier strength 10, with allowed bands marked by the strip between minus one and plus one
. Details. 
The periodic barriers produce separated energy bands and band gaps, unlike the continuous free-particle spectrum. A finite -atom loop has discrete states within these bands. Whether the material conducts still depends on band filling: one Electron per primitive cell half-fills a spin-degenerate band, while two Electrons per cell can fill the first band and place the Fermi energy in a gap. Band gaps alone do not establish that every filling is insulating. At high , the perturbing term becomes relatively small and the spectrum approaches free-electron behaviour in relative terms.
A wave propagates an organized disturbance through space. What oscillates depends on the medium: displacement in a string or solid, pressure and density in a fluid, electric fields and magnetic fields in an electromagnetic wave, or a quantum wavefunction. The propagation law follows from the restoring mechanism, inertia and relevant boundary conditions. A common linear equation is , whose plane waves obey . The resulting phase velocity and group velocity coincide, so a narrow wave packet can travel without dispersive spreading. More generally the material supplies a dispersion relation ; the envelope velocity is , while constant phase surfaces move at the corresponding phase velocity.
Mechanical waves make the balance of restoring force and inertia particularly visible. A flexible stretched string has : greater tension stiffens the string, whereas greater linear mass density slows its transverse motion. Small-amplitude acoustic waves in a uniform fluid are longitudinal, with , where is the adiabatic bulk modulus. For an ideal gas, . Pressure changes in rapid sound oscillations are approximately adiabatic because little heat crosses a wavelength in one period. Fluids do not support ordinary bulk shear waves, whereas an elastic solid supports both longitudinal and transverse waves. In an isotropic solid their speeds are and , where is the shear modulus.
A material can be dispersive even when its equilibrium properties are uniform. In a liquid with a free surface, gravity and surface tension act as restoring mechanisms. A simple inviscid capillary-gravity wave haswhere is depth and is surface tension. Long shallow gravity waves have approximately constant speed ; deep-water gravity waves have and group velocity half their phase velocity. Short capillary waves have a different dispersion dominated by surface tension. Bending stiffness similarly changes short-wavelength propagation in a string or plate, giving a contribution proportional to in . Different restoring mechanisms can therefore control different wavelength ranges of the same medium.
Electromagnetic waves propagate in vacuum without material displacement, because Maxwell equations couple changing electric and magnetic fields. They are transverse and travel at . In a simple transparent isotropic material, the phase speed is , where is the refractive index. Real material polarization depends on frequency. A Lorentz oscillator model for bound charges explains why permittivity and refractive index become strongly frequency dependent near material resonances, accompanied by absorption. In a birefringent medium, different field polarizations have different propagation constants, permitting wave plates and mode-dependent delays. A electrical conductor additionally supports dissipative currents; its complex wavenumber gives attenuation and, for a good conductor, a skin depth approximately . Energy removed from the wave becomes heat rather than disappearing.
At an interface, frequency is conserved for stationary media, and tangential wave phase must match. These conditions give Snell's law for refraction and constrain reflected and transmitted directions. Amplitudes follow from continuity of the appropriate fields or mechanical forces. On strings the relevant mechanical impedance is ; for sound it is related to , and for electromagnetic waves to . A mismatch gives wave reflection, and a lossless boundary conserves the total incident, reflected and transmitted power. Multiple reflections can reinforce or cancel, as in a Fabry–Pérot etalon. Total internal reflection and other boundary conditions confine waves in waveguides. Transverse modes then become discrete, and even an otherwise nondispersive material develops longitudinal cutoffs and wave dispersion. A membrane strip, for example, obeys .
Propagation also involves transport and loss. The Poynting vector gives electromagnetic energy flux; mechanical energy transport is force or pressure times velocity, averaged over a cycle. Wave absorption, viscosity, electrical resistance and imperfect boundaries dissipate energy. Scattering redistributes energy into other directions and modes, while geometric spreading reduces local intensity without necessarily dissipating anything. These mechanisms should be distinguished when interpreting a decreasing measured amplitude. In strongly absorbing or rapidly varying dispersive regimes, the derivative called group velocity is not automatically the speed of a sharp signal front; pulse reshaping and the medium's causal response must be considered.
Finally, quantum matter waves illustrate how the same propagation mathematics can describe a different physical quantity. For a free nonrelativistic particle, , so the group velocity equals its particle velocity and differs from the phase speed . In a periodic crystal, Bloch's theorem replaces the free dispersion by energy bands. Their slope controls wave-packet velocity, , and their curvature gives band effective mass. Thus mechanical confinement, material response and microscopic periodicity all reshape propagation through their allowed modes and dispersion, while the physical interpretation of the wave and its transported quantities remains essential.
The Hall effect is a transverse electric response to a magnetic force on moving charge carriers. Take conventional current density and magnetic field in a conducting slab. For one carrier type of number density and signed electric charge , the drift velocity is . Carriers initially deflect sideways until a Hall electric field balances the magnetic Lorentz force:The Hall coefficient is thereforeFor Electrons it is , whereas a simple hole-dominated conductor gives . The sign reveals the effective carrier sign; the magnitude estimates their density in the one-carrier approximation.
For width along and thickness along , . Define the signed Hall voltage by , namely the electric potential at the lower- edge minus that at the higher- edge. ThenThis explicit contact convention fixes the voltage sign. A Hall bar with longitudinal and transverse contacts measures both electrical resistivity and the Hall response. Reverse the field and take the part of the transverse voltage odd in to suppress longitudinal-voltage pickup from misaligned contacts; reversing current provides another useful check.
A Hall measurement is useful for carrier identification, semiconductor doping measurements and magnetic-field sensing. Combining a one-carrier with electrical conductivity gives a mobility magnitude . However, mixed Electron and hole conduction is not described by a single density: in weak fields,The response weights mobilities differently from ordinary conductivity. Complicated energy bands, anisotropic Fermi surfaces and multiple bands can likewise change the simple interpretation in metals; a positive Hall coefficient does not mean that the material contains positively charged fundamental Electrons.
Semiconductor doping introduces controlled impurities to alter equilibrium carrier populations and electrical conductivity. In an intrinsic semiconductor, thermally excited Electrons in the conduction band and electron holes in the valence band have equal densities . A shallow donor impurity, such as phosphorus in silicon, supplies an Electron from an impurity level just below the conduction-band edge. Once ionized it is positively charged, and the material is n type. An acceptor impurity, such as boron in silicon, accepts a valence Electron into a level just above the valence-band edge, leaving a mobile hole and a negatively charged ionized impurity; the material is p type.
With dopant densities , charge neutrality requiresFor fully ionized, nondegenerate dopants at equilibrium, the semiconductor mass-action law gives . In a substantially n-type sample, , soThe corresponding p-type result is and . The majority population grows while the minority population decreases; adding donors does not simply add equal numbers of free Electrons and holes.
The Fermi energy shifts toward the conduction band for n-type material and toward the valence band for p-type material. In the nondegenerate approximation,where are effective band-edge state densities. At very low temperature, dopants may not be ionized and carrier freeze-out occurs. At intermediate temperatures, ionized dopants dominate the carrier density; at sufficiently high temperature, intrinsic excitation can dominate. Heavy doping can produce degenerate carrier statistics, invalidating these Boltzmann expressions.
The electrical conductivity is . Doping usually raises the majority carrier density, but ionized impurity scattering can lower mobility, so conductivity need not scale indefinitely with dopant concentration. Joining p-type and n-type regions creates a p-n junction, with a depletion region and built-in electric field established by carrier diffusion and compensating drift. The fixed ionized dopants, not an absence of all charge, account for the depleted region's net charge density.
In a metal, mobile Electrons transport heat as well as electric charge. A temperature gradient creates an imbalance between carriers arriving from warmer and colder regions. The resulting heat current obeys Fourier's law for an isotropic material, where thermal conductivity has units . For a bar of area carrying steady heat flow , when parasitic losses are negligible.
A kinetic estimate for the electronic contribution iswhere is the electronic heat capacity per volume, the Fermi velocity, and the heat-transport mean free path. Fermi-Dirac statistics and the Pauli exclusion principle restrict thermal rearrangements to states near the Fermi surface, rather than allowing every Electron to contribute a classical heat capacity. A degenerate parabolic band givesUsing the Drude model form for electrical transport, the relation between thermal and electrical relaxation times in metals becomesFor scattering that relaxes heat and charge currents similarly, and the Wiedemann-Franz law follows:Thus good electrical conductors are usually good thermal conductors. The correct quantum Lorenz number differs from a naive classical electron-gas estimate.
Scattering from impurities, boundaries and phonons limits the heat-transport path. In an impurity-dominated low-temperature regime with approximately constant relaxation time, is approximately proportional to . Where phonon-limited electrical resistivity is proportional to and the Wiedemann-Franz approximation is applicable, can be roughly temperature independent. Inelastic processes can relax heat and charge currents differently, so the Lorenz ratio is not universal at all temperatures. Lattice phonons add a separate positive thermal contribution; the measured total is , and the electronic Wiedemann-Franz expression should not be applied blindly to that total.
Articles by others on the same topic
There are currently no matching articles.