The Gibbs free energy iswhere is enthalpy. For a closed system of fixed composition, with only pressure-volume work, spontaneous relaxation at fixed temperature and pressure cannot increase ; stable thermodynamic equilibrium minimizes it over the allowed states. A loaded piston can move while maintaining the imposed pressure, so the enthalpy term includes the displacement cost. Along a smooth equilibrium branch of fixed composition,Thus its temperature slope at fixed pressure is , while its pressure slope at fixed temperature is . See MIT 5.60, Lecture 13, Gibbs free energy and its derivatives.
Consider two illustrative thermodynamic phases, A and B, of the same substance at one fixed pressure. Write B minus A, using quantities per mole:Treat these differences as approximately constant over a limited temperature window. ThenAt , , so A is preferred. At , , so B is preferred. At , both have equal molar Gibbs free energy, permitting phase coexistence in this bulk model. B's greater entropy outweighs its greater enthalpy above the crossing.
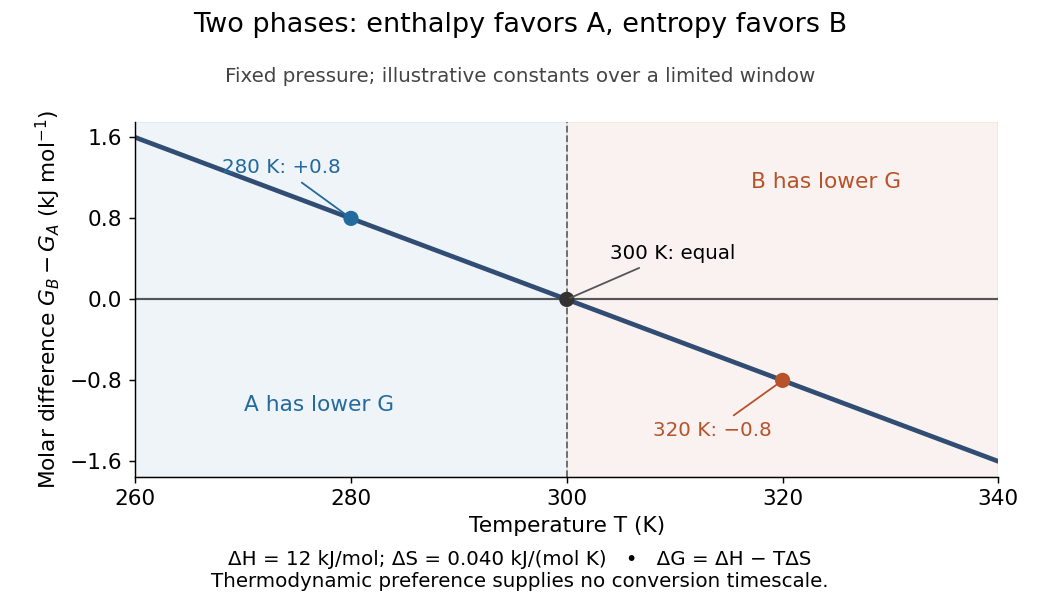
Each plotted point compares alternatives at the same temperature; moving along the curve changes the imposed temperature. The model predicts preference, not instantaneous conversion: nucleation barriers can sustain metastability. Real enthalpy and entropy differences generally vary with temperature through heat capacities, bending this line outside the approximation.
At fixed pressure, the first law of thermodynamics gives under the stated work restriction, so the same thermal reservoir accounting yields . Variable composition restores to ; constrained Gibbs minimization for chemical equilibrium handles those permitted changes.
The historical foundation is Gibbs's [ref]
https://en.wikisource.org/wiki/Scientific_Papers_of_Josiah_Willard_Gibbs,_Volume_1/Chapter_IIIa. On the Equilibrium of Heterogeneous Substances, first part completed in 1876, continued in 1878
. Its equations (87) and (91) introduce the combinations now called Helmholtz free energy and Gibbs free energy, connecting entropy criteria, chemical potentials and phase coexistence within one framework.For a homogeneous extensive simple-compressible phase, implies . A mixture instead obeys . Surface and other nonextensive contributions require extra terms.
At imposed temperature and pressure, with fixed species amounts and only pressure-volume work, increasing total system-plus-reservoir entropy is equivalent to decreasing . Unconstrained particle exchange requires the reservoir chemical potentials to be included; minimizing over arbitrary particle number is a different problem.
For fixed composition and pressure, . Applying the identity to standard reaction quantities connects equilibrium temperature dependence to reaction enthalpy.
The standard free-energy change for moving a species between specified phases or solvents. For a consistently standardized equilibrium distribution coefficient, . Pure-solid lattice dissolution is a separate thermodynamic step.
For the equation of state , integrate along an isotherm. This gives the displayed Gibbs free energy difference. Its negative temperature derivative at fixed endpoint pressures gives . The physically admissible branch must retain positive volume.
For a single-phase ideal gas mixture with molar amounts , common temperature , and pressure , extensivity and ideal mixing giveHere , is the mole fraction, is the molar gas constant, and is the standard pressure. Integrating and including the ideal mixing entropy proves . Reactions can change , so fractions alone do not set the extensive Gibbs free energy. Its composition Hessian is ; it is positive semidefinite by the weighted Cauchy-Schwarz inequality.
For a reaction with stoichiometric changes , varying the reaction extent at fixed temperature and pressure givesEquilibrium requires .
Thermochemical equilibrium requires every chemical reaction to have zero Gibbs free-energy change. For ideal reactants, the equilibrium constant is after standard-state activity factors are included.
At fixed temperature and pressure, a closed reacting system reaches thermochemical equilibrium by minimizing Gibbs free energy over nonnegative species amounts subject to conserved elemental abundances. For an allowed stoichiometric vector , an interior minimum has . More generally the chemical potential vector lies in the row span of the elemental conservation matrix at positive concentrations, with the appropriate one-sided inequalities for absent species. The first law of thermodynamics gives the thermodynamic differential, while the Second law of thermodynamics supplies the minimization direction.
For an elementary reversible reaction, detailed balance gives at equilibrium. Hence the reverse rate coefficient is the forward coefficient divided by the equilibrium constant, with units fixed by the reaction stoichiometry.
Two phases coexist where their molar Gibbs free energies agree. Differentiating that equality along the coexistence curve relates its slope to the entropy and volume jumps.
In the ideal-vapor, incompressible-liquid capillarity approximation, a spherical droplet of radius has the displayed equilibrium vapor-pressure relation. Here is liquid volume per molecule, is surface tension, and is the flat-interface saturation pressure at the same temperature. The Young–Laplace equation raises liquid pressure by , increasing its chemical potential by approximately . Matching this with the ideal-vapor chemical-potential increase proves the formula. The liquid contribution from the vapor-pressure change itself is neglected relative to its curvature pressure, and bulk properties are taken independent of radius. A convex small drop therefore requires a higher ambient vapor pressure than a flat interface.
Condensation in a wetting confined geometry at a vapor pressure below planar-interface saturation. A concave liquid meniscus has lower equilibrium vapor pressure in the capillarity approximation. Gap size, contact angle and surface adsorption affect the actual onset.
A triple point is a temperature–pressure pair at which three distinct bulk thermodynamic phases of a one-component substance coexist in thermodynamic equilibrium. In the familiar solid–liquid–gas case, their three phase coexistence curves meet. Other combinations, such as two crystal polymorphs and a liquid, also qualify: “triple” counts thermodynamic phases, rather than states-of-matter categories.
For the same substance, the chemical potential in each thermodynamic phase must agree:There are two independent equality conditions for two controls, temperature and pressure. Generically they select an isolated pair ; the third pairwise equality follows from the first two. Equivalently, the phase rule gives . This counts independent intensive controls, not phase fractions: changing the amounts of the three thermodynamic phases need not change the ideal bulk temperature and pressure, provided all three remain present. Different sets of crystal polymorphs can give different triple points for the same substance.[ref]
Gibbs Phase Rule (MIT 10.213 course material). Gibbs Phase Rule, three-phase count and pressure–temperature diagram discussion
At a liquid-gas critical point, the two fluid thermodynamic phases instead merge, and their mass density difference and latent heat vanish. It is the endpoint of the liquid–gas phase coexistence curve, rather than a meeting of three distinct thermodynamic phases. The regular independent-equality count used for a triple point cannot explain this merger. A triple point can retain finite mass density and entropy differences between all three thermodynamic phases.[ref]
Statistical Physics by David Tong. §5.1.2, printed p. 141: vanishing liquid–gas discontinuity at the critical point; Figure 41 separates it from the three-phase junction
A triple-point cell turns phase coexistence into a reproducible reference for thermometer calibration. The NIST water-cell demonstration uses a sealed glass vessel containing water of specified isotopic composition and an open central thermometer well. Cooling this well with solid carbon dioxide and alcohol freezes an ice mantle while leaving liquid water and its vapor. The coolant is outside the sealed sample; the sample's vapor space does not communicate with room air.[ref]
Triple-Point Cell (NIST demonstration). Triple-Point Cell, preparation description, uploaded 21 December 2016
In the actual NIST cell-comparison experiment, newly frozen mantles were compared with an aged reference mantle in a controlled maintenance bath. A warm aluminium rod melted a thin inner layer around the well, allowing the mantle to rotate freely and establishing an ice–water interface close to the sensor. A standard platinum resistance thermometer and a resistance bridge measured the electrical resistance ratio to a calibrated, temperature-controlled reference resistor. Readings at two currents permitted extrapolation to zero electrical power, correcting self-heating; measured immersion depths supplied hydrostatic pressure corrections. Comparing preparations over time tested stabilization rather than assuming freshly frozen ice was ready.[ref]
Effects of different methods of preparation of ice mantles of triple point of water cells on the temporal behaviour of the triple-point temperatures by G. T. Furukawa and others. Furukawa, Mangum and Strouse, Effects of different methods of preparation of ice mantles of triple point of water cells on the temporal behaviour of the triple-point temperatures (1997), Abstract, §1 and §§3.2–3.5: aged reference, inner melt, bridge readout, zero-power and hydrostatic corrections
The inference is a reproducible fixed-point response for the thermometer, not a direct reading of three chemical potentials. The reference cell anchors the comparison; a water point alone does not determine a thermometer's response at every other temperature. The ideal argument excludes impurity and isotope variation, finite interface effects and unintended heat transfer; real cells also require adequate immersion and stable electrical references. Repeatability is evidence that these effects are controlled, not a reason to omit their uncertainty.
Since 20 May 2019 the kelvin has been defined through a fixed numerical value of the Boltzmann constant. The thermodynamic temperature of the water triple point is consequently a measured quantity with uncertainty, rather than an exact value imposed by the kelvin definition. Its continued use as an assigned reference on the International Temperature Scale of 1990 is a separate convention.[ref]
On the revision of the International System of Units (SI), 26th CGPM Resolution 1 (2018). Resolution 1 of the 26th CGPM (2018), effective date; Appendix 2, third bullet; Appendix 3, kelvin definition
[ref]The International System of Units (SI), ninth edition, SI Brochure. §2.3.1: practical temperature scales and ITS-90
The equilibrium pressure of a vapor in contact with its liquid or solid at a specified temperature. For pure liquid–gas phase coexistence with negligible interface effects, it is the pressure on their phase coexistence curve. In a gas mixture, distinguish the component's partial pressure from the total pressure; the pure-substance Integrated Clausius-Clapeyron relation does not describe the total pressure of arbitrary humid air.
The Antoine equation is an empirical vapor pressure fit whose coefficients depend on the pressure and temperature units and on a stated validity interval. Its slope is . In the ideal-vapor Clausius-Clapeyron approximation, this implies latent heat . An accurate pressure fit need not give an equally accurate derivative; extrapolation to the liquid-gas critical point cannot replace the full Clausius-Clapeyron relation.
At fixed temperature, choose a coexistence pressure such that the gas and liquid have equal chemical potentials. Because , this gives , or equivalently . The equal areas replace the unstable part of an isotherm by a horizontal coexistence segment.
The equal-area condition is naturally in volume per particle . In number density , it becomes . Unweighted area in a pressure-versus-density plot is not the Maxwell construction.
A phase diagram partitions a space of thermodynamic variables into regions occupied by different equilibrium thermodynamic phases and records the phase coexistence curves between them. For a pure, one-component substance, a pressure–temperature phase diagram gives one point for each pair . In a single-thermodynamic phase region both controls can vary independently. On a two-thermodynamic phase phase coexistence curve, they obey one relation; at a triple point, both are fixed. These statements assume bulk thermodynamic equilibrium, fixed composition and no additional applied fields.[ref]
Gibbs Phase Rule (MIT 10.213 course material). Gibbs Phase Rule, single-, two- and three-phase counts and final pressure–temperature diagram paragraphs
At fixed temperature and pressure, the stable bulk thermodynamic phase minimizes Gibbs free energy for a fixed amount of substance. For a pure substance this is a comparison of chemical potentials on a common normalization. Two candidate thermodynamic phases coexist where and neither is exceeded in stability by a third thermodynamic phase. Differentiating their equality gives the Clapeyron equation. Thus a phase coexistence curve is a locus of equal stability, rather than a trajectory that every heated sample must follow.[ref]
The following original cartoon uses dimensionless positive coordinates and , with arbitrary reference scales . It represents no particular substance and contains no measured data. Stipulate a triple point at , a liquid-gas critical point at , and these drawing rules:They specify sublimation, liquid–gas phase coexistence and melting boundaries for the picture. They are not an equation of state, do not predict latent heat or mass density, and do not supply a quantitative critical theory. In particular, the melting slope is merely an illustrative choice.
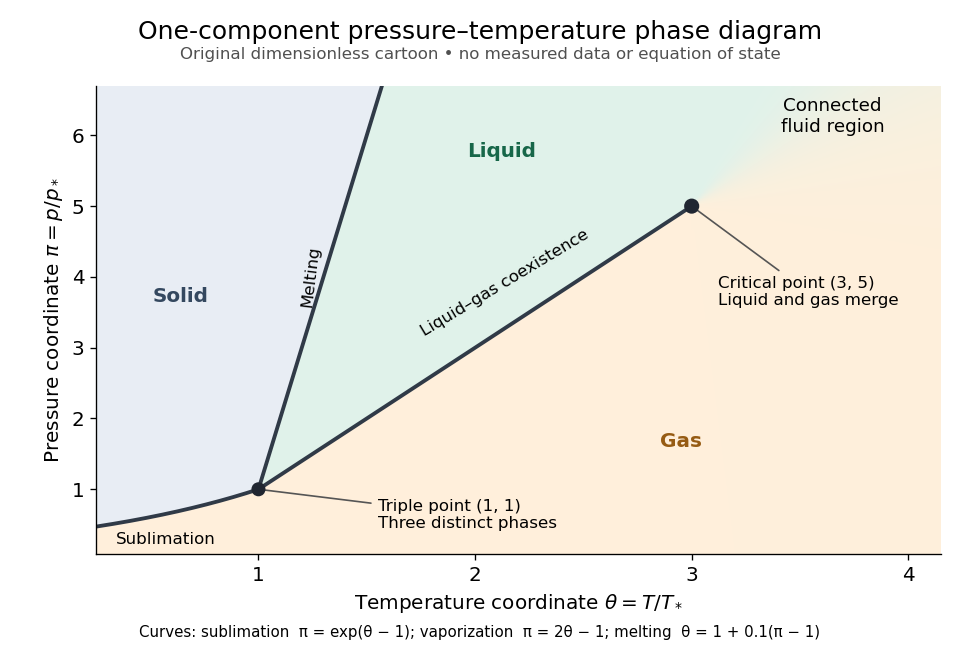
Generic dimensionless pressure–temperature phase diagram: curves, triple point and liquid-gas critical point
. Original cartoon with stipulated drawing rules. Three distinct bulk thermodynamic phases coexist at ; the liquid–gas boundary ends at . The fluid region beyond that endpoint is connected: no extra boundary is implied by the fading background. These coordinates are not water data. Details.For example, at fixed the melting boundary is at and the liquid–gas boundary is at . Heating from to therefore starts in liquid, crosses phase coexistence at , and ends in gas. In an equilibrium conversion at that crossing, added heat can change the phase fraction at fixed temperature through latent heat. The pressure–temperature point alone does not specify how much of each thermodynamic phase is present: for that one needs an additional amount or volume constraint.
Now connect exactly the same endpoints by raising from to at , moving to at , then lowering to . The first leg stays on the liquid side because ranges only from to and . The second leg lies above the entire liquid–gas boundary, whose largest drawn pressure coordinate is ; the third lies beyond its largest temperature coordinate, . No leg crosses a first-order phase transition boundary. The middle leg passes through a supercritical fluid region, with and , and the final leg returns to a gaslike state continuously.
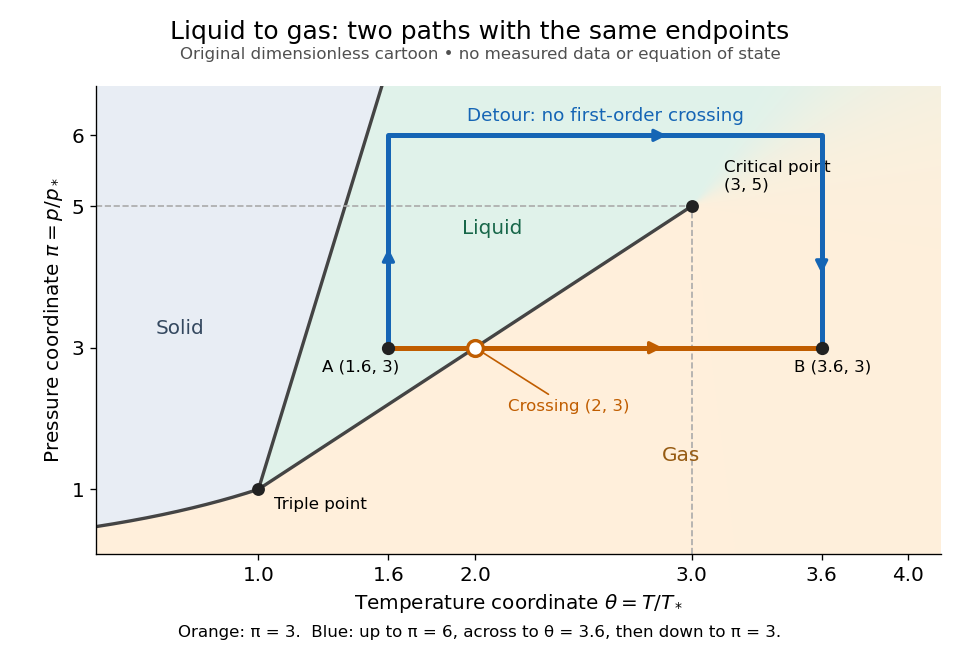
The same liquid and gas endpoints: crossing phase coexistence or going around the liquid-gas critical point
. Original dimensionless cartoon. The orange constant-pressure path crosses the liquid–gas boundary at . The blue path follows to to to and avoids every drawn phase coexistence curve. Dashed coordinate guides locate the critical endpoint without representing additional boundaries. Details.Avoiding a first-order phase transition does not mean that no heat or work is exchanged. Along the detour, mass density, enthalpy and heat capacity may change substantially but continuously. The liquid-gas critical point itself has singular behavior, so the detour goes around it rather than through it. This connected fluid region is the striking lesson of a phase diagram: a familiar change from liquid to gas need not involve boiling across a sharp boundary.
An equilibrium phase diagram also does not predict how rapidly a conversion occurs. Metastability and a barrier described by classical nucleation theory can delay the observed phase transition. Nor should a binary-composition phase diagram be read as the same picture: its coexistence regions and lever rule encode composition and phase fractions, and can occupy an area even though pure-substance two-thermodynamic phase coexistence occupies a curve in the pressure–temperature plane.
A diagram of stable mineral assemblages as functions of specified aqueous thermodynamic activities, at fixed temperature and pressure. The coordinates often use logarithmic activity ratios. Mass-action equations give pairwise coexistence lines; a line segment is stable only when no omitted mineral has a lower relevant thermodynamic potential under the same imposed chemical potentials.
Suppose a reference mineral can dissolve to either or , with the same conserved solid component, and normalized Gibbs energies of reaction and for . Choose relative solid potentials , and . The stable state minimizes . Thus is stable above ; is stable below where ; and is stable below where . The – coexistence line is stable below their triple intersection and metastable above it. These inequalities follow directly from the sign of each forward dissolution reaction. Reversing reaction directions reverses the corresponding sign convention, so one must establish the reaction direction before choosing an upper or lower envelope.
A pairwise equilibrium line restricted to conditions where both minerals are stable against the other allowed phases. Compute the Gibbs energy of reaction for independent conversions to compare them. A pairwise line can continue into a region where a third mineral is favoured; this continuation is a metastable equilibrium relation, rather than a boundary of stable fields.
Suppose two dissolution reactions to a reference mineral have been normalized to the same amount of a conserved reference component. After division by the same positive energy factor, let their Gibbs energies of reaction be and . Their relative thermodynamic potentials can then be written as displayed. The stable mineral has the smallest potential.
It follows that is stable below , mineral 1 is stable where and , and mineral 2 is stable where and . The two nonreference minerals coexist stably where . Their equality below that height is a metastable continuation. This comparison proves the stable lower envelope and selects which portions of the pairwise mass-action lines belong on the mineral activity diagram.
A boundary giving the equilibrium limit of one solid solution against coexistence with another solid phase. Moving along a solvus during cooling changes equilibrium solid compositions even after all liquid has disappeared.
The lower endpoint of a two-liquid coexistence region. In the lower-critical case, demixing can be induced by heating above the endpoint.
The upper endpoint of a two-liquid coexistence region in a temperature-composition diagram. In the ordinary upper-critical case, heating above this temperature removes liquid-liquid demixing.
The phase rule counts independent intensive controls compatible with coexistence of distinct bulk thermodynamic phases made from independent components:Here counts thermodynamic phases, not pressure, and does not count phase fractions. For the nonreacting one-component case, and : a single thermodynamic phase occupies a region with , two-thermodynamic phase coexistence a curve with , and a triple point an isolated point with . Fixing pressure externally removes one adjustable control wherever that constraint is independent.[ref]
Gibbs Phase Rule (MIT 10.213 course material). Gibbs Phase Rule, displayed nonreacting rule and pure-substance table
For an elementary count without chemical reactions, take chemical species. Each thermodynamic phase has independent composition fractions, since they sum to one. Shared temperature and pressure add two controls, giving . Equality of each species' chemical potential between one reference thermodynamic phase and the other thermodynamic phases supplies constraints. Subtraction gives . This argument assumes the constraints are independent and treats interfaces as negligible; chemical reactions, external fields or critical mergers require appropriate qualifications.
The solidus bounds the entirely solid equilibrium region of a phase diagram. For a linear liquidus and a constant segregation coefficient , the corresponding solidus is . The concentration argument is the solid concentration, not the neighboring liquid concentration.
The lever rule finds phase fractions from a horizontal tie line on a phase diagram. For solid and liquid concentrations and bulk concentration , conservation gives . Thus is the liquid fraction, provided . For pure solid, .
A bicritical point is where two continuous transition lines and a first-order line meet, typically separating a disordered phase from two competing ordered phases.
The liquidus is the locus in a phase diagram above which the equilibrium state is entirely liquid. In a dilute binary solution it is often approximated locally by a linear relation such as .
Freezing-point depression is the lowering of a solvent's equilibrium freezing temperature by dissolved solute. In the linear dilute approximation, with .
An eutectic system has a composition and temperature at which a liquid is in equilibrium with two distinct solid phases. Cooling liquid of that composition through the eutectic temperature produces both solid phases together.
The transformation in which one liquid produces two solid phases at a binary eutectic composition and temperature under fixed pressure. The resulting two-phase constituent must be distinguished from either individual thermodynamic phase.
The invariant liquid-plus-two-solids equilibrium of a binary eutectic system at fixed pressure. It specifies both the eutectic temperature and the eutectic composition.
A two-solid microstructure formed by the coupled transformation of liquid at a eutectic point. Lamellae and rods are common morphologies. A hypoeutectic alloy can contain both primary crystals and a eutectic microstructure; those microconstituents are not the same accounting categories as its total phase fractions.
The fraction of an alloy that solidifies through the eutectic reaction, equal to the remaining liquid fraction immediately before that reaction in a simple equilibrium solidification path. It differs from the total fraction of either solid phase, and later precipitation can change the phase inventory.
The eutectic composition is the liquid concentration at the eutectic temperature, where liquid and two solid phases coexist. It is a composition coordinate on a phase diagram, not the overall concentration of every sample in an eutectic system.
The eutectic temperature is the temperature of simultaneous liquid–two-solid phase coexistence in an eutectic system. In directional freezing of a solution away from the eutectic composition, a mushy layer can end at this temperature, where its remaining liquid solidifies.
At a first-order phase transition, the Gibbs free energy is continuous while at least one first derivative, such as entropy or volume, jumps. A nonzero entropy jump produces latent heat .
A smooth scalar Landau free energy can end a two-phase phase coexistence curve by merging two minima and their intervening maximum. At a generic stable endpoint, its first three derivatives vanish and its fourth derivative is positive. A field shift and two mixed control parameters reduce the local form to a quartic Landau free energy; the order-parameter jump then vanishes and the magnetic susceptibility diverges. This conclusion assumes there is no competing third phase and that the endpoint lies inside the control-parameter domain. It is not a general theorem about every first-order line: a sextic potential with fixed negative quartic coefficient has a symmetry-related ordered coexistence line that ends at a triple point with a finite jump.
Classical nucleation theory balances the positive surface free energy of a droplet against its negative bulk free-energy gain. In three dimensions,has critical radius and barrier .
In the spherical capillarity approximation, the nonzero maximum of lies at when . Smaller nuclei tend to shrink and larger ones tend to grow. Surface anisotropy and molecular-scale structure limit the approximation.
The maximum free-energy cost along a nucleation pathway, at its critical nucleus. A pathway with fixed shape is a constraint and need not coincide with an unconstrained saddle point.
A cylindrical model nucleus of diameter and height . Its free energy is , where is the signed bulk free-energy change per volume.
A critical nucleus is the unstable droplet at the maximum of the nucleation free energy. Smaller droplets shrink, while larger droplets lower their free energy by growing.
Thermal crossing of a nucleation barrier has rate proportional to and mean waiting time proportional to , up to a kinetic prefactor.
Latent heat is the heat absorbed or released in a first-order phase transition through its entropy jump. For an equilibrium conversion from thermodynamic phase to thermodynamic phase at fixed pressure, evaluate both thermodynamic phases at the same temperature and pressure on their phase coexistence curve:Use one normalization throughout: , and may all be per mole, giving in , or all per unit mass, giving in . Here is entropy and is enthalpy on that basis. Equal Gibbs free energies of the coexisting thermodynamic phases give . Identifying this enthalpy difference with supplied heat assumes a closed system and an equilibrium conversion with only pressure-volume work. [ref]
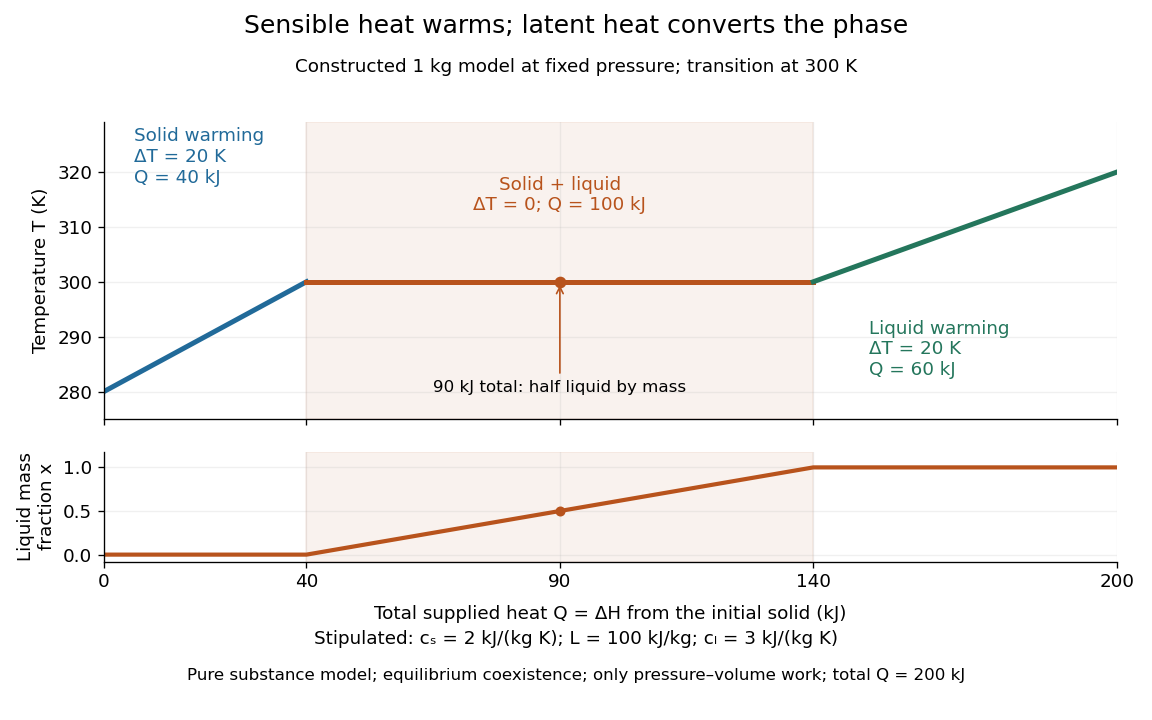
For a pure substance with positive latent heat per unit mass , let be the phase fraction of the higher-enthalpy thermodynamic phase, measured by mass. While both thermodynamic phases coexist at the fixed pressure,Adding heat changes rather than the temperature; this creates the horizontal portion of a heating curve. Once , additional heat raises the temperature according to specific heat capacity at constant pressure. Reversing the conversion releases heat. The plateau represents changing enthalpy, rather than a finite single-thermodynamic phase heat capacity satisfying . [ref]
For a constructed fixed-pressure model, take , initial temperature , transition temperature , solid specific heat capacity at constant pressure , latent heat , and liquid specific heat capacity at constant pressure . These are stipulated model parameters, not empirical properties of a named material. Heating the solid to takes of sensible heat; converting it fully to liquid takes another of heat; heating the liquid to takes . The total is . After a total heat input of , and the temperature is still . The corresponding per-unit-mass entropy jump is .
A continuous phase transition has no latent heat. Its heat capacity can have a jump or a singularity without a finite interval in which added heat converts coexisting thermodynamic phases at a constant temperature. A heating plateau therefore requires the stated phase coexistence conditions; it is not a feature of every phase transition. [ref]
Statistical Physics by David Tong. Tong, Statistical Physics, first-order and continuous transitions
The energy per unit mass required to change a saturated liquid to vapour at a stated pressure and coexistence temperature. In a steam-condensation calorimetry experiment, sensible cooling of the condensate must be subtracted from the measured receiver heat gain.
The Stefan number compares sensible heat with latent heat per unit mass. Some solidification literature uses its reciprocal as the Stefan parameter, so the defining formula must accompany the convention.
The latent-to-sensible heat ratio is the reciprocal of the Stefan number defined by . Large means that phase change uses much more energy than changing temperature by .
The Clapeyron equation connects the slope of a phase coexistence curve to the latent heat and the change in volume during a first-order phase transition. A steep boundary can indicate a large latent heat, a small change in volume, or both. This lets a measured boundary constrain caloric properties and predicts how changing pressure shifts a melting temperature.
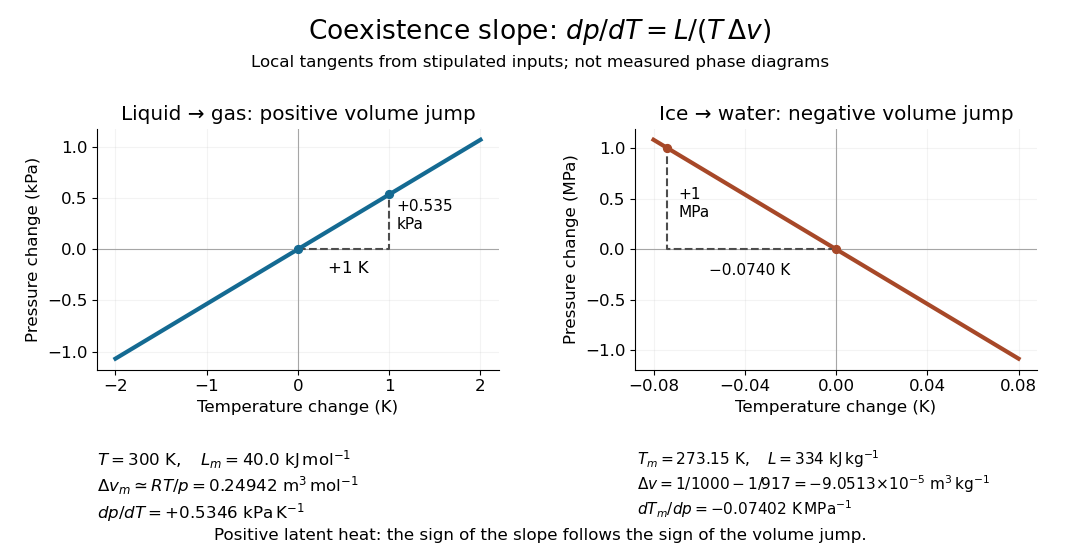
For a pure substance in bulk phase coexistence, label the initial and final thermodynamic phases and . Both have the same absolute temperature , pressure , and chemical potential. With , , and denoting entropy, enthalpy, and volume on one common basis, define , , and . ThenThe derivative follows the phase coexistence curve; it is not a partial derivative within one thermodynamic phase. Use molar volume with molar latent heat in , or specific volume with latent heat in . Both give in . For molar mass , and , so the predicted slope is independent of the chosen basis. This formulation assumes a simple compressible system, fixed composition, and negligible interface contributions; a curved interface can instead require the Young–Laplace equation.
For positive latent heat in the stated conversion direction, the sign of the slope is the sign of . Converting liquid to gas normally increases volume and gives a positive slope. The negative melting-point slope of water illustrates the opposite sign. At a thermodynamic critical point, the coexisting gas and liquid merge: both and vanish, so their ratio needs a limiting analysis rather than substitution of zero into the Clapeyron equation.[ref]
Statistical Physics by David Tong. §5.1.2, equation (5.185) and the discussion of the critical endpoint
A short derivation uses the molar Gibbs free energy , equal to the chemical potential for a pure substance. Equality persists along the boundary, so with . Therefore . Equality of also gives . Eliminating yields the Clapeyron equation.
The equilibrium partial pressure of a vapour in contact with its condensed phase at a specified temperature. With constant specific latent heat and negligible condensed-phase volume, . The condensed phase and any metastability convention must be specified.
For a dilute ideal gas vapor whose specific volume greatly exceeds that of its condensate, the Clausius-Clapeyron relation integrates to the displayed formula. If , the result is . Near the liquid-gas critical point, both the ideal gas approximation and the neglect of condensed-phase volume fail; zero latent heat alone does not determine the limiting coexistence slope.
Floating ice with submerged volume fraction has density by Archimedes' principle. Its volume change on melting is therefore . An enthalpy cycle gives for quantities consistently expressed per mass at the same temperature. Treating these latent heats and specific volumes as constant and integrating the Clausius-Clapeyron relation gives the displayed pressure estimate. Using a vaporization latent heat extrapolated from a different temperature carries that approximation into the inferred fusion heat.
Molar crystal volume follows from with atoms per cell for an elemental solid. Combining two such values with their molar entropy difference gives . Ambient values supply only an approximation to a high-pressure coexistence slope, not a phase-boundary intercept.
For liquid–gas phase coexistence, make two distinct approximations: the gas obeys the ideal gas law, , and its molar volume greatly exceeds the liquid molar volume, . Here is the molar gas constant and is the saturation pressure of the pure substance. Substitution into the Clapeyron equation giveswhere is any fixed reference pressure, making the logarithm dimensionless. Constant latent heat is a further approximation, needed for the elementary Integrated Clausius-Clapeyron relation below.[ref]
Statistical Physics by David Tong. §5.1.2, “An Approximate Solution to the Clausius-Clapeyron Equation”: the three assumptions and the exponential solution
The neglected liquid molar volume has a transparent error estimate. If the gas is ideal but is retained, thenThus ignoring the liquid molar volume underestimates this slope by a relative amount . This estimate does not bound errors from treating a real gas as ideal or from freezing . Near a thermodynamic critical point, the gas and liquid molar volumes approach each other and these dilute-vapor assumptions fail.
If the molar latent heat is approximately constant on the chosen temperature interval, the ideal-vapor Clausius-Clapeyron approximation integrates toFor , higher absolute temperature gives higher saturation pressure. A plot of against inverse temperature is a straight line of slope . One reference pair fixes its intercept. On a per-unit-mass basis replace by , with and the molar mass; using in with the molar would give incompatible units.
If only the constant-latent heat approximation is relaxed, the same ideal-vapor model instead givesConsequently an apparent straight-line fit across a broad temperature range need not represent a single material constant. The simple exponential also approaches a finite value as ; this is a property of the stipulated formula, not a prediction that liquid–gas phase coexistence extends beyond a thermodynamic critical point.
Consider an unnamed model substance with molar latent heat and saturation pressure at . Stipulate the ideal-vapor Clausius-Clapeyron approximation throughout , constant , and . These parameters define an illustrative model, not a measured dataset or a fit to water. At ,At the reference state the gas molar volume is , and the local slope is . The tangent estimate is much lower than the integrated result: a local derivative should not be extrapolated over this whole interval. By contrast, over a small temperature increment, the fractional sensitivity is .
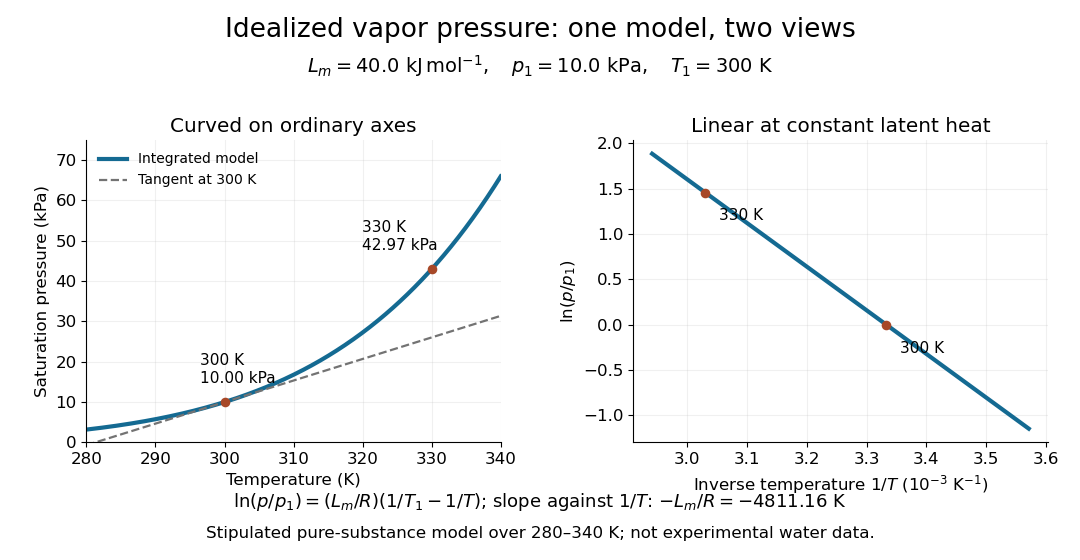
Stipulated saturation pressure versus temperature and its linear logarithm versus inverse temperature
. Details. Within the ideal-vapor Clausius-Clapeyron approximation, a local slope of the natural logarithm of saturation pressure against inverse temperature estimates the molar latent heat:In the stipulated vapor-pressure calculation, the slope is , which recovers . For variable , a two-point estimate gives an average weighted by , rather than the latent heat at an arbitrary midpoint. Differentiating noisy pressure measurements amplifies their errors. Outside the ideal-vapor regime, use independently determined molar volumes in ; a straight-looking graph alone cannot establish that the gas is ideal.
A concrete experiment turns the phase coexistence curve into pairs of temperature and saturation pressure. A 1969 paper reports water measurements made in 1942 and 1947–1949 using a boiler and precision mercury manometer. Platinum resistance thermometers read the boiler temperature through a resistance bridge. The pressure-transfer line passed through an ice-water condenser and a dry-ice trap; helium filled connecting sections. Corrected mercury column height gave the pressure at the thermometer coils, including hydrostatic pressure contributions from water vapor, helium, mercury, and mercury vapor.[ref]
Some Precise Measurements of the Vapor Pressure of Water in the Range From 25 to 100 °C by H. F. Stimson. Stimson, §§1–2, pp. 493–495: boiler, bridge thermometry, and fluid-head corrections
Controls included normal/reversed-lead readings, readings at two thermometer electric currents extrapolated to zero current to remove self-heating, repeated bridge calibration, and daily triple point thermometer calibration checks. Cellar temperature measurements corrected fluid-column and gauge-block thermal expansion. One measurement series was excluded because a trapped gas bubble was suspected of corrupting the mercury head. The paper adjusted measurements to round temperatures using previously tabulated slopes; those adjusted values therefore are not independent measurements of those slopes.[ref]
Some Precise Measurements of the Vapor Pressure of Water in the Range From 25 to 100 °C by H. F. Stimson. Stimson, §2, pp. 494–495, and §3, p. 495: corrections and suspected gas-bubble bias
The thermodynamic inference requires liquid and gas in phase coexistence, a well-defined common temperature, and a pressure corrected to that same location. Leaks, contamination, or a temperature gradient can spoil that interpretation. A separate calorimetry measurement of latent heat, together with the two specific volumes, allows a test of the full Clapeyron equation. Converting a measured phase coexistence curve slope directly into latent heat instead assumes that equation; it is not an independent test.
When the solid and liquid have the same pressure, equality of chemical potentials implies . With latent heat of fusion , this gives the displayed slope. If solid is less dense than liquid, raising the common pressure depresses the melting temperature. is absolute temperature. This coexistence-curve derivative differs from a thermomolecular pressure difference between equal-density phases.
For a local illustrative ice–water melting calculation, stipulate , latent heat of fusion , solid mass density , and liquid mass density . These are explicitly stipulated rounded inputs, not measurements made here. The specific volume change on melting isThe common-pressure melting-point slope therefore givesA small increase in the common pressure thus lowers the melting temperature by about in this local model. Positive latent heat does not force a positive phase coexistence curve slope: ice contracts on conversion to liquid water. Increasing pressure favors the smaller specific volume. This calculation compares equilibrium states of the same two thermodynamic phases; extending its tangent to large pressures would require updated mass densities, latent heat of fusion, and the relevant ice phase diagram.
Articles by others on the same topic

Gibbs free energy, often denoted as \( G \), is a thermodynamic potential that measures the maximum reversible work obtainable from a system at constant temperature and pressure. It is a crucial concept in chemistry and thermodynamics as it helps determine the spontaneity of processes and the equilibrium position of reactions. The Gibbs free energy is defined by the following equation: \[ G = H - TS \] where: - \( G \) is the Gibbs free energy.



At least from the formula we see that:
- the more exothermic, the more likely it is to occur
- if the entropy increases, the higher the temperature, the more likely it is to occur
- otherwise, the lower the temperature the more likely it is to occur
A prototypical example of reaction that is exothermic but does not happen at any temperature is combustion.
Lab 7 - Gibbs Free Energy by MJ Billman (2020)
Source. Shows the shift of equilibrium due to temperature change with a color change in a HCl CoCl reaction. Unfortunately there are no conclusions because its student's homework.